


Trade of The Day – AUD/JPY
period moving average
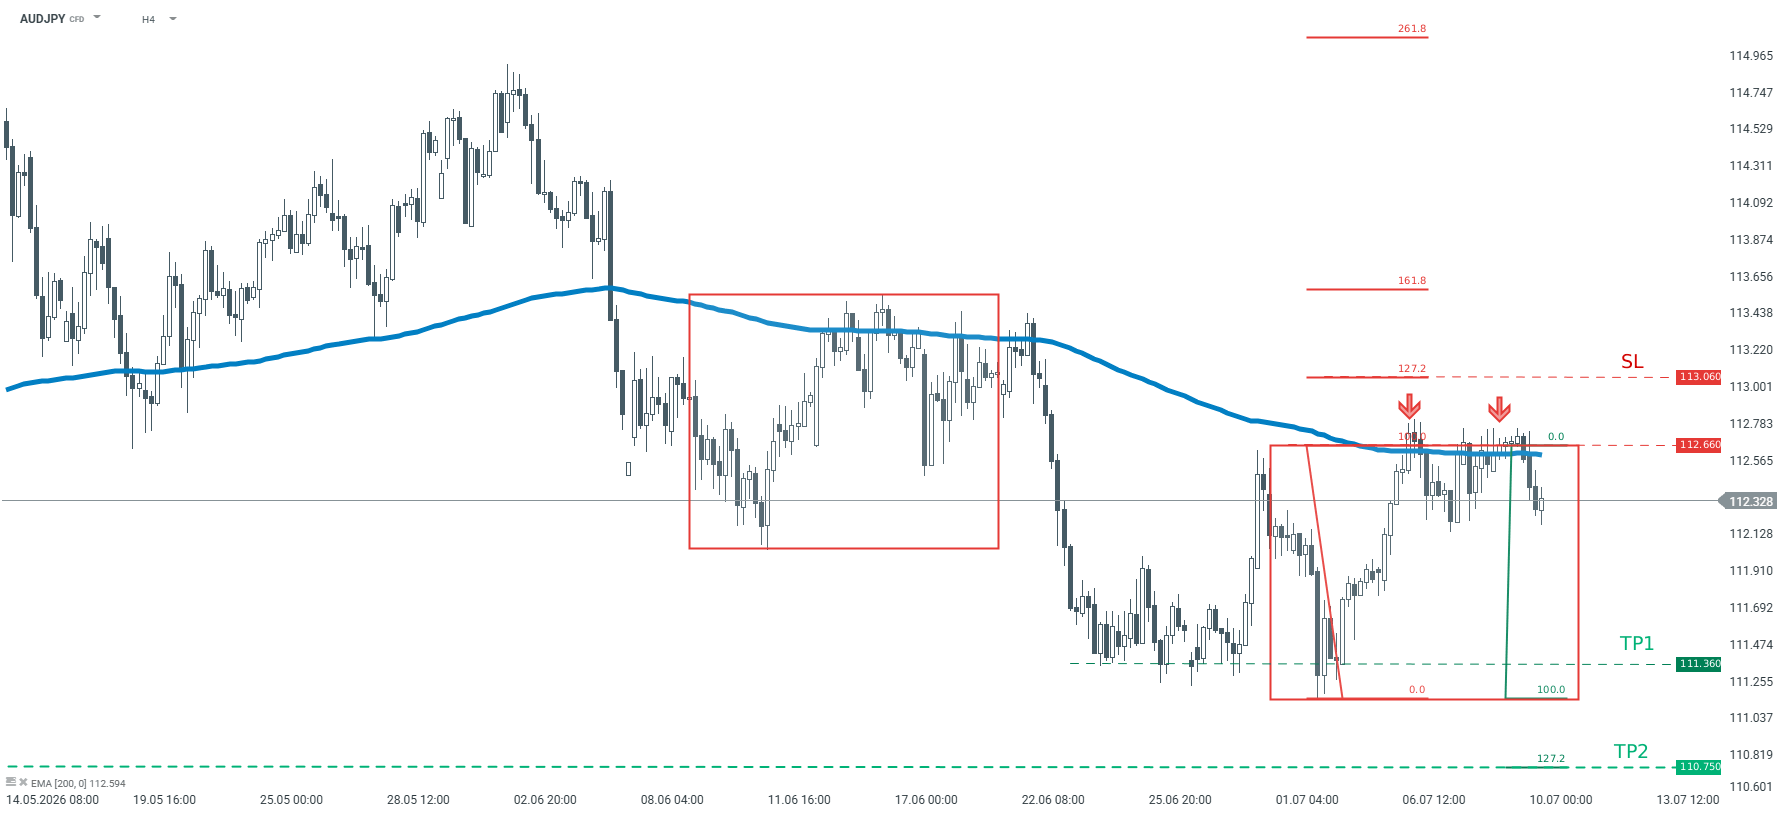
Recommendation: Trade: Short AUDJPY at market price Target: 111.36, 110.75 Stop: 113.06
Opinion:
Looking at AUDJPY on the H4 interval, one can see that the pair is trying to return to the main trend. Bulls did not manage to break above the key resistance at 112.66, and sellers took over. The aforementioned resistance is a result of an upper limit of 1:1 structure. According to the Overbalance strategy, as long as the price sits below it, one should expect the price to go lower. In addition, the price sits below the 200-period moving average which confirms the bearish sentiment. We recommend going short AUDJPY at market price with two targets: 111.36, 110.75 We also recommend placing a stop loss order at 113.06.
Source: xStation5

Currency Hedger – NFP Preview
NFP preview:
Will there be a World Cup boost? The June payrolls report is released today at 1330 BST, a day early this month due to the Independence day holiday on Friday. The market is expecting an approximately 113k increase in payrolls, which is a step down from the 172k print for May, the unemployment rate is expected to remain stable at 4.3%, and average hourly earnings could pick up a notch to 3.5% from 3.4% YoY. The strong reading for May makes the June report a test: can the upside momentum be maintained, or was the May figure an anomaly? Federal government jobs jumped last month, but this is expected to be one-off. If we get a reading that is close to consensus, then it would suggest modest growth in US jobs numbers are continuing. This would point to a resilient labour market that is not falling off a cliff.
Resilient labour market
Average monthly jobs growth this year has been above 80k, and we do not expect a number lower than this. The Atlanta Fed’s GDPNow model is predicting robust GDP growth for Q2 of 2.5%, which should easily support US job growth of 100k plus. We expect the bulk of jobs to have been created in the education and healthcare sector, with decent gains for construction and leisure and hospitality. The question is, could there be a World Cup boost? Stadium attendance at games so far in the US has hit a record high, of more than 3.5mn, which could boost hotels and the leisure sector.
Will payrolls boost Fed rate hike chances?
This payrolls report comes a day after the new Federal Reserve Chair, Kevin Warsh, spoke at the ECB’s central bankers conference in Portugal. Kevin Warsh said a few things that are worth noting. Firstly, that inflation expectations are moderating, secondly, that AI’s impact on the jobs market is not yet visible and thirdly, that his task forces could change what economic data the Fed focuses on. The latter point is worth noting. Although we think that payrolls will remain important for central bank decision making, change is coming at the Fed. As we lead up to this payrolls report, the market continues to price in a 28% chance of a rate hike at the Fed’s next meeting on 29th July.
Interest rate futures markets have repriced rates higher after a surprisingly hawkish FOMC meeting, and if we get a significant upside surprise for payrolls today, of 180k plus, then we could see the chance of a July rate hike surge past 50%. So far, the lead indicators have been mixed. Although the ISM manufacturing employment index was stronger, it remained below 50. Added to this, the ADP private sector payrolls report was slightly weaker than expected and was 113k for last month. The 4-week moving average for initial jobless claims ticked higher last week, but at 224k, it is still low.
The impact of a downside surprise
A downside surprise of 70k or lower could see the US Treasury curve steepen, as 2-year Treasury yields fall, and long-end bond yields rise. We think a weaker number could also lead to a recalibration of US interest rate expectations, and we think the Fed would be unlikely to hike rates in July if the labour market is showing signs of softening, especially if the unemployment rate also rises.
What’s next for the dollar
This data will also be the next major driver of the dollar, at least until we get the June CPI report. The US dollar index is at a 14-month high, and the US dollar is the best performing currency in the past year. In the past month, the USD index has risen by 2.5%. The break above 100.50 2 weeks ago was an extremely bullish development, and is supportive of further gains. However, the forex market can be contrarian around payrolls reports, so we could see some buying the rumour, before selling the fact later on Thursday. The technicals continue to point in a bullish direction, so the path of least resistance is for further gains for the Greenback. If payrolls are weak, and the dollar does experience a sell off, as long as the dollar index does not fall below 100.50, then the uptrend remains intact.
Chart 1: The dollar index
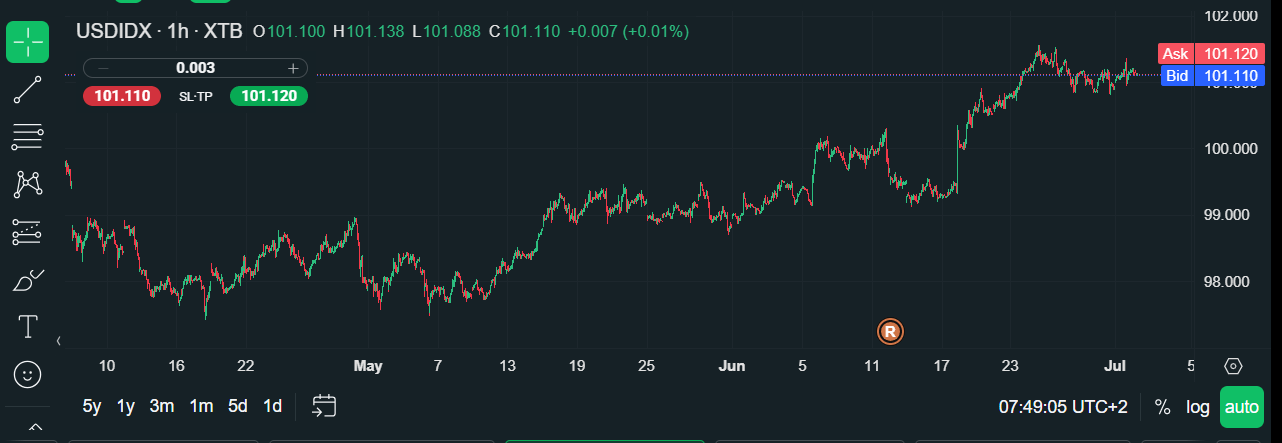
Source: XTB

Chart of The Day – Is The USD/JPY in a stable trend or at a turning point?
USDJPY is trading slightly lower this morning at 162.70 (-0.15%) after hitting new multi-year highs around 163, as the market awaits the key U.S. payrolls report.
Context of Today’s NFP Data
Today’s June payrolls report is the main catalyst of the day—the consensus expects a marked slowdown to about 110,000 jobs following a surprisingly strong May reading of 172,000, with the unemployment rate holding steady at 4.3% and wage growth accelerating to 3.5% y/y. The market is trying to assess whether May’s surge represented a genuine labor market recovery or merely a one-off effect (including the World Cup in the U.S.). Employment growth this year has averaged above 80,000, which supports the scenario of a resilient labor market. CBA warns that another positive surprise could push USD/JPY toward 165 and test the Japanese authorities’ determination to defend the yen, while a weak reading (below 70,000–90,000) would ease pressure on the Fed to remain hawkish and could trigger a downward correction in the pair.
Technical Analysis
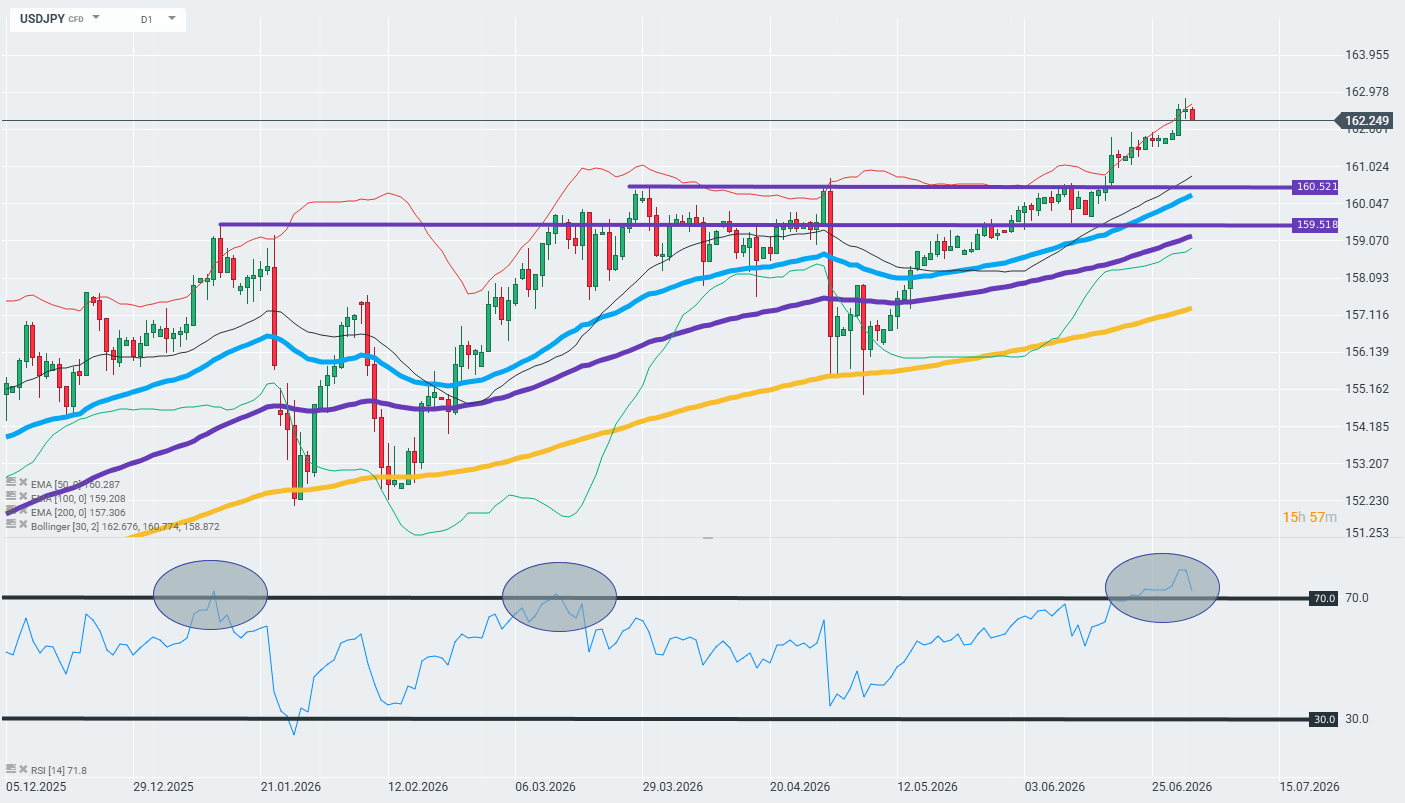
The price broke through key resistance levels at 159.52 and 160.52 JPY with momentum, moving clearly above the 50-day EMA (160.29), the 100-day EMA (159.21), and the 200-day EMA (157.31), confirming a strong uptrend. However, the RSI at 71.8–76.2 signals overbought conditions on the daily chart, which historically has preceded short-term consolidations or corrections, especially near multi-year highs. The trend remains clearly bullish for the dollar (bearish for the yen), and the 162–163 range also represents an area of heightened risk of currency intervention by Japanese authorities. Source: xStation
A Brief Look at Data from Japan
The Bank of Japan raised its policy rate to 1.0% in June—the highest level in 31 years—but the market does not expect another hike until the October–December 2026 window, even though about 90% of economists anticipate one more hike by December. This slow pace of policy normalization by the BoJ, coupled with the hawkish stance of the Fed, is the main structural reason why the interest rate differential between the U.S. and Japan remains wide and is sustaining the yen’s long-term downward trend—verbal interventions by Japanese officials have so far failed to permanently reverse this trend.

Technical Analysis – EUR/USD
Since mid-April, the EUR/USD pair has been trending downward. Recently, new lows were set and the March lows were broken, confirming the dominance of the supply side. We are currently observing a local upward correction. The price is approaching a key short-term resistance level at 1.1430, where, among other things, the lows from mid-March of this year are located.
This is the first zone where increased selling activity may emerge. If the 1.1430 level were to be broken through on a sustained basis, the next significant resistance level would be around 1.1466, where the upper boundary of the 1:1 geometry and the 100-period moving average—marked in blue on the chart—are located. A bounce off both the 1.1430 and 1.1466 levels could trigger another downward wave.
Only a sustained break above the 1.1466 zone could invalidate the current setup and increase the chances of a larger upward correction. For now, however, the base case scenario remains a continuation of the downtrend.
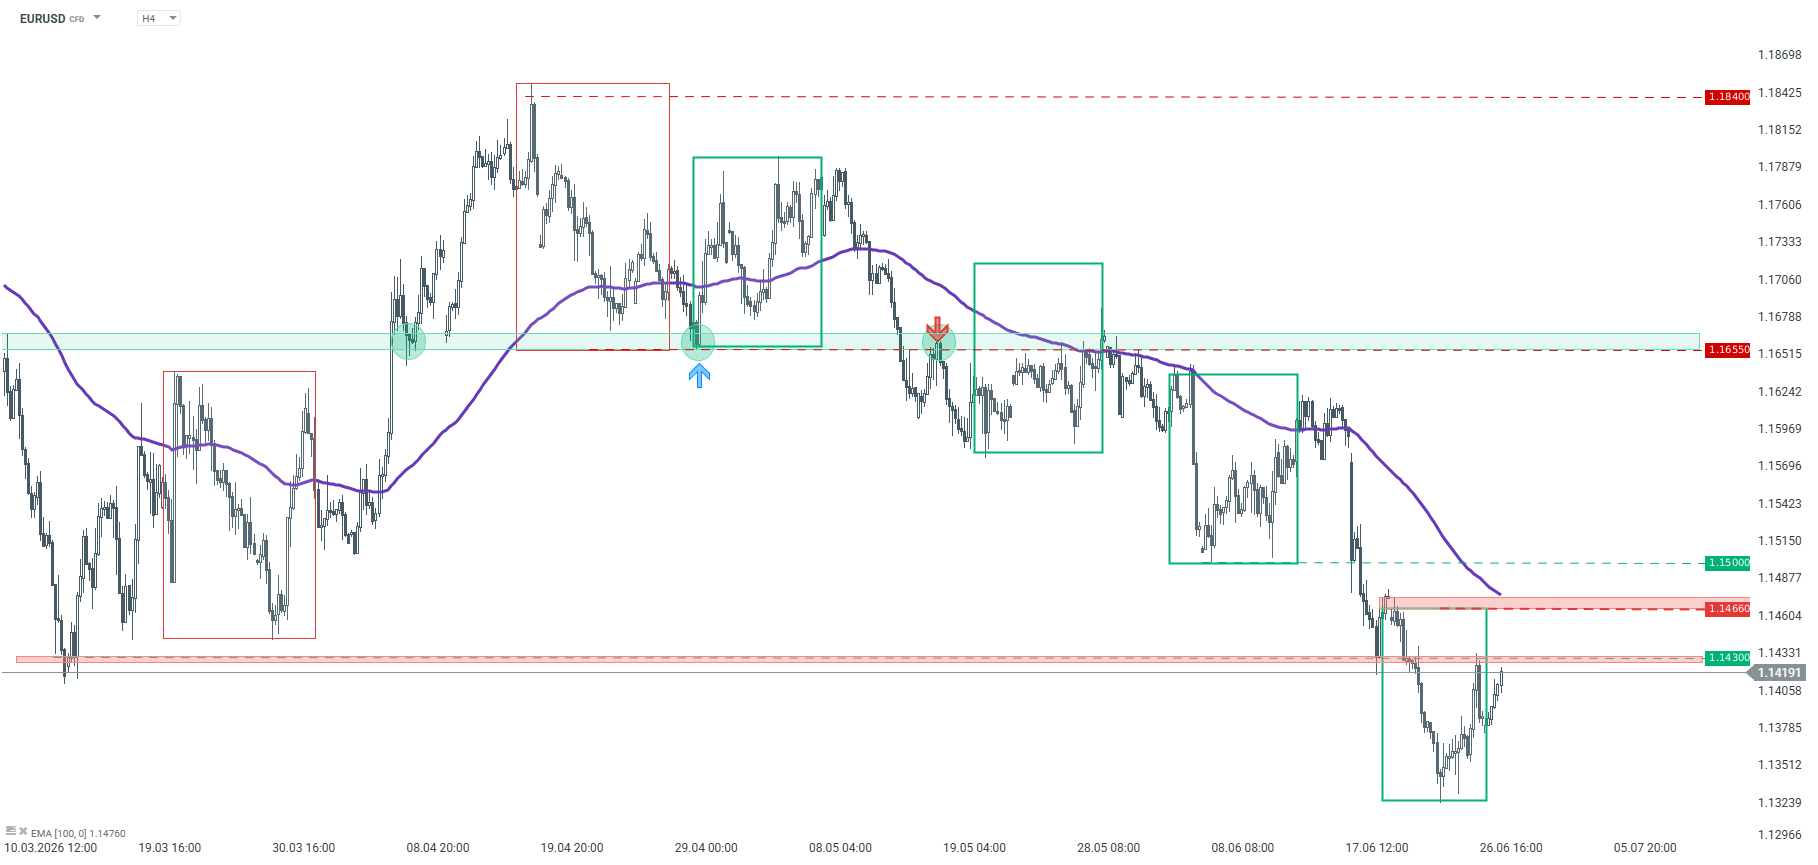
EURUSD – H4 timeframe. Source: xStation5

The Physics of Scarcity – Copper’s Path to a Structural Deficit
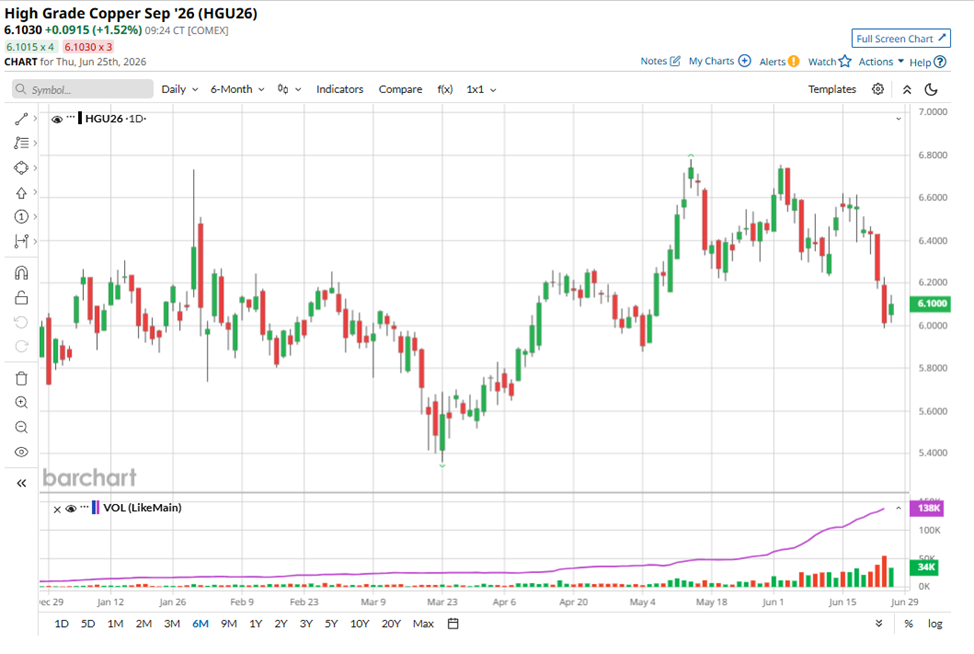
If you look at the copper market chart over the past 10 years, it might seem like a perfectly balanced system. Market “bears” love to point to these figures. Global consumption has grown to about 28 million tons per year, but the industry has coped. Production has increased, and supply has met demand. No copper apocalypse has happened yet.
At first glance, everything is under control — but this is a very dangerous illusion. Those who assess copper’s prospects relying only on the charts of the past decade are making a fundamental mistake. They see that the system has remained in balance, but they fail to understand how this balance has been maintained.
Personally, I have come to the conclusion that the copper market has survived due to powerful “compensators” in recent years. This refers to a phenomenal technological leap in mining, the depletion of the richest legacy deposits, and the aggressive pushed-to-the-limit collection of secondary raw materials. The problem is that all of these compensators are not infinite.
The era of easy solutions is over. To understand why the next 10 years of the copper market will not look like the previous decade, we need to put aside financial reports and recall the basic laws of physics.
A Physical Dead End: Why Copper Cannot Be Replaced
When we talk about oil, we know there are alternative sources of energy. Solar. Wind power. But when it comes to power electrical engineering, copper has become an unrivaled monopolist — and the reasons for this are embedded in the universe’s architecture itself.
Why is there so much aluminum, silicon, and iron on Earth but so little copper? The answer lies in the stars. All chemical elements lighter than iron are synthesized in the cores of stars during their normal lifespans, so they are abundant in the Earth’s crust. But copper is heavier than iron.
Elements of this type are born in the universe only during events like supernova explosions or neutron star mergers. Pure physics tells us that copper is inherently present in nature in orders of magnitude less than lighter metals. It is a non-renewable resource, and total geological reserves are fundamentally limited.
Ohm’s Law and the Engineer’s Trap
Copper has a uniquely low electrical resistivity. Only silver performs better, but it is too rare and insanely expensive for industrial use.
But why not replace copper with cheap aluminum, which is plentiful? This is where the main technological trap lies. Aluminum is great for overhead power lines where wire thickness is not critical, but aluminum’s resistance is much higher than copper’s resistance. If you try to wind an electric motor coil from aluminum wire instead of copper, you will have to make the motor much heavier to get the same power.
For the modern world — where the compactness and efficiency of electric vehicles (EVs), drones, and industrial robots are crucial — this is an engineering death sentence. You cannot put a refrigerator-sized motor in a modern EV. In closed systems where electricity is converted into kinetic energy, there is simply no substitute for copper.
Copper Devourers: The Real Reason for Exponential Demand
When the average person hears about copper demand, they probably imagine wires in the walls of new houses or cables for data centers. Yes, those use cases are important. But a cable in a wall is static demand — it is laid once and serves for decades. The real monster beginning to devour global copper reserves right now is the electric motor.
The world is in a stage of transitioning to electric propulsion, and this process is only gaining momentum. The heart of any electric motor is a tightly wound copper stator and rotor coil. The more motors, the faster copper reserves are depleted. Take EVs. The average electric car requires three to four times more pure copper than a traditional internal combustion engine (ICE) vehicle, and the lion’s share of this metal goes not into the wiring but directly into the massive power unit.
Add to this total automation. In modern factories, every new industrial robot, conveyor, servo drive, powerful pump, or climate-control system means dozens and hundreds of new electric motors.
Copper demand from electric drive manufacturers will grow not linearly, but exponentially. Humanity will produce hundreds of millions of new electric motors in the coming decade, and each of them will require a metal born in supernovas. A metal that engineers physically cannot replace with cheap aluminum.
Tactical Shock: AI Infrastructure and Liquid Cooling
While electric motors are a fundamental demand driver for the next decade, a massive tactical shock is also unfolding in the market right now: infrastructure for artificial intelligence (AI).
In 2024, at the peak of the first wave of the AI hype, investors were buying shares of chipmakers. For the copper market, this didn’t matter much. Microprocessors and printed circuit boards themselves consume a negligibly small amount of metal, compared to a scale of millions of tons. But now the virtual hype has turned into a giant physical construction site.
Modern server racks for AI consume a massive 100 to 120 kilowatts of energy, and ordinary cables simply cannot handle such a load. The industry is urgently shifting to massive copper busbars. These are thick, solid strips of pure copper for power distribution within racks.
Moreover, with such heat dissipation, traditional fans can no longer cope. Data centers are being forced to switch to direct liquid cooling systems, which means kilometers of copper tubing, copper cold plates on processors, and giant heat exchangers. In these systems, copper is necessary due to its phenomenal thermal conductivity.
Yes, in absolute terms, data centers do not consume millions of tons like the auto industry. But in the commodity market, the price balance is determined by marginal demand. In an environment where the copper market is already stretched, the sudden emergence of an industry that urgently needs additional tens of thousands —and even hundreds of thousands — of tons of copper becomes that very drop. The drop that overflows the cup.
Production Crisis: The Age of ‘Compensators’ Is Over
So, copper demand is guaranteed to go up due to mass electrification and millions of new electric motors. But why won’t the mining industry be able to respond to this challenge the same way that it has over the last 10 years?
The answer lies in the exhaustion of the three main “compensators” that have so far masked the looming deficit.
Over the past two decades, the mining industry has made a colossal leap in labor productivity. The introduction of giant 400-ton autonomous haul trucks, automated drilling rigs, and control systems has allowed companies to sharply reduce production costs.
This technological boom made it profitable to extract copper from extremely low-grade ore. If 50 years ago, a copper grade of 1% to 2% was considered the norm, today industry giants are forced to process ore with a grade of only 0.4% to 0.5%.
But this technical progress is not infinite. The effect of automation will weaken because raising efficiency, having a high base, will become more and more difficult. Modern dump trucks are already highly efficient. But as the quality of the remaining ore in the ground continues to decline, mining the same ton of copper will now require processing more and more waste rock. That means higher costs for energy, water, and logistics — costs that can no longer be offset by smart electronics.
The Secondary Processing Wall and the Scrap Illusion
“Bears” often argue their position by claiming that the deficit will be covered by processing secondary raw materials. Indeed, in recent years, as copper prices moderately rose, the world began to collect and recycle scrap much more meticulously. Dry statistics, at first glance, give them reason for optimism. From 2024 to 2025, global production of secondary refined copper made an anomalous jump from 4.705 million tons to 5.345 million tons.
But a fundamental mistake lies here. This is a banal misunderstanding of the difference between primary and secondary raw materials.
Primary extraction of ore from the ground is a real, systemic influx of new metal into the economy, while secondary scrap is merely an exhaustible reservoir from past years. Rising prices forced the market to aggressively “vacuum up” scrap, but this process has a strict economic limit. Secondary raw material collection has its own cost curve. You can quickly and cheaply pump easily accessible reserves out of the market, but as soon as this superficial reservoir empties, the cost of finding, dismantling, and transporting each subsequent ton of old copper skyrockets.
If you want to see what this trap looks like in real time, just look at statistics from the International Copper Study Group for early 2026. Fundamental global mine production for January to April 2026 dropped to 7.446 million tons compared to 7.551 million tons for the same period in 2025. This means that physically less metal was extracted from the ground.
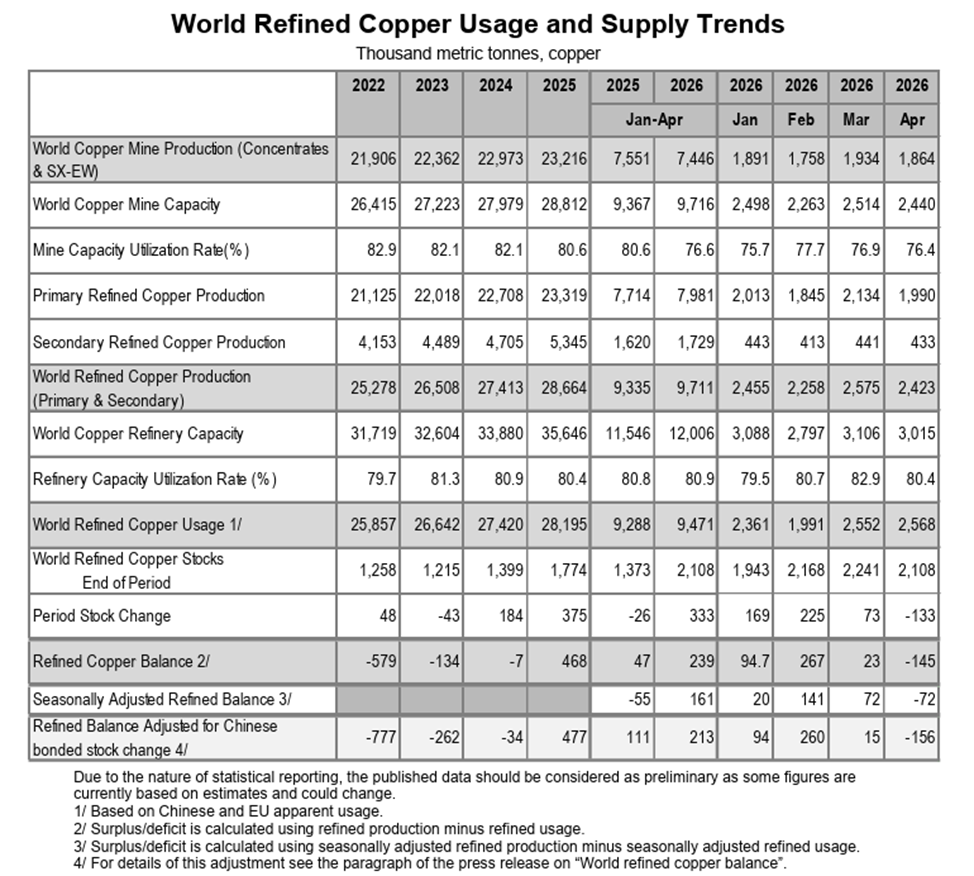
So, where did the temporary surplus at the beginning of the year come from? Smelters simply “threw into the furnace” the accumulated scrap reserves. Secondary production over the same period grew from 1.62 million tons to 1.729 million tons.
But this surge in secondary processing cannot be extrapolated into the future. You cannot systematically load capacity with scrap because it depletes quickly. Already in April, the overall refined copper balance plunged into a deficit of -145,000 tons.
A Geological and Time Dead End
New large and easily accessible copper deposits on the planet simply aren’t being discovered. All the “easy” copper has already been mined.
To launch a new mega-mine from scratch in the current environment, it takes 10 to 15 years — from initial geological exploration and obtaining environmental permits to shipping the first commercial ton. For many years, the capital expenditures of mining companies were constrained due to low commodity prices.
Because of this underinvestment in the past, the physical supply of copper today is locked in time. The industry will simply not have time to ramp up capacity by the time demand makes its next leap.
Copper Is the Main Metal of the Future
Without copper, the entire “green” and technological revolution will simply halt on paper. Copper is not just an industrial raw material. It is the physical foundation, the blood, and the muscles of the future.
What we have seen on the charts recently — breaking local highs and the start of an uptrend — is not temporary speculative hype. It is the very beginning of a tectonic shift. The broader market is only just beginning to realize the scale of the impending problem.
In the next 10 years, the copper market will inevitably enter a phase of structural deficit. Since supply is constrained by physical, geological, and technological boundaries, and secondary reserves are already being fully utilized, the only way to balance the market in the future is “demand destruction.” And the only mechanism for demand destruction in a market economy is a price increase.
Copper prices will have to reach fundamentally new historical levels — levels so high that some consumers will simply refuse to use copper where it is still physically possible. This very action will be able to balance supply and demand.
For the long-term investor, this forms one of the most reliable and asymmetric opportunities in the market. Investing in copper, and in the shares of fundamentally strong mining companies with real reserves in the ground, is not a bet on market

AI Power Stocks Could Be a Once-in-a-Generation Trade. Start With the Companies Behind Every Data Center.
arvell (MRVL). The chip producers, the ones that are reporting double to triple-digit growth quarter over quarter. The ones that dominate headlines with big green charts and arrows every time.
But it takes far more than silicon to run artificial intelligence (AI).
Every AI model, every chatbot response, and every image generation request ultimately runs inside a data center. And those data centers consume staggering amounts of electricity.
In fact, as AI workloads continue to expand, power increasingly becomes the limiting factor in day-to-day operations. You can have the newest and most advanced GPU clusters around, all cooled by the most sophisticated thermal tech in the industry, connected by the best networking platforms in the world.
But none of that matters if you don’t have enough electricity to turn on any of the servers.
That’s why some investors are looking beyond semiconductors and toward a less obvious beneficiary of the AI boom: the companies that generate and deliver the power that keeps these data centers online, and the ones that are building the parts that make it all happen.
Why AI is driving a $2.2 trillion power market
The power generation industry is valued at around $1.3 trillion today, according to industry estimates, and is expected to grow to $2.2 trillion by 2034.
Historically, the biggest driver of the power generation industry was the increasing urbanization of developing countries. But the sharp rise in data center demand, with its enormous requirements for computing power, is what’s further driving that expected growth.
As a result, companies across the power value chain stand to benefit from what could become a decade-long investment cycle, not only from AI but also from secular tailwinds.
Where are the sector bottlenecks?
Before anything else, we need to cover where the opportunities are in the power sector, at least in the context of AI demand. And to do that, we need to break down the value chain and see where the bottlenecks lie.
Power producers and the 20-year PPAs feeding AI data centers
First, we have the raw materials and energy producers. Think fuels: natural gas (NGQ26), solar, wind, and uranium, as well as the companies that convert them into energy. This is the business at the very base of the value chain, where everything starts.
Historically, many power producers sold electricity into wholesale markets, where prices fluctuate based on supply and demand. But the rise of AI is changing that dynamic.
Hyperscalers such as Microsoft (MSFT), Amazon (AMZN), Google (GOOGL), and Meta (META) increasingly need guaranteed, 24/7 access to massive amounts of power. By that, I mean they can’t just connect to a light socket and call it a day. They need to go straight to the power producers to get what they need.
Power producers respond, usually in the form of power purchase agreements (PPAs), in which the data center operator commits to buying electricity from a producer for extended periods, often lasting 20 or more years. These agreements provide energy companies with stable, predictable cash flows while giving data center operators confidence that sufficient power will be available as they expand capacity.
So, when you see a power company bagging one of these PPAs from a hyperscaler, you know you’re seeing trust and validation in one deal. Now, if you see multiple deals, well, that just solidifies the bull case.
The biggest example of this kind of relationship is between Microsoft and Constellation Energy.
Constellation Energy (CEG): The go-to stock for AI nuclear power
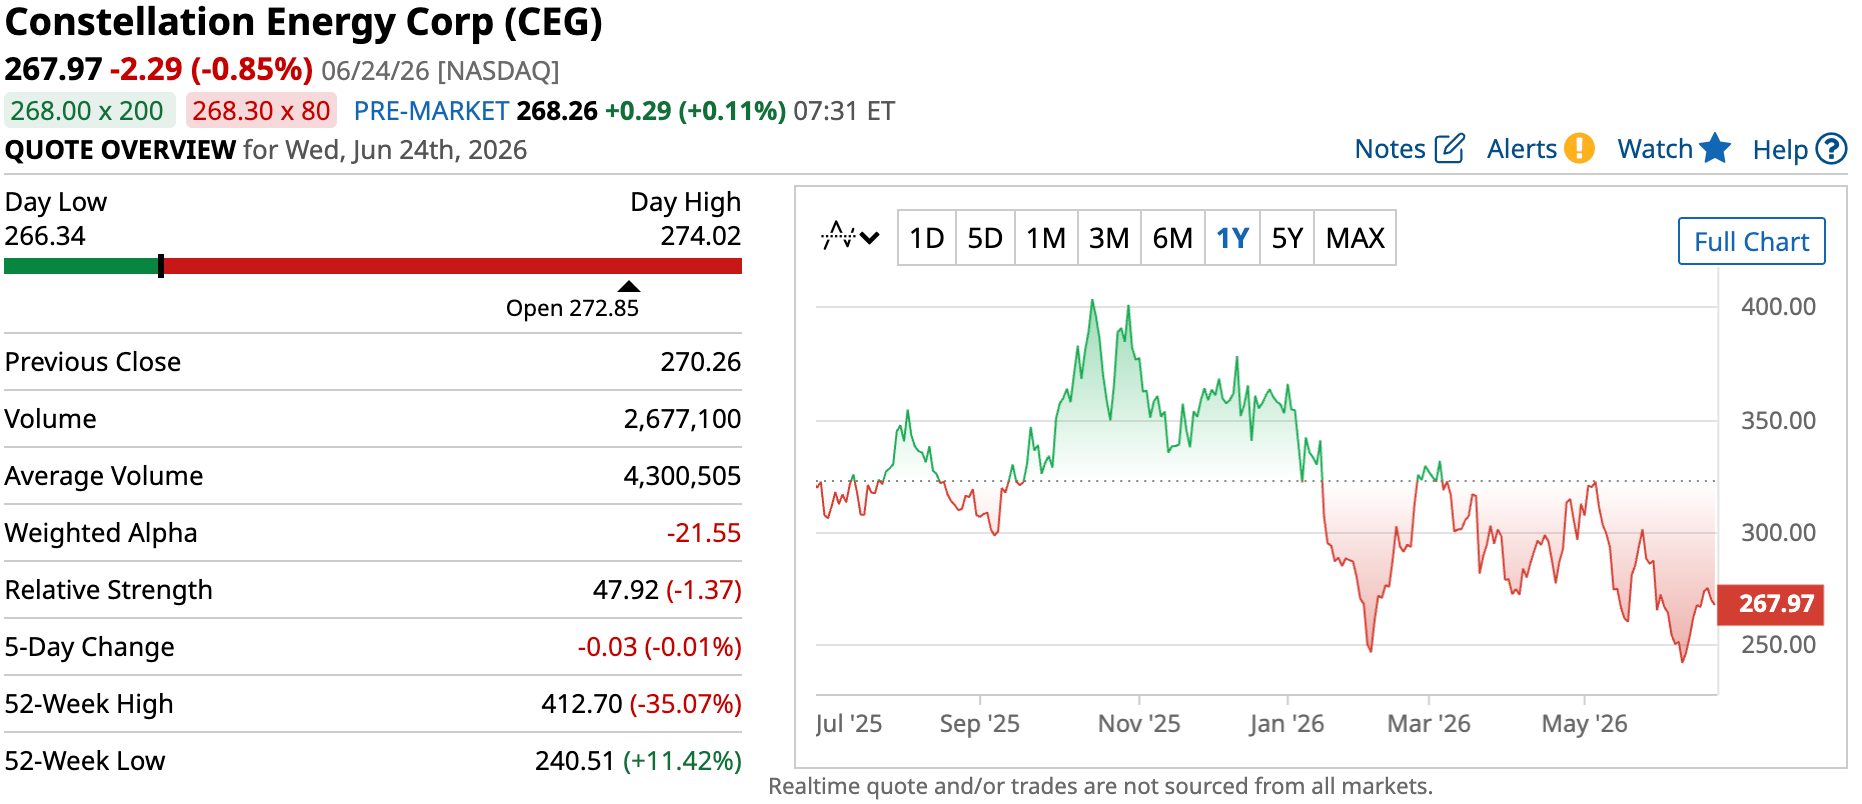
Just a couple of years ago, Microsoft inked a deal with CEG to create the Crane Clean Energy Center. This is a project that was widely reported to restart Unit 1 of the (former) Three Mile Island nuclear plant. The deal is for 20 years, with the PPA being so big that Constellation is investing ~$1.6 billion to bring the reactor (back) online for Microsoft.
Once Unit 1 is online, it could make as much as 7 million megawatt-hours of power per year, assuming everything runs as planned.
If that’s not all, last year, Meta inked a deal with Constellation to launch the Clinton Clean Energy Center. Like with Microsoft, the deal is for a 20-year PPA, and CEG will add an additional 30 megawatts of output by way of nuclear uprates. This particular PPA covers 1.21 gigawatts of clean nuclear power, which could translate to ~9 million megawatt-hours of annual production.
The Microsoft and Meta deals are standout examples of how CEG can grow for decades. Granted, the exact financial details of the PPAs haven’t been made public, but you can be almost sure they are going to be lucrative. In fact, some analysts estimate Microsoft could be paying between $110-115 per megawatt hour. If that were the case, it would imply as much as $800+ million in annual revenue – on the Microsoft deal alone.
Of course, CEG is not alone in bagging power deals with hyperscalers.
Talen Energy (TLN): The Amazon nuclear deal next door
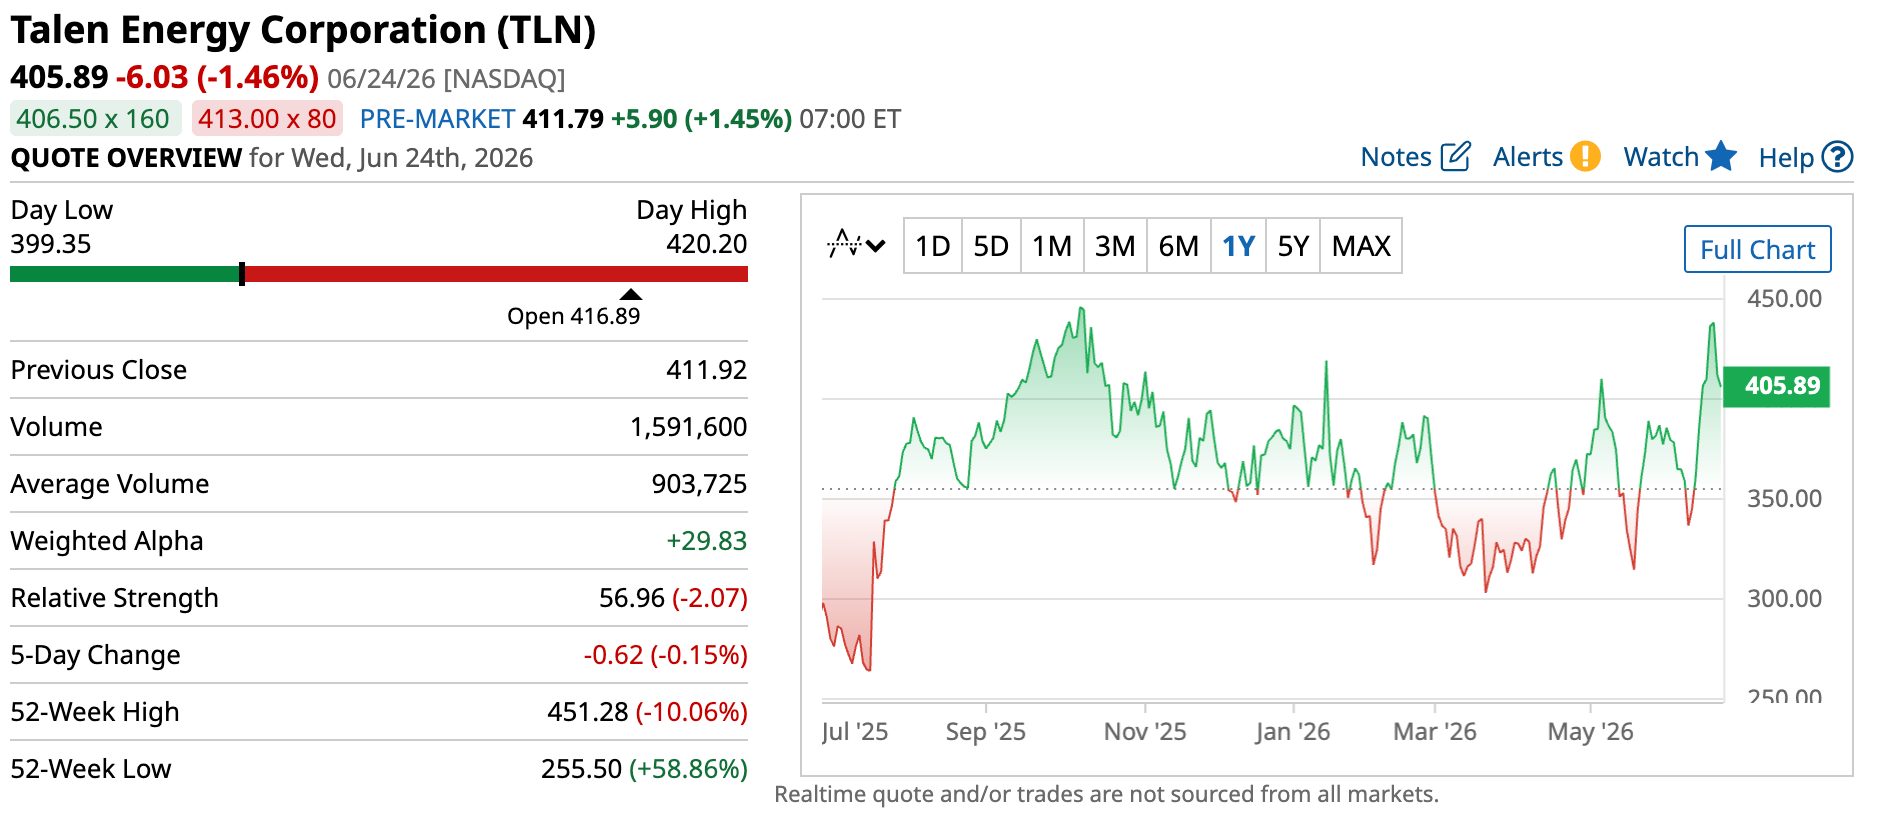
Talen Energy, a relatively new player in the space, has partnered with Amazon to produce up to 1.9 gigawatts of nuclear capacity from its Susquehanna plant. But Talen’s plant is directly adjacent to Amazon’s data center.
That means the deal can significantly reduce the need to move electricity across the broader transmission and distribution network. Instead of sending power across hundreds of miles of grid infrastructure, electricity can be delivered almost directly from the source to the data center.
The arrangement not only minimizes transmission losses but also helps hyperscalers secure reliable access to power in a market where grid capacity is increasingly becoming the bottleneck. No congestion pricing, no interconnection delays, and no third-party dependencies to worry about. That’s practically a match made in heaven for data centers.
But, true adjacency – as in building plants right beside data centers, instead of somewhere else that’s relatively nearby – faces growing geographical and regulatory constraints. Even now, just finding “good enough” places to build the next data center is becoming a challenge. Tack on a nuclear plant right beside it? The challenges multiply.
That’s why Talen Energy’s approach, while wildly attractive, may not be the gold standard. And that’s why we need to look into other parts of the value chain.
Cameco Corp (CCJ): The uranium picks-and-shovels play for AI
Now, as for the raw material providers, the relationship is one step removed from hyperscaler deals, but that doesn’t mean they don’t benefit from them. In fact, let me call your attention to another interesting player in the nuclear power space.
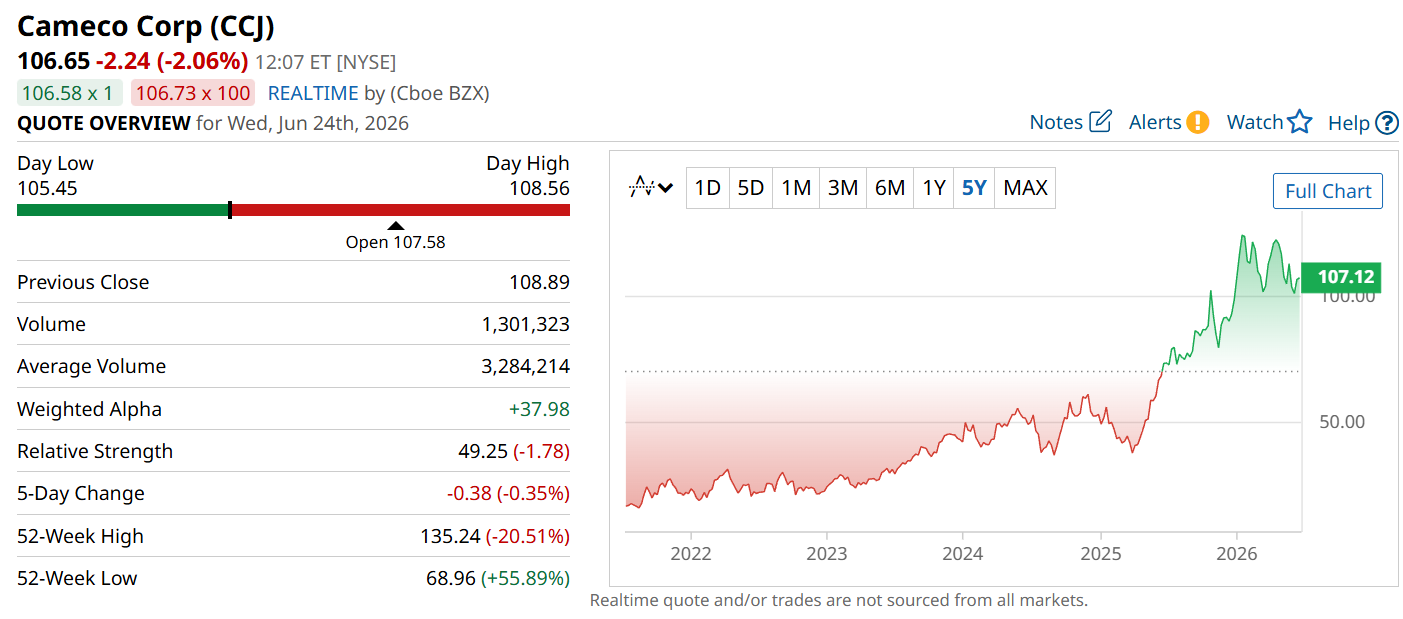
Cameco Corp operates a little further down the value chain. It doesn’t generate electricity, but it does produce uranium oxide concentrate, otherwise known as yellowcake. This is the preferred fuel by many nuclear reactor operators due to its high energy density, reliability, and ability to provide consistent baseload power.
Cameco has major mining operations in Canada and Kazakhstan, and also participates in nuclear fuel services and reactor technology. And while the company’s involvement in AI power growth isn’t as direct as CEG’s, as hyperscalers increasingly lean into nuclear, Cameco should grow. As demand for nuclear energy continues to rise, utilities like Constellation benefit from selling more electricity, while uranium suppliers like Cameco benefit from increased fuel demand. It’s a symbiotic relationship.
Of course, the relationship isn’t perfect. Cameco’s performance is still heavily influenced by uranium prices, supply dynamics, and long-term contracting activity. But as hyperscalers continue signing nuclear deals and utilities respond by extending the lives of existing reactors or building new capacity, the long-term outlook for uranium demand becomes increasingly attractive.
Quanta Services (PWR): The grid bottleneck behind AI power
Another bottleneck that’s becoming increasingly important for AI power demand is distribution. Transmission lines, substations, and grid infrastructure are all critical to supplying power-hungry data centers. And as one might expect, companies sitting in the crossroads are likely to benefit from the growing demand.
Certain companies that operate with true adjacency, like Talen Energy, remove this requirement entirely. But that’s somewhat unique in the space, so many power providers and hyperscalers still need to deal with distributors.
One of the clearest examples of this is Quanta Services.
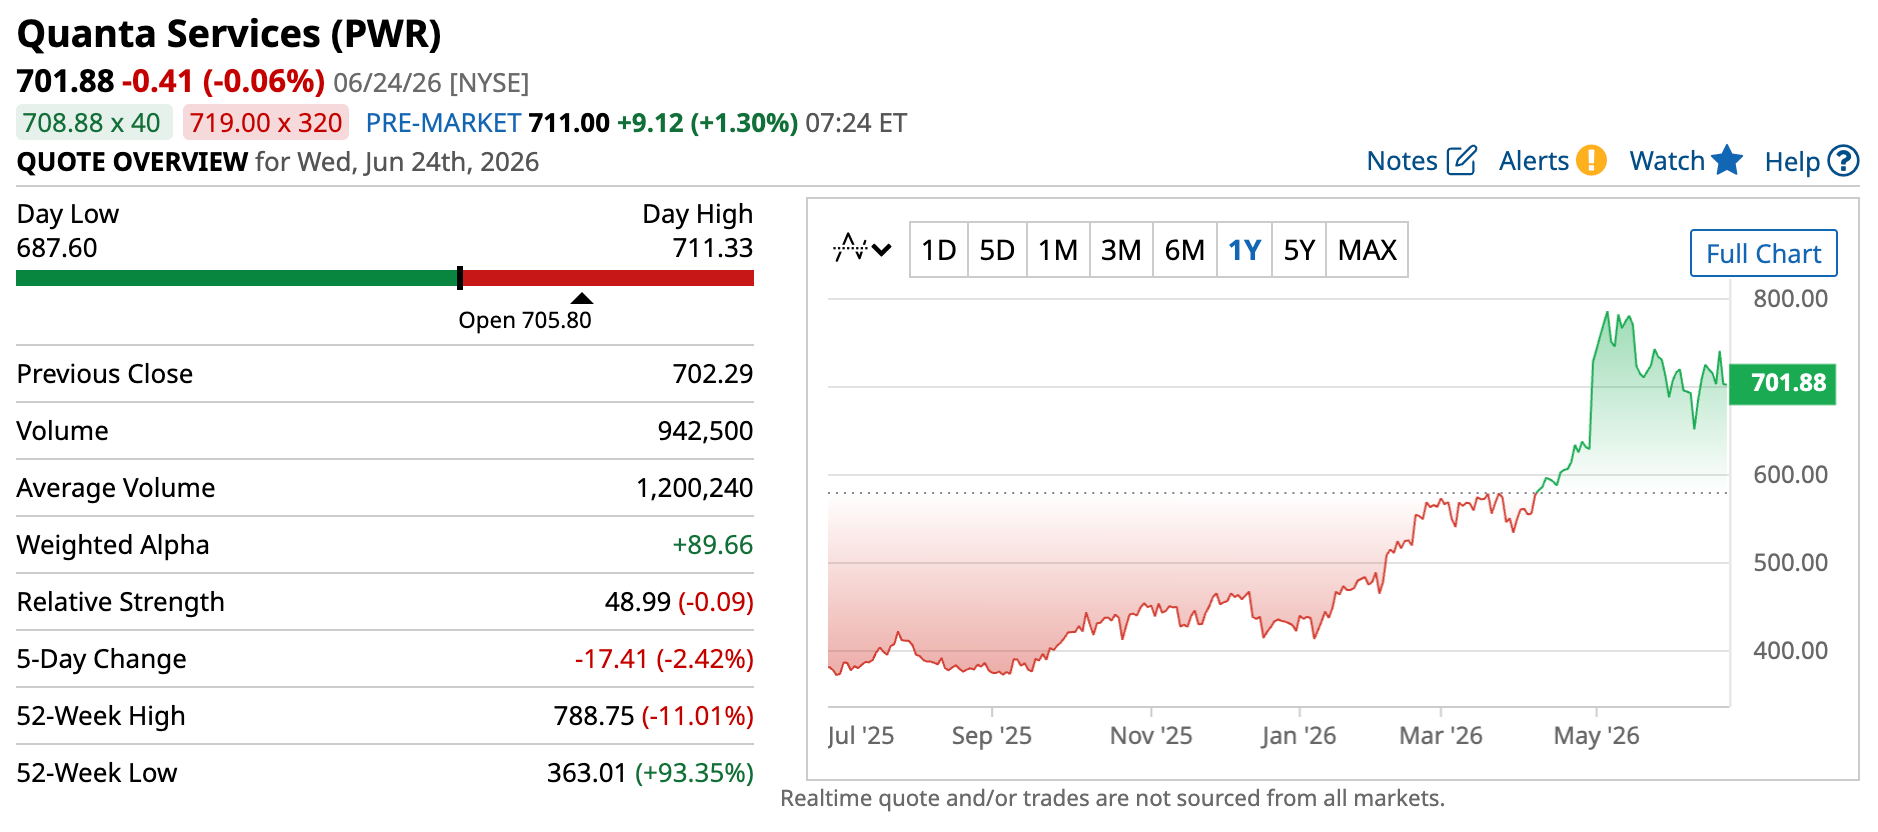
Quanta operates in the physical layer that makes large-scale AI deployment possible in the first place. That includes transmission buildouts, high-voltage substations, and the electrical infrastructure required to connect new data center campuses to increasingly constrained regional grids. It is one of the largest engineering and construction services contractors in North America’s power transmission sector.
Think of it this way: energy producers operate the heart, while companies like Quanta make and maintain the blood vessels.
Every new data center, manufacturing facility, or large industrial project still needs to be physically connected to the grid, and they usually opt for the biggest and most capable players. That leaves Quanta well-positioned to capture that demand.
In many cases, the constraint isn’t the generation capacity itself, but the ability to interconnect new load to an already congested transmission system. And that’s where the opportunity is: to take part in data center demand.
Quanta’s management has already highlighted that AI-driven power demand is now a major growth driver for the company. But because of its broader distribution business, demand across other large-load industries also serves as a catalyst.
Now, to be clear, power distribution won’t enter into PPAs. But there is a clear line between increased PPAs from the producers and increased demand for distribution. In fact, if you’ll notice, all four companies I’ve covered so far practically have the same graph over the last five years. Sure, there are small differences in magnitude, but the broader trend is unmistakable: these companies are beneficiaries of the same secular tailwind, practically all at the same time. And it makes sense when you think about it. More AI workloads require more data centers.
More data centers require more electricity, which leads to more power generation, more fuel consumption, and massive investments in transmission and grid infrastructure.
Bottom line: As long as hyperscalers continue their aggressive spending on AI infrastructure, every link in the power production chain stands to benefit.
Electrical equipment stocks: Eaton, Schneider, and GE Vernova
Now, if you thought we were on the ground level, we’re not – at least, not yet. One level deeper are those companies that support both power generation and grid infrastructure. These are the players that actively build, connect, and scale the physical backbone that enables both.
In the broader structure of the AI power stack, this layer sits between high-level grid construction and end-use electricity consumption. It serves as the industrial foundation that determines whether capacity can actually be deployed at speed. In practice, this is where the constraint becomes physical rather than theoretical. Because even if generation capacity is available and even if demand is fully contracted through long-term agreements, none of it translates into usable supply unless the underlying infrastructure can be built fast enough.
Now we can look to the companies that supply those parts of power production and infrastructure. One good example is Eaton Corp (ETN).
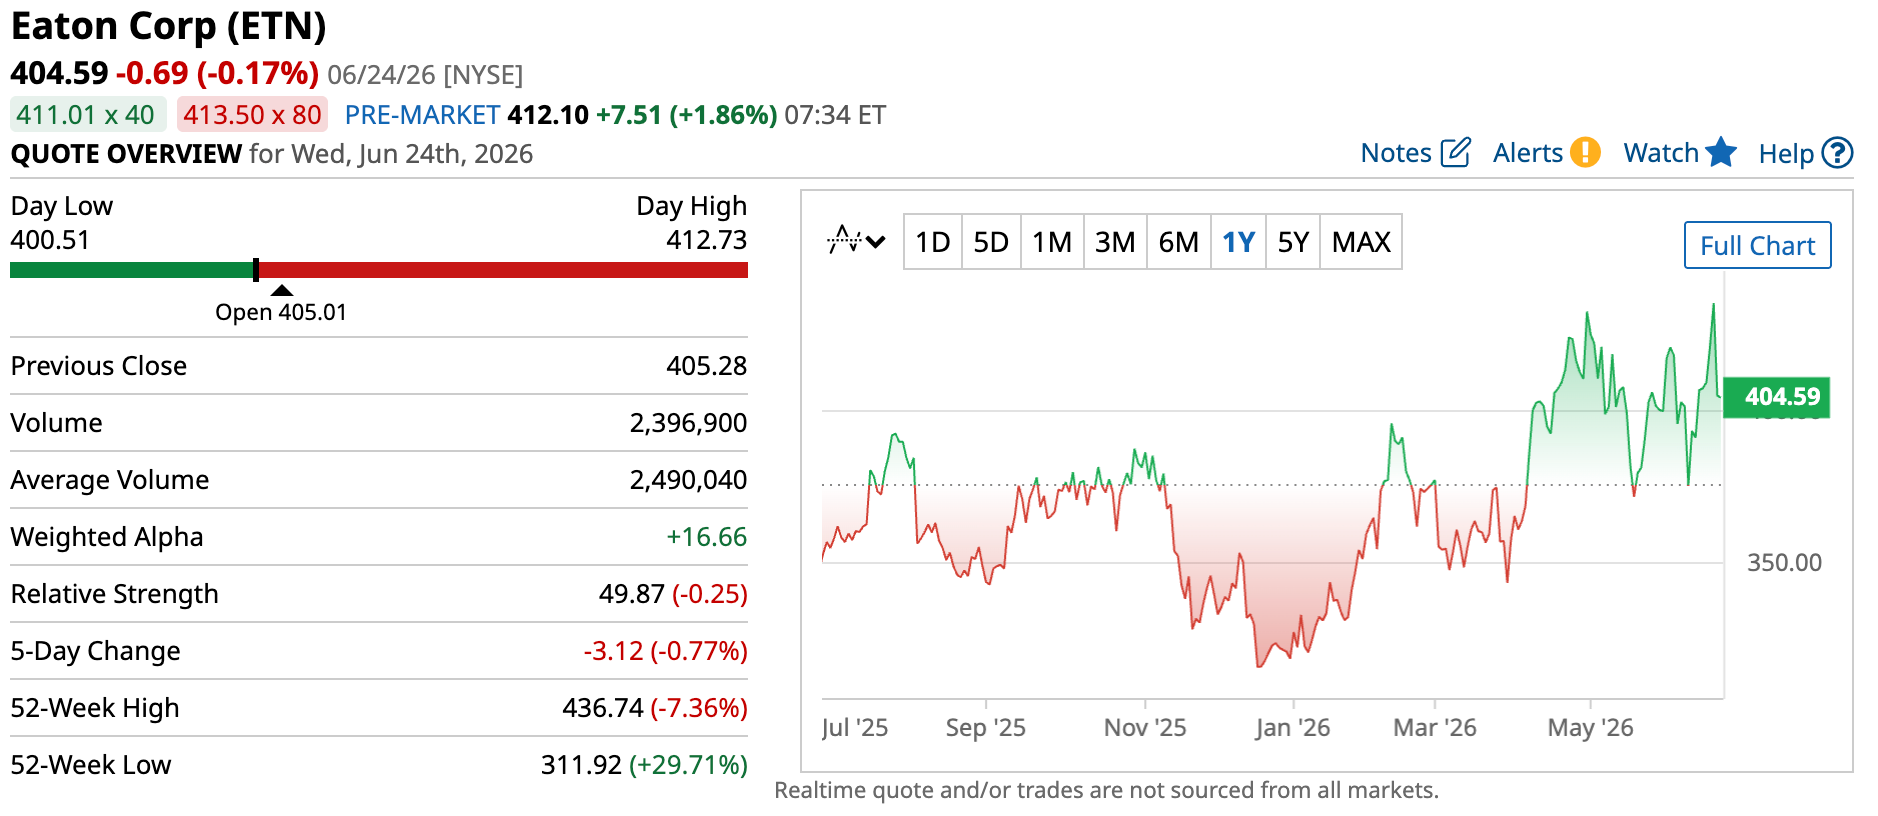
The company manufactures electrical hardware such as switchgear, breakers, transformers, uninterruptible power supply systems, and more. These pieces of equipment are critical components to running not just data centers but also your typical modern industrial enterprise as well.
What makes Eaton particularly relevant today is that these components are not optional upgrades. Electrical systems need these parts. So, we can say increased demand directly translates into increased sales, as a quick snapshot of Eaton’s annual financials will attest.
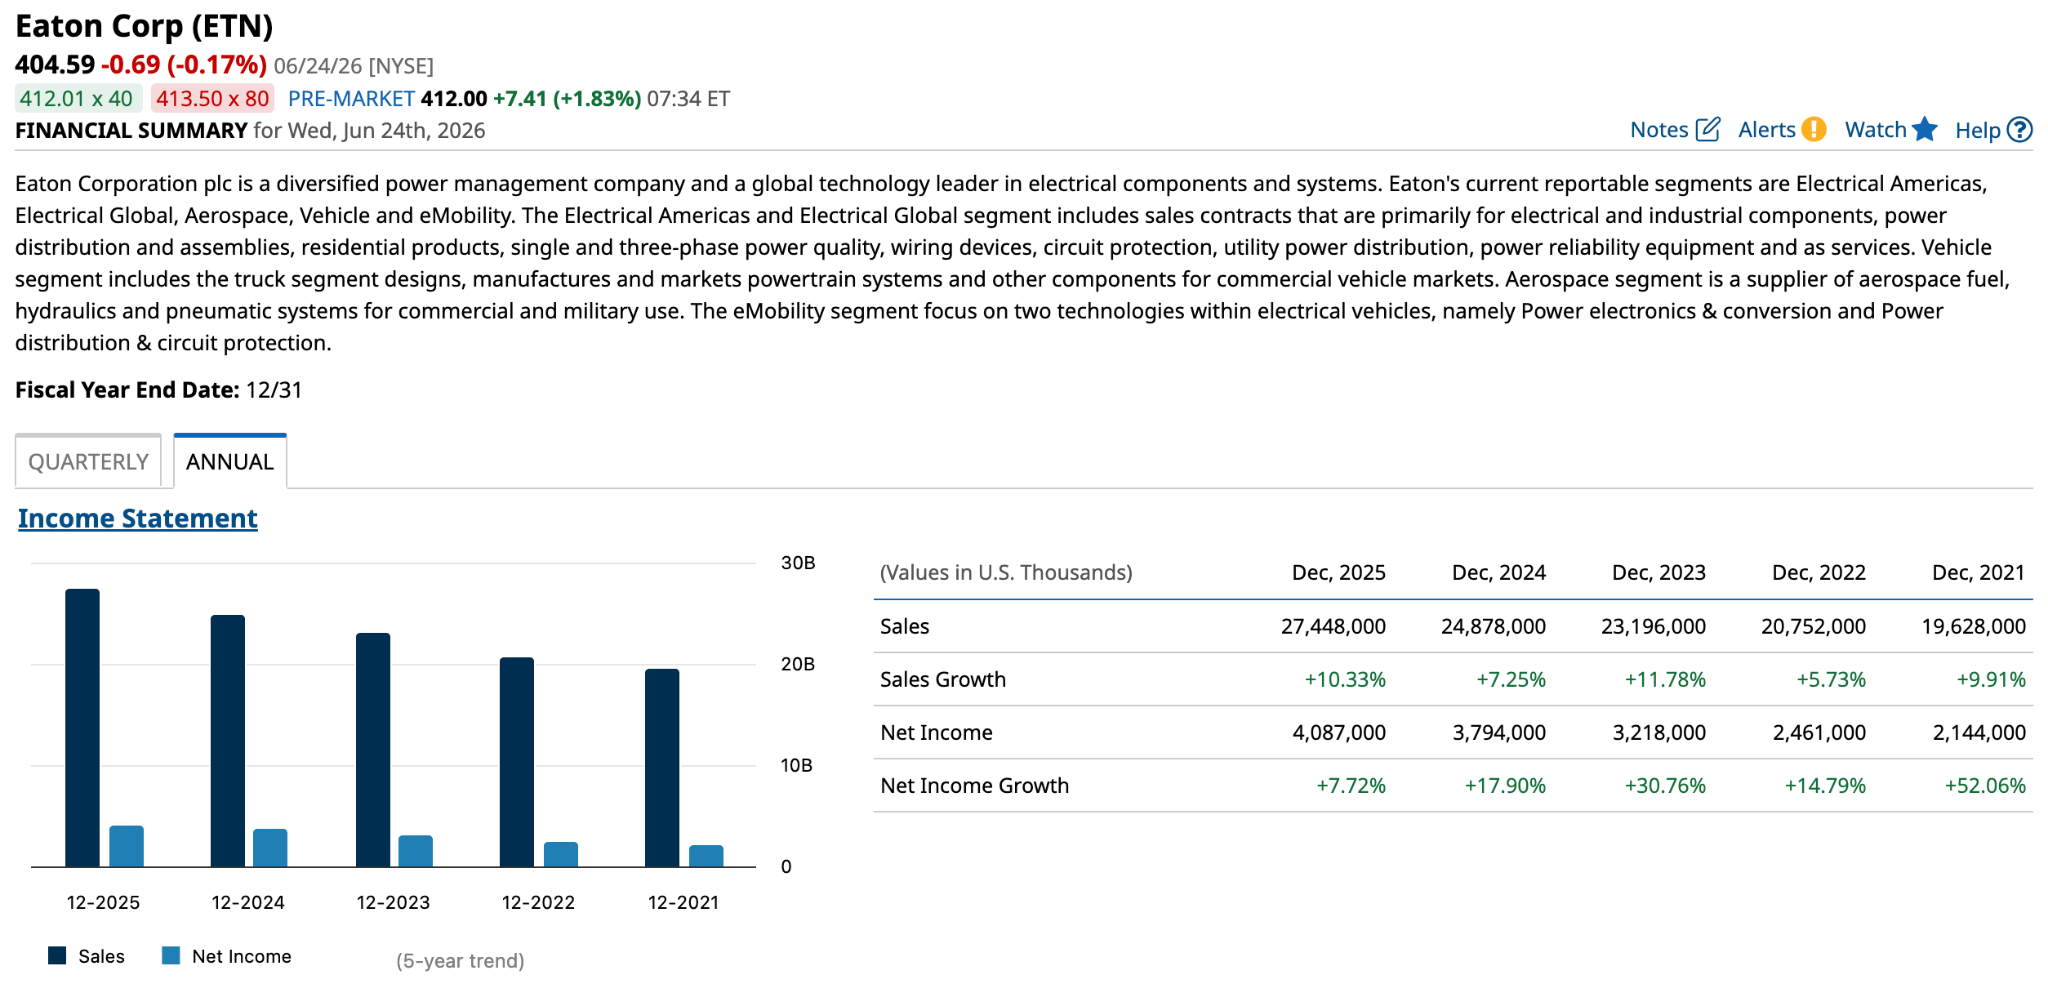
In effect, Eaton sits in the electrical component layer of the stack, supplying the core hardware that allows both industrial facilities and hyperscale data centers to safely distribute and regulate power at scale.
Another, albeit different, example here is Schneider Electric (SBGSF).
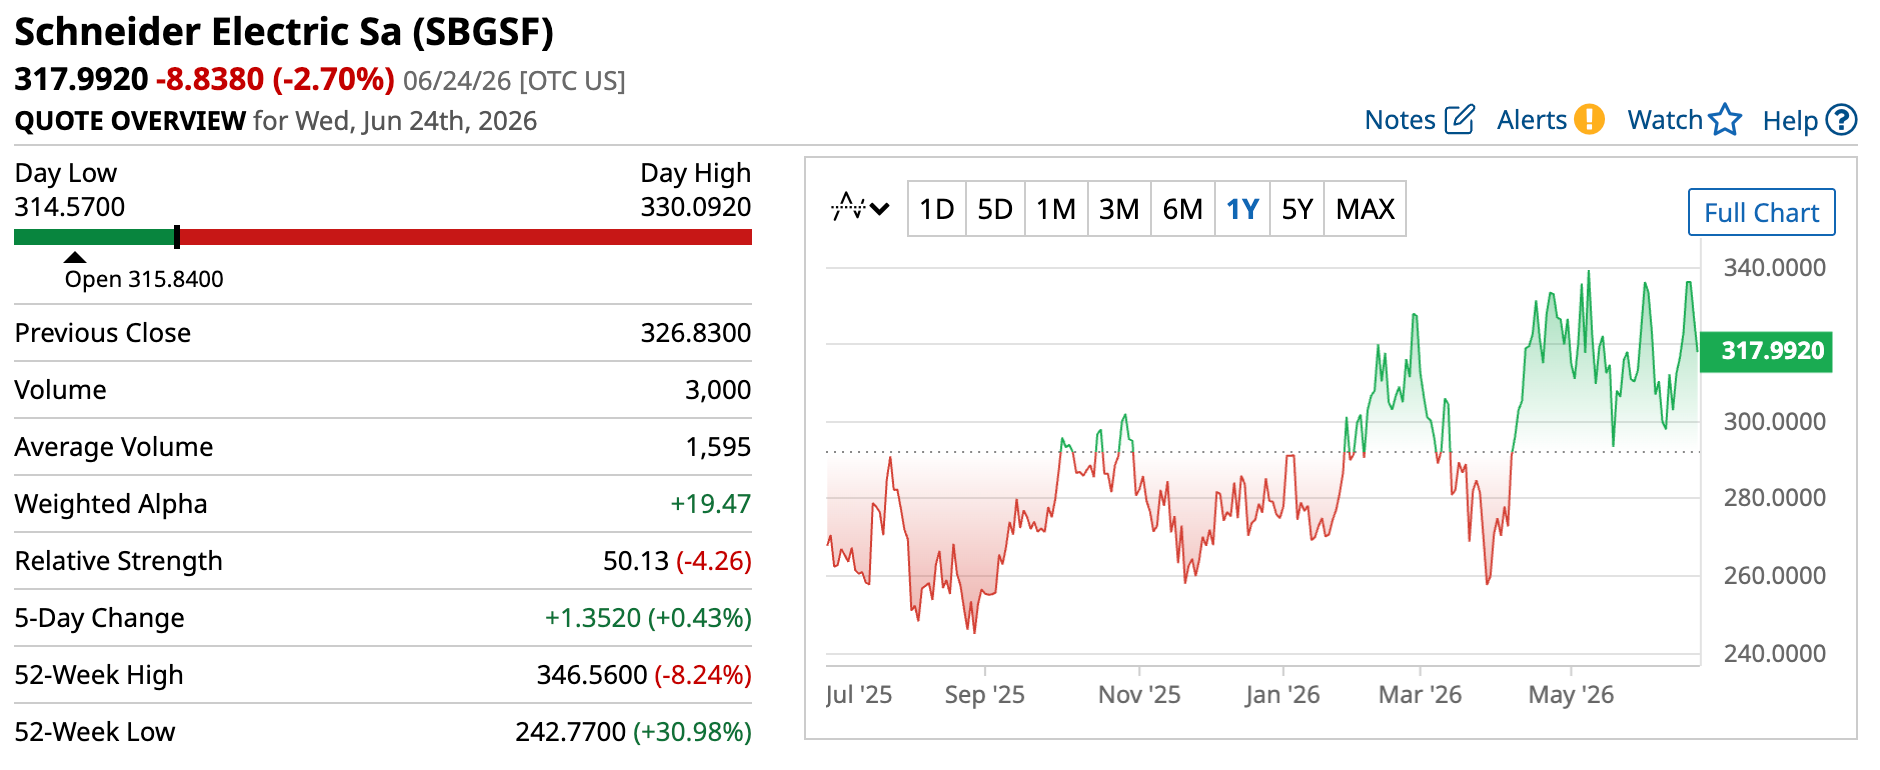
Unlike component manufacturers, Schneider designs and deploys integrated energy management systems that get deployed in data centers, industrial facilities, and utility networks. The entire value chain.
In practical terms, more and more, Schneider is responsible for how entire facilities manage power flow end to end. Power efficiency matters more in data centers that consume enough electricity to power small cities, where every kilowatt counts and even small, persistent energy losses can translate into massive financial costs.
This positions Schneider closer to the systems and control layer of the grid, where software, monitoring, and integrated electrical architecture determine how efficiently large-scale infrastructure operates once built.
Finally, there’s GE Vernova (GEV), representing a different but equally critical layer: power-generation equipment itself.
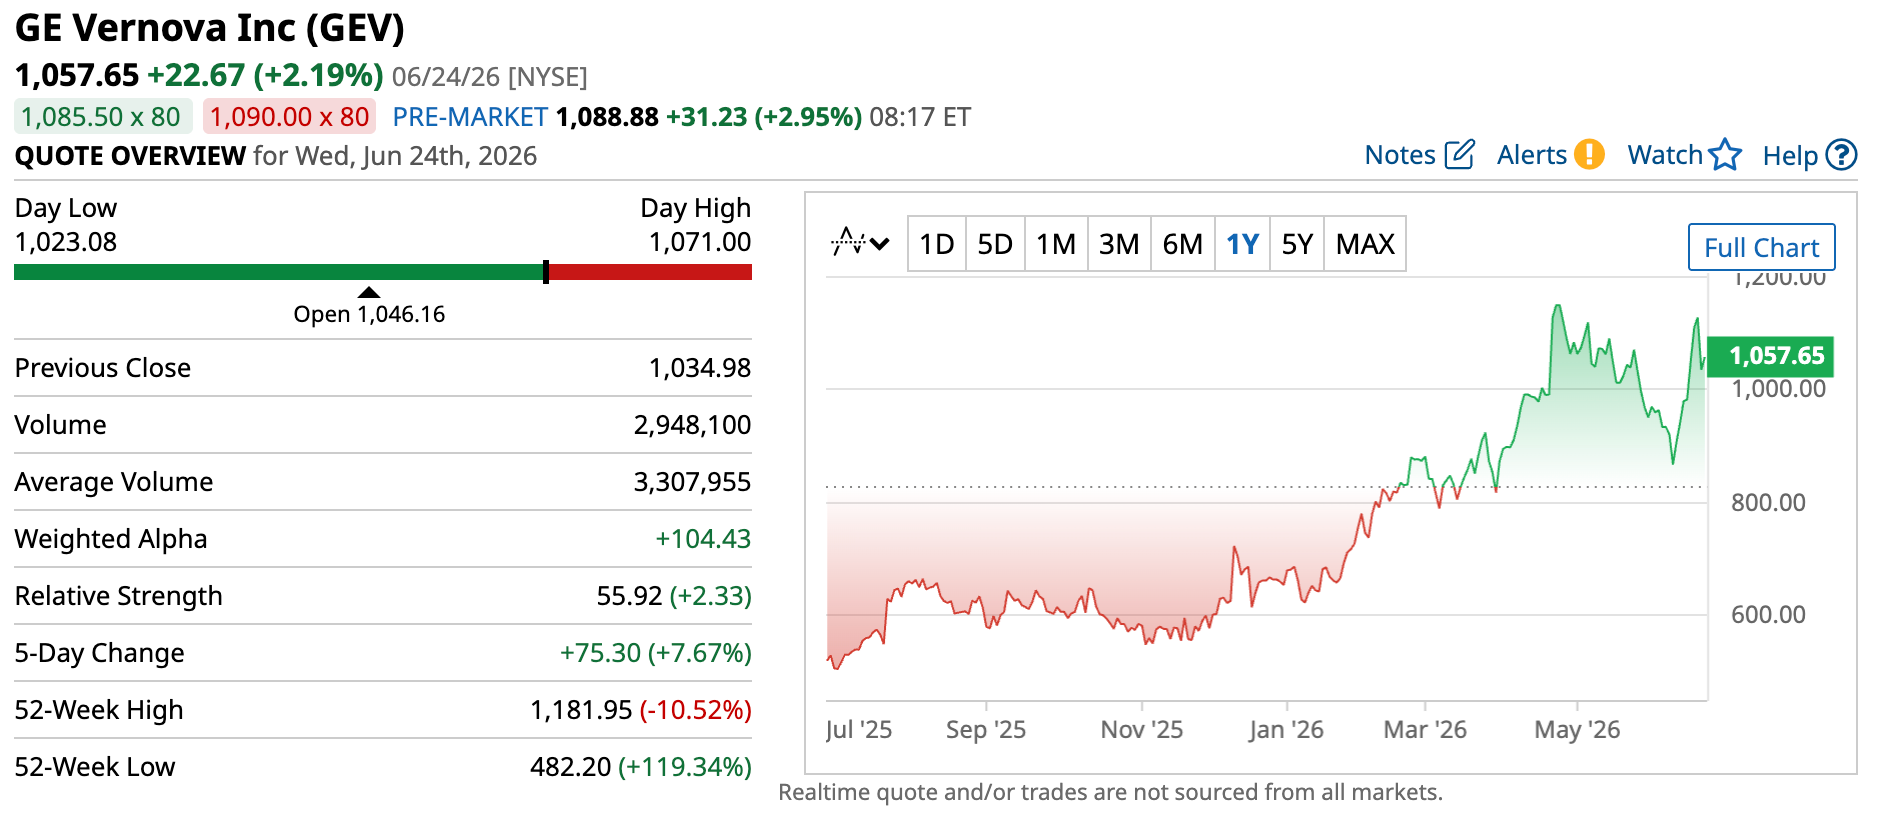
GE Vernova makes gas turbines, renewable energy systems, and grid-scale electrification infrastructure. While companies like Constellation and Talen generate electricity, GE Vernova often supplies the equipment that makes it possible.
Increasing AI demand results in more power demand, and if the producers don’t have the existing facilities to cover that demand – well, then, they’re going to need to expand. That means GE Vernova directly benefits from increased AI power requirements. Here are a few examples.
Last year, GE Vernova partnered with Crusoe, a vertically integrated AI infrastructure provider, to deliver 29 new gas turbines to its data centers. This combined deployment is expected to support up to 1 gigawatt of electricity production. They also partnered with Amazon Web Services, Inc. to offer a broad range of energy solutions covering electrification systems, renewables, and power generation services all to support global data center expansion.
And I wouldn’t want to suggest that the client base is limited to hyperscalers. GE Vernova is one of the most dominant and important energy infrastructure players in the world, so naturally, the deals go beyond AI. Companies like Duke Energy (DUK) and Chevron (CVX) all have existing deals with GE Vernova. The company is also a key player in national energy expansion initiatives, such as the one in Saudi Arabia, which is estimated to reach up to $14.2 billion over its lifetime.
The risks of investing in AI power stocks
Overall, the AI data center build-out is extremely beneficial to all links of the energy value chain. But there are risks that investors need to grapple with. Some of them aren’t even theoretical; they’re here, and they’re looming. The only thing we don’t know is when exactly they will make landfall.
The first risk is the cycle
The first and arguably the most critical risk is cyclicality. Right now, the world’s largest companies are shelling out billions to each support their own AI initiatives. Microsoft, Amazon, Alphabet, and Meta have already committed to increasing their capex explicitly to expand their data centers and other AI infrastructure. They want better LLMs, features, functionality, and narratives for their shareholder presentations.
The race, as they say, is on. But how long will the run last? Because let’s face it: even though it seems like hyperscalers have bottomless wells of money, they will eventually hit bedrock with increasing and sustained AI expenditure. One of these days, they will have to slow down spending. And once they do, power will be one of the cut-off points.
That means less demand for equipment, power generation, infrastructure, system solutions, and all the rest.
By the way, this isn’t me reading tea leaves for the AI power industry. There’s a historical precedent here. Capital-intensive industries have always been cyclical. Cycles may expand for years or even decades, but a downturn is always inevitable. We saw it with telecom, oil and gas, the first nuclear buildout cycle, and other emerging sectors during their times.
Too hot, too cold, never just right
Investors also need to keep an eye on signs of under- and overbuilding. The power sector is notoriously sensitive to such risks, due to the long lead times for buildouts across, well, every link in the value chain.
Turbines, transformers, and nuclear power plants don’t magically appear whenever a hyperscaler wants them to. They could take years to manufacture – even longer if the infrastructure to build them isn’t in place yet – which leads to a nice little two-sided risk for both the manufacturer and the client.
Too much demand and too little infrastructure? Those are underbuilds. The logical fix for that is to expand.
But what if demand fizzles out?
That same expanded infrastructure that was so critical to meet demand a few years before is now sitting idle, collecting dust.
In short, overbuilds.
Two sides of the same coin.
The last risk is concentration
And finally, one of the biggest risks of AI power is in the name itself.
Artificial intelligence.
One sector. One market. One group of customers pay all the bills.
That’s the reality today behind the AI boom. I know it might sound like I’m scratching my nails against a chalkboard by repeating the same few names, but be that it as it may, Microsoft, Amazon, Google, and Meta are among the biggest and most aggressive spenders right now. Every decision they make trickles down the AI value chain, including power.
So, if even one of those tech giants decides to slow down, delay projects, or build their own power solutions, the effects could ripple across the sector. Suddenly, utilities find themselves needing less incremental generation capacity. Fewer data centers would need to be connected to the grid. Equipment orders could slow. Infrastructure projects could be deferred.
The bottom line for AI power stocks
What this ultimately comes down to is a shift in where the constraints sit in the AI ecosystem. The early phase was defined by compute scarcity, and that’s when semiconductors took center stage. Then memory became the hot commodity, and RAM manufacturers got their moment in the sun.
But as the buildouts scale, the constraints keep moving downstream, into the physical infrastructure that supports all that compute. Power generation. Transmission. The equipment that makes it all run.
So the next shift in the industry’s center of gravity? It’s heading straight to power. And that’s what makes this so compelling: the companies at these bottlenecks aren’t betting on which chatbot wins or whose model tops the leaderboard. They get paid no matter which name comes out on top, because every one of them needs electricity to compete.
But here’s the part that should excite long-term investors most. Even when the AI spending cycle eventually cools – and it will – the world doesn’t suddenly need less power. Electrification, reshoring, grid modernization, and rising global demand were already pushing this sector higher long before the first hyperscaler signed a PPA. AI didn’t create the power supercycle. It simply poured gasoline on the fire (so to speak).
That’s the rare setup: a theme with a massive near-term catalyst and a durable, decades-long tailwind underneath it. The bottleneck is real, the demand is here, and the companies that deliver the electricity, systems, and infrastructure to run the AI era are positioned to benefit for years to come.
Just remember that market positions and moats can shift, so stay on top of your picks. But if the center of gravity really is moving to power, the opportunity in front of investors right now is hard to ignore.
Intraday USD correction, but UBS sees the greenback regaining a new trend — what’s next for EUR/USD?
hursday’s and Friday’s trading sessions saw a sharp rebound in the EUR/USD pair, which is now attempting to consolidate above 1.14 after a series of strong bullish daily candles in recent weeks pushed the dollar to levels not seen since May 2025. Meanwhile, UBS analysts take the opposite view—arguing that the current weakness of the USD is a temporary phenomenon, not a structural one.
UBS vs. the Market — A Discrepancy in Narratives
UBS lowered its forecast for the EUR/USD exchange rate at the end of 2026 to 1.12 from the previous 1.14 , signaling that the bank expects the current trend to reverse. This view is based on a reassessment of U.S. interest rate expectations—the market is beginning to price in the possibility that the Fed may maintain a restrictive monetary policy for longer than previously anticipated. UBS notes that the DXY index has the potential to test the 102 level, which was last seen in May 2025. Although long positions in the dollar have increased, the bank assesses that they are far from the extreme levels seen in 2024—which means there is still room for further USD buying.
Fed vs. ECB — The Divergence Persists
The key driver for the EUR/USD pair remains the divergence in monetary policy on both sides of the Atlantic.
The Fed —despite some market expectations of rate cuts—maintains a hawkish stance, emphasizing the resilience of the U.S. economy and labor market.
The ECB , in turn, is continuing its easing cycle, and further rate cuts are almost fully priced in by the market for the second half of the year. This asymmetry naturally favors the dollar over the euro in the medium term. Today’s rebound in EUR/USD can therefore be interpreted as a technical correction following an extremely rapid move, rather than a change in the pair’s fundamental outlook.
Technical Context and Carry Trade
It is worth noting that, in the same analysis, UBS points to the Swiss franc as a currency that may weaken in the short term due to its growing role as a carry trade funding currency—which indirectly supports risk appetite and may temporarily curb the dollar’s strength. The Australian dollar’s target was lowered to 0.68 from 0.74 , reflecting the global context: weaker macroeconomic data outside the U.S. and narrowing interest rate differentials are boosting the greenback against commodity and emerging-market currencies.
Technical Analysis: EURUSD D1
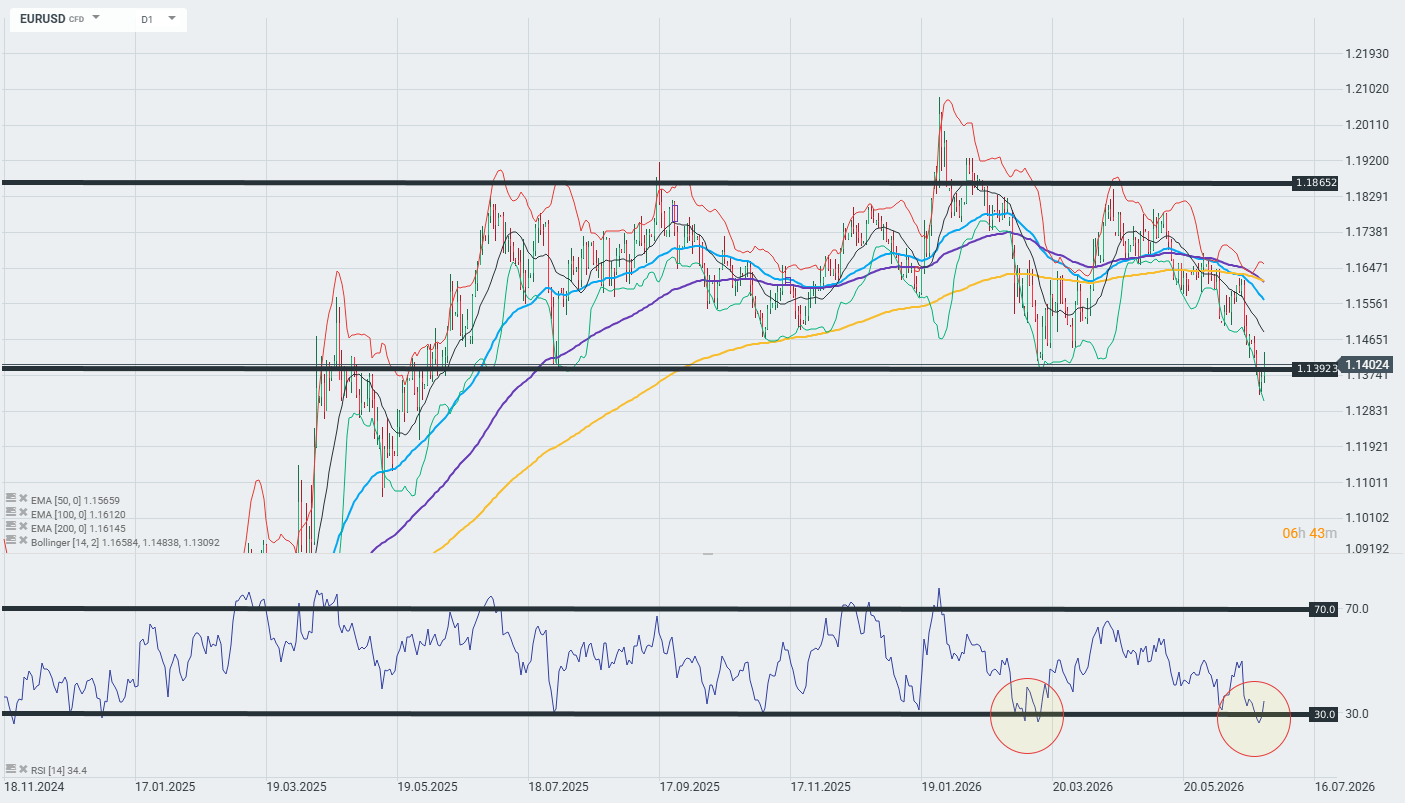
The pair is currently testing a key level at 1.1392—a break below or above this level could determine the pair’s trajectory for the coming sessions. On the upside, resistance comes from the 50/100/200 EMAs clustered around 1.1560–1.1615. The RSI, at 34.4, is approaching the oversold zone (30)—similar to February 2026—which could trigger a short-term technical rebound. Nevertheless, as long as the pair does not close the day clearly above 1.1392, technical analysis favors a continuation of the downtrend. It is worth noting, however, that the pair has been highly volatile in recent days, so price movements may remain chaotic in the near term.
