The US Dollar Index (DXY) fell to a two-week low near the 98.00 price zone on Friday, extending the losses seen the previous day and ending a week in which the world’s most important central banks confirmed a hawkish shift due to rising inflation pressures. Next week, traders’ attention will remain focused on any development regarding potential negotiations between the US and Iran, as well as a streak of US employment data that will culminate with Nonfarm Payrolls.
The economic calendar was light on Friday as many markets around the world were closed due to the Labor Day holiday. Still, in the US, the ISM Manufacturing Purchasing Managers Index (PMI) came in at 52.7, below the expected 53.
In the Middle East, the Islamic Republic of Iran submitted its latest negotiating proposal to Pakistan, acting as the mediator in talks with the United States. It was not immediately clear what was included in the new proposal, but Trump said that he can’t agree to the current demands from Tehran: “Iran wants to make a deal, but I’m not satisfied,” he said.
Earlier in the day, Iran’s Foreign Minister, Abbas Araghchi, discussed the latest initiatives of the Islamic Republic to end the war during phone calls with counterparts from Saudi Arabia, Qatar, Turkey, Iraq, and Azerbaijan, according to a ministry statement.
US Dollar Price Today
The table below shows the percentage change of US Dollar (USD) against listed major currencies today. US Dollar was the strongest against the Japanese Yen.
| USD | EUR | GBP | JPY | CAD | AUD | NZD | CHF | |
|---|---|---|---|---|---|---|---|---|
| USD | -0.20% | -0.12% | 0.09% | -0.03% | -0.25% | -0.15% | -0.27% | |
| EUR | 0.20% | 0.07% | 0.28% | 0.15% | -0.04% | 0.03% | -0.07% | |
| GBP | 0.12% | -0.07% | 0.21% | 0.09% | -0.12% | -0.04% | -0.12% | |
| JPY | -0.09% | -0.28% | -0.21% | -0.12% | -0.34% | -0.28% | -0.36% | |
| CAD | 0.03% | -0.15% | -0.09% | 0.12% | -0.23% | -0.14% | -0.22% | |
| AUD | 0.25% | 0.04% | 0.12% | 0.34% | 0.23% | 0.08% | 0.00% | |
| NZD | 0.15% | -0.03% | 0.04% | 0.28% | 0.14% | -0.08% | -0.09% | |
| CHF | 0.27% | 0.07% | 0.12% | 0.36% | 0.22% | 0.00% | 0.09% |
The heat map shows percentage changes of major currencies against each other. The base currency is picked from the left column, while the quote currency is picked from the top row. For example, if you pick the US Dollar from the left column and move along the horizontal line to the Japanese Yen, the percentage change displayed in the box will represent USD (base)/JPY (quote).
EUR/USD rose to an almost two-week high near the 1.1780 level. The pair keeps the rally going for a second straight day after the European Central Bank (ECB) left rates unchanged in Thursday’s meeting. US President Donald Trump announced on Friday that tariffs on the European Union’s cars and trucks would rise to 25% from the current 15%, reviving trade war fears.
GBP/USD rose to the 1.3630 price region. The rise comes as investors move away from the US Dollar (USD) amid an improved risk mood after Iran offered to reach out to the US through Pakistan, aiming to finalize the peace deal once and for all.
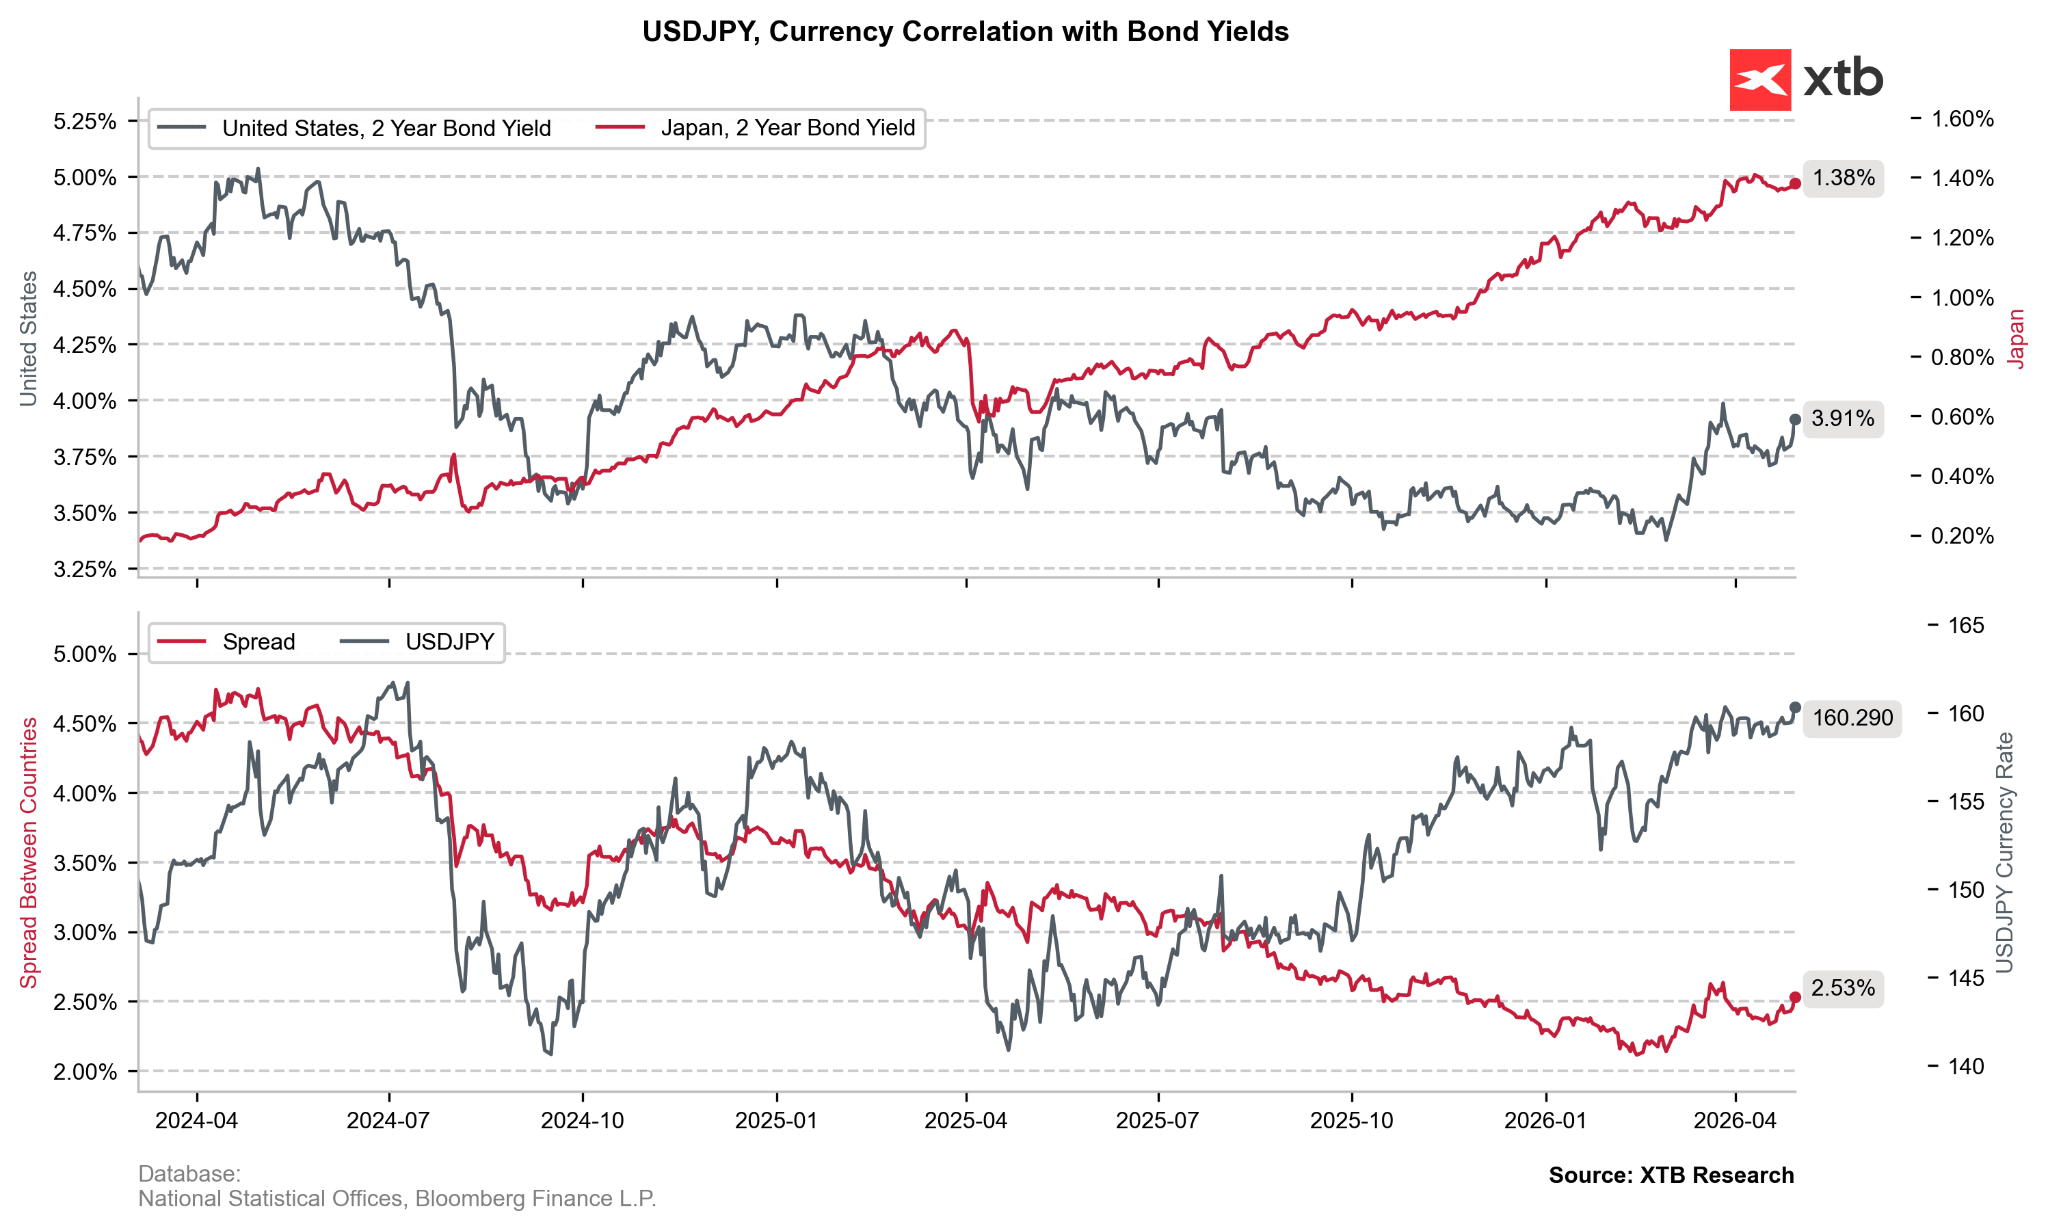
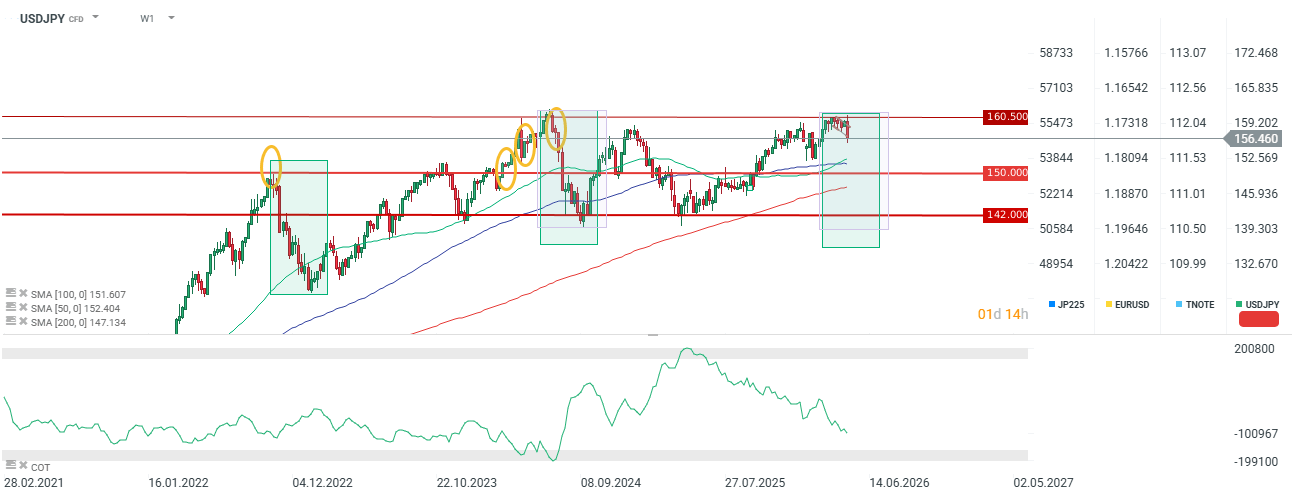
USD/JPY steadied after dropping from 160.00 to 156.60 following the Japanese government’s intervention on Thursday. Data released on Friday showed the Tokyo Consumer Price Index (CPI) for April ex Fresh Food at 1.9%, down from last month’s 2.3%. The headline measure was released at 1.5%, up slightly from last month’s 1.4%.
AUD/USD ticked up towards the 0.7220 price zone as traders adopt a wait-and-see approach ahead of the Reserve Bank of Australia (RBA) monetary policy decision scheduled for next Tuesday. Earlier in the day, the Producer Price Index (PPI) was at 3%, below last month’s 3.5%.
Gold trades broadly unchanged at the $4,630 level as investors focus on riskier positions over the week’s end.
WTI West Texas Intermediate (WTI) fell near the $98.50 per barrel amid Iran’s Pakistan-driven US peace deal.
Anticipating economic perspectives: Voices on the horizon
Monday, May 4:
- Eurogroup Meeting
- ECB Cipollone speaks
- Fed Williams speaks
- ECB Nagel speaks
Tuesday, May 5:
- RBA Press Conference
- ECB De Guindos speaks
- ECB President Lagarde speaks
- Fed Bowman speaks
- ECB Lane speaks
- Fed Barr speaks
Wednesday, May 6:
- ECB Lane speaks
- ECB Cipollone speaks
- Fed Musalem speaks
- Fed Goolsbee speaks
- Fed Hammack speaks
Thursday, May 7:
- ECB De Guindos speaks
- ECB Elderson speaks
- ECB Lane speaks
- ECB Schnabel speaks
- Fed Hammack speaks
- Fed Williams speaks
Friday, May 8:
- ECB President Lagarde speaks
- ECB De Guindos speaks
- Fed Cook speaks
- ECB Cipollone speaks
- ECB Schnabel speaks
- ECB Nagel speaks
- Fed Bowman speaks
- Fed Goolsbee speaks
- Fed Waller speaks
Central banks’ meetings and upcoming data releases to shape markets
Monday, May 4:
- Australian TD-MI Inflation Gauge April YoY
- Australian Building Permits March MoM
- Germany, France, Italy, Eurozone HCOB Manufacturing PMI April
- Eurozone Sentix Investor Confidence May
- US Factory Orders March MoM
- Australian S&P PMIs April
Tuesday, May 5:
- Australian RBA Interest Rate Decision
- Australian RBA Monetary Policy Statement
- Australian RBA Rate Statement
- Chinese Consumer Price Index April MoM YoY
- US S&P PMIS April
- US ISM Services PMIS
- US JOLTS Job Openings March
- US New Home Sales February and March MoM
- New Zealand Employment data
Wednesday, May 6:
- Chinese Caixin Services PMI April
- Germany, France, Italy, Eurozone HCOB Services PMI April
- Eurozone Producer Price Index March MoM YoY
- US ADP Employment Change April
- Canadian Ivey PMI April
- Japanese Labor Cash Earnings March YoY
- Japanese BoJ Monetary Policy Meeting Minutes
Thursday, May 7:
- Australian Trade Balance
- Germany Factory Orders March MoM YoY
- Eurozone Retail Sales March MoM YoY
- US Challenger Job Cuts April
- US Initial Jobless Claims
- US Nonfarm Productivity Q1 Prel
- US Unit Labor Costs Q1 Prel
Friday, May 8:
- Germany Industrial Production March MoM YoY
- Eurozone Trade Balance March
- Canadian Employment data
- US NFP report