Currency Hedger No Comments

Commodity Talk – Oil, Natgas, Gold and Cocoa

Oil:

  • Brent crude oil exceeds $110 on the June contract amid further escalation of the situation in the Middle East.
  • Despite the emergence of prospects for a ceasefire, Iran has rejected all terms from the United States.
  • Iran indicated it wants permanent peace and the withdrawal of American troops. A ceasefire could be preparation for a stronger strike.
  • The next 48-hour deadline announced by Trump expires at 12:00 GMT from Tuesday to Wednesday, although Iran has repeatedly indicated it does not intend to comply.
  • The Wall Street Journal indicates that the United States is preparing to strike energy and transport infrastructure in Iran.
  • During the holiday weekend, the highest number of ships since the beginning of the conflict passed through the Strait of Hormuz, which is related to agreements between Iran and several Asian countries.
  • Ships from countries such as India, Pakistan, the Philippines, Malaysia, and China have recently passed through the Strait of Hormuz. It is unknown whether the agreements on the passage of ships concerned the flag or specific units.
  • Pakistan was said to have reached an agreement for the passage of 20 units; theoretically, all Indian units can cross the strait. Iran indicates that all ships from Iraq can also freely pass through the strait. However, there are no details of such agreements, and additionally, vessel insurance remains a key aspect.
  • OPEC+ agreed during a weekend meeting that it will increase production by another 206,000 barrels per day in May at the moment the Strait of Hormuz opens.
  • It is worth emphasizing that Russia also has major problems with increasing production and exports, which is related to Ukraine’s attacks on Russian oil infrastructure.
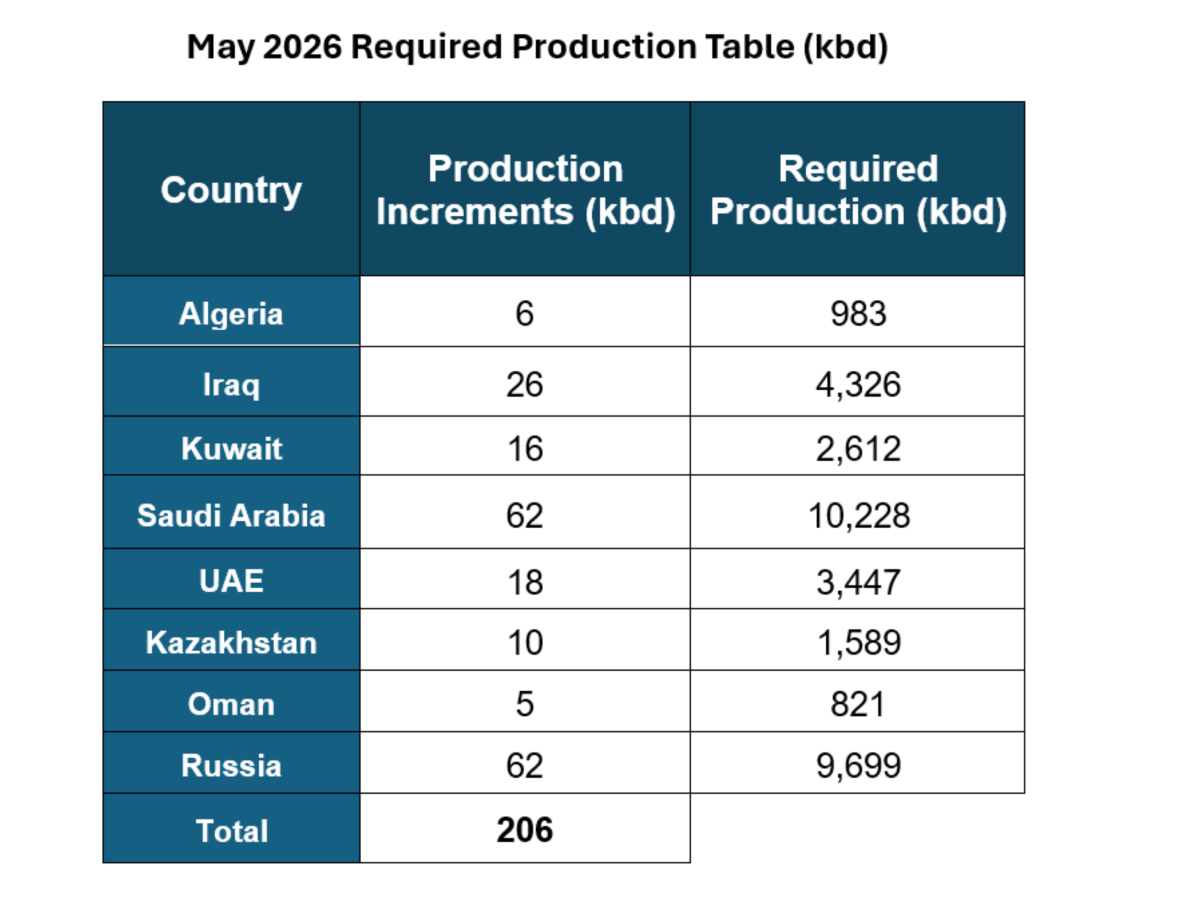
New production quotas for countries in the agreement on voluntary production cuts. It is worth noting that countries like Iraq, Kuwait, Saudi Arabia, the UAE, and also Russia have significantly reduced their production volumes recently. Source: OPEC
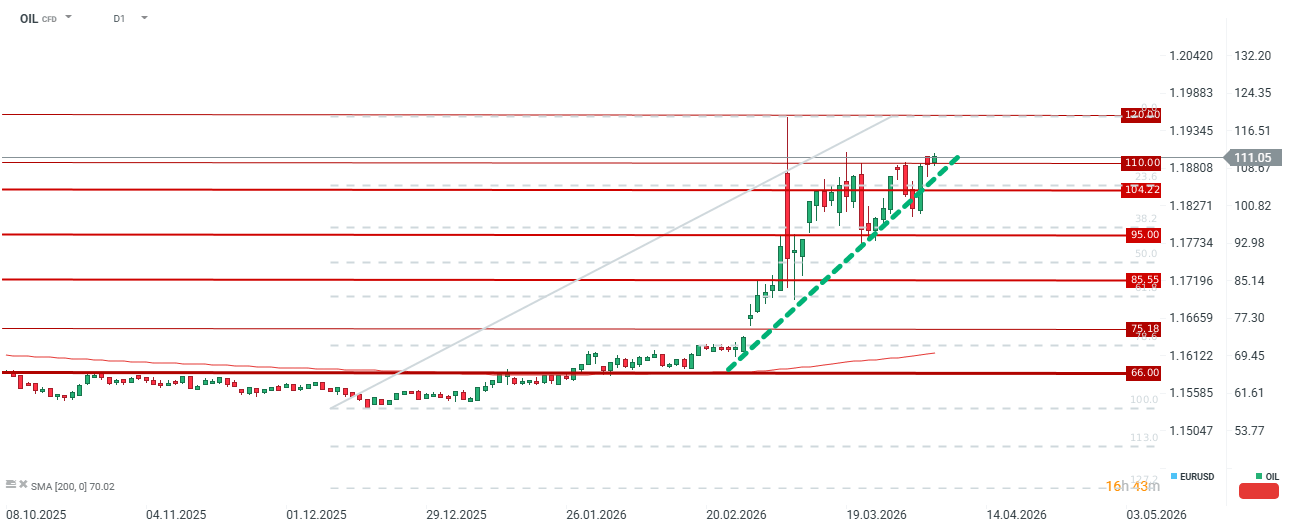
โ€‹โ€‹โ€‹โ€‹โ€‹โ€‹โ€‹Oil is currently in a zone of strong supply and is no longer reacting as dynamically as it was a few days ago. The Strait of Hormuz remains closed, but some ships are passing through, so prices may be under slight pressure. Nevertheless, a few ships will not lead to a significant improvement in the global supply situation. Source: xStation5

Gas:

  • Gas prices fell toward $2.8/MMBTU due to the end of the heating season in the USA, although on Monday we observed an attempted recovery due to forecasts indicating lower temperatures.
  • Gas production on Monday was 110.4 bcfd, which was an almost 3% increase compared to last year. In turn, domestic demand was almost 73 bcfd, which was a level nearly 7% lower than a year ago.
  • LNG exports amounted to 20.4 bcfd, which was a level almost 2% higher than in the previous week. It is worth emphasizing that despite global tension in the LNG gas market due to the blockade of the Strait of Hormuz, the United States cannot significantly increase export capacities beyond current levels due to the use of full export capacities.
  • It is expected that by 2030, export capacities in North America will increase to approx. 30 bcfd.
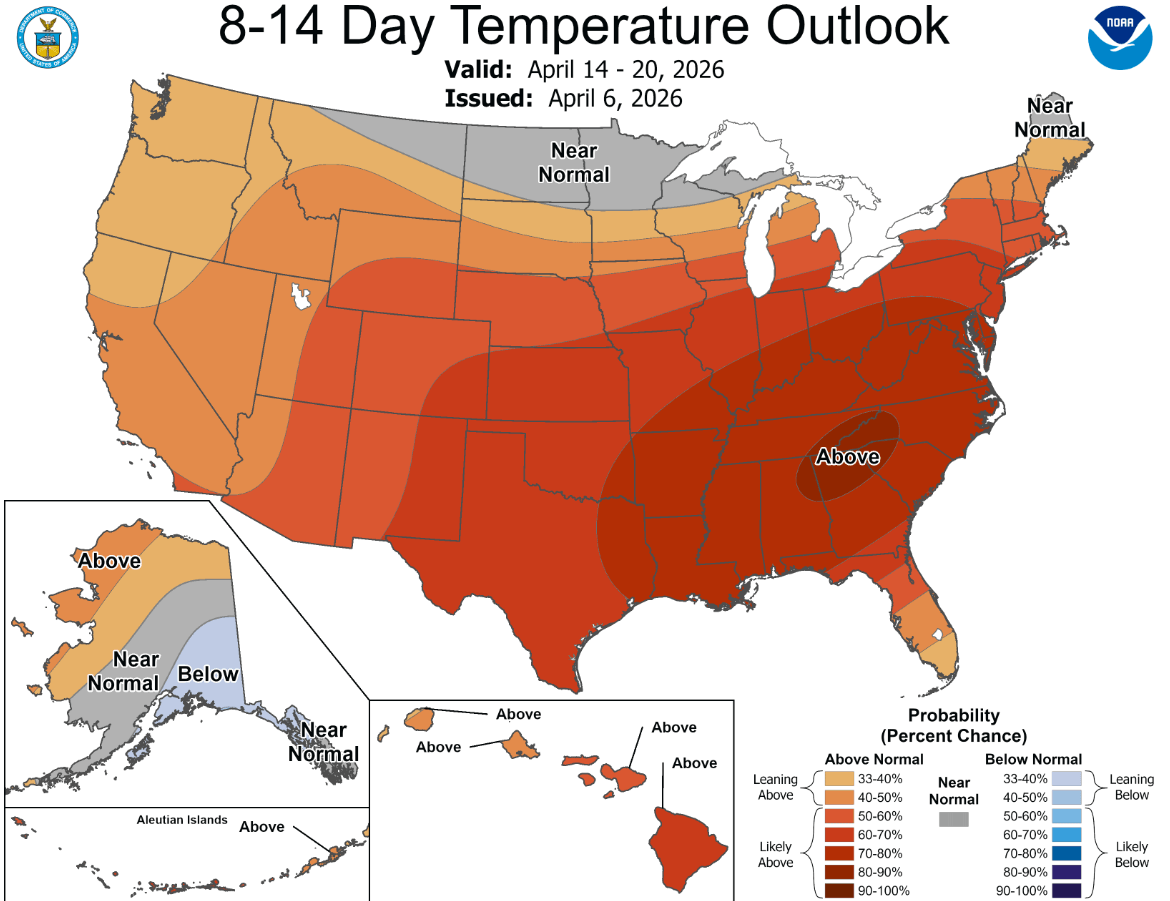
โ€‹โ€‹โ€‹โ€‹โ€‹โ€‹โ€‹Forecasts for the next 2 weeks indicate that temperatures will be higher than standard. This means that gas consumption for heating purposes should be minimal. Nevertheless, seasonal forecasts suggest that in the summer period, temperatures should also be higher, which means higher consumption in the future. Source: NOAA
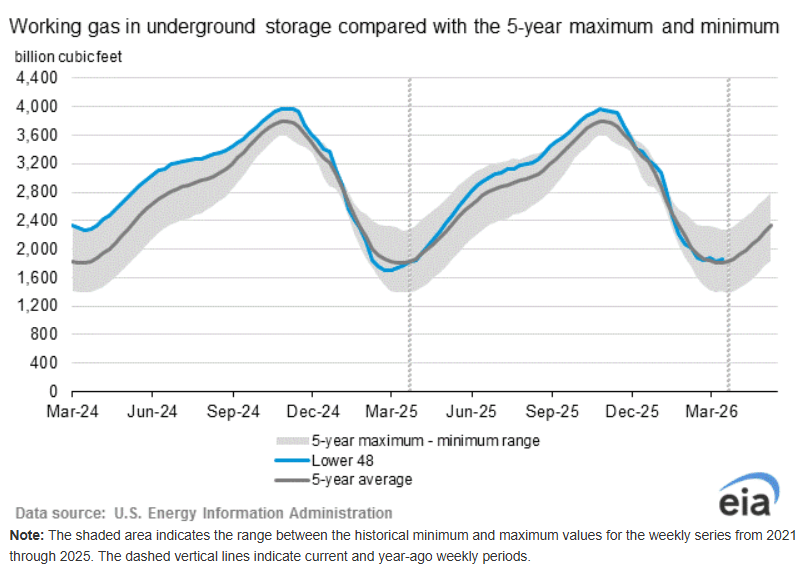
โ€‹โ€‹โ€‹โ€‹โ€‹โ€‹โ€‹Gas inventories have fallen toward the 5-year average, but are now starting to rebound. In March, we had 2 reports that showed a rebound in inventories, despite the theoretical duration of the heating season. Source: EIA
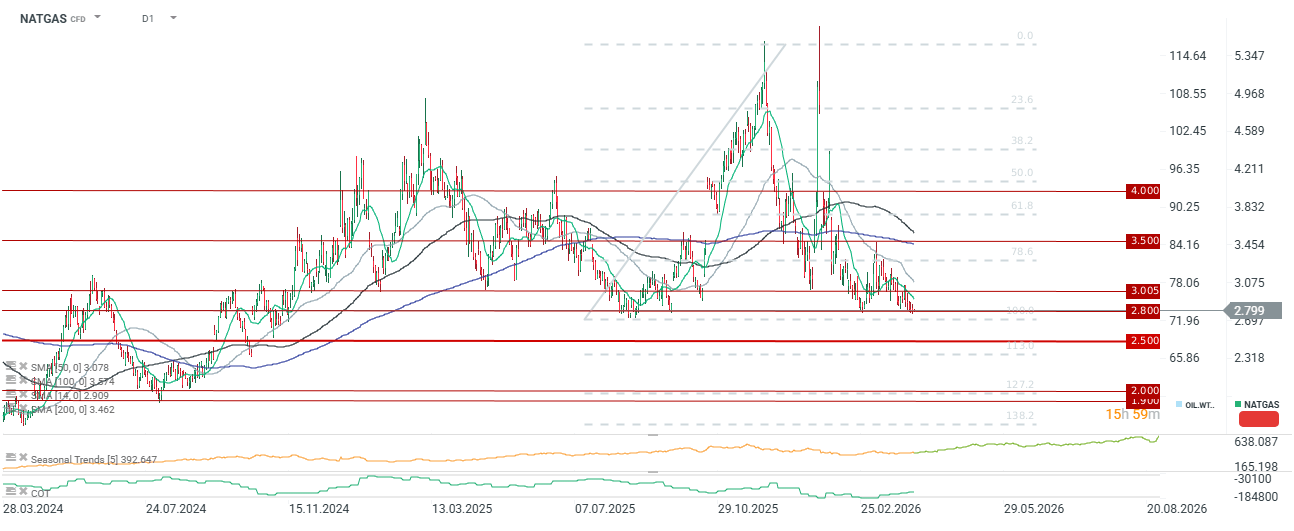
โ€‹โ€‹โ€‹โ€‹โ€‹โ€‹โ€‹The price is at very important support around $2.8/MMBTU. Source: xStation5

Gold:

  • Gold remains at lower levels after Friday’s pullback. Gold still remains trapped amid rising expectations for interest rate hikes and due to massive geopolitical risk and uncertainty regarding further strong global debt growth.
  • According to a World Gold Council report, central banks still intend to buy gold in 2026.
  • Goldman Sachs maintains price forecasts above $5500 per ounce at the end of this year.
  • Signing an agreement to end the fighting or a simple ceasefire could theoretically mean a reduction in geopolitical risk, but also mean a temporary rebound in inflation.
  • Currently, we see that gold or silver behaves more as a risk asset, dependent on interest rates, which is why we observe a high correlation with American indices.
  • It is worth remembering, however, that in 2020, when all assets lost value very strongly, gold rebounded quite quickly after a larger correction.
  • The current correction since the beginning of March is approx. 15%, although at one point the drop was nearly 25%.
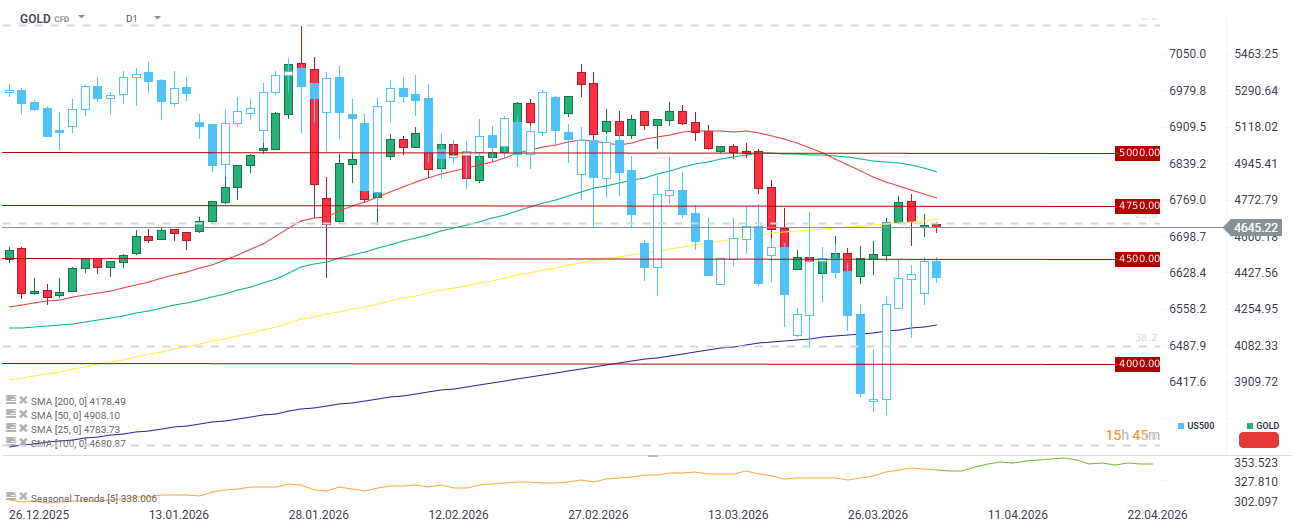
โ€‹โ€‹โ€‹โ€‹โ€‹โ€‹โ€‹The correlation between the price of gold and the US500 has been quite high since almost the beginning of this year. Nevertheless, the scale of the US500 rebound recently does not coincide so strongly with the rebound in the gold price. Source: xStation5

Cocoa:

  • The price of cocoa rebounded at the turn of March and April. However, the peaks from March 11 were not broken, which means a lack of a new sequence of higher highs and higher lows.
  • A Bloomberg Intelligence report indicates that chocolate sales in the USA during the Easter period were 5% lower, which continues to mean destruction of consumer demand due to the persistence of high prices.
  • Cheaper cocoa beans should enter the market in the second half of the year and have the greatest impact on product prices in 2027. Nevertheless, it cannot be ruled out that producers, in order to recover losses, will continue to maintain higher margins with lower bean prices.
  • Cocoa inventories on ICE rose to a 1.5-year peak, reaching almost 2.4 million bags.
  • Just before the start of the mid-season, about half of Ivory Coast and 2/3 of Ghana are currently experiencing dry conditions, which could potentially reduce harvests in the coming months.
  • Nevertheless, taking into account the increase in inventories and oversupply for the second year in a row, a strong price rebound at this point due to potentially worse production is unlikely. The key aspect of the market at this moment is low demand, which shows that chocolate producers have dealt with the lower availability of the raw material that took place after 2022.
  • It is worth remembering that the massive increase in fertilizer prices after 2022 also resulted in less fertilization of cocoa crops, which affected the reduction of production in 2023 and 2024 (aside from weather factors). Therefore, the current increase in fertilizer prices could potentially affect the 2026/2027 main season.
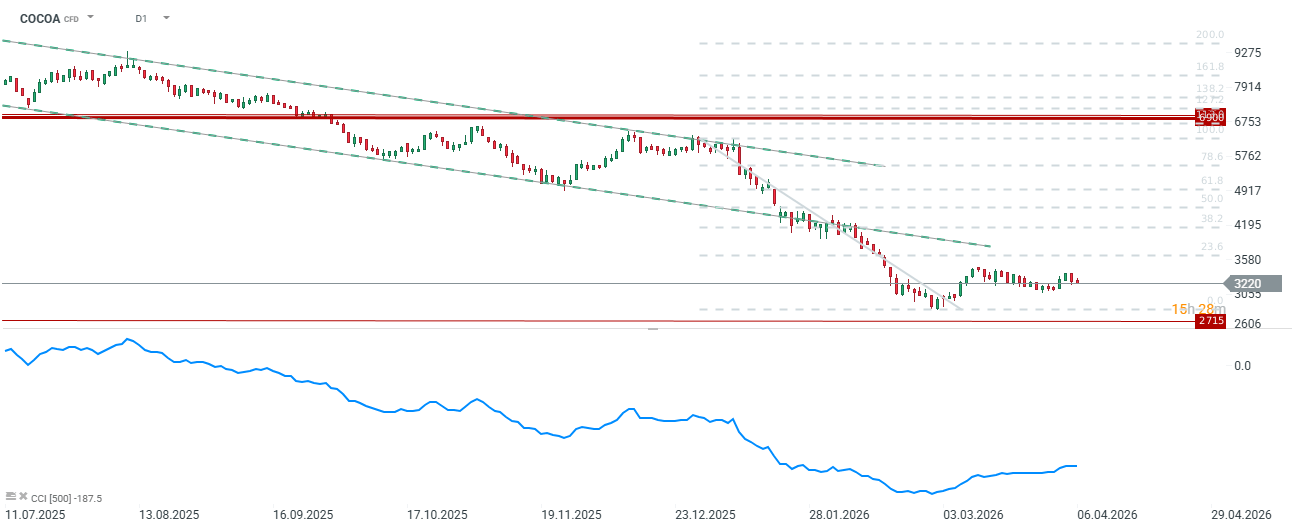
โ€‹โ€‹โ€‹โ€‹โ€‹โ€‹โ€‹The cocoa price remains at low levels due to the lack of signs of a demand rebound. Theoretically, we should observe an improvement in the second half of this year after the exhaustion of inventories from previous years. Source: xStation5

The material on this page does not constitute financial advice and does not take into account your level of understanding, investment objectives, financial situation or any other specific needs. All information provided, including opinions, market research, mathematical results and technical analyzes published on the Website or transmitted To you by other means, it is provided for information purposes only and should in no way be construed as an offer or solicitation for a transaction in any financial instrument, nor should the information provided be construed as advice of a legal or financial nature on which any investment decisions you make should be based exclusively To your level of understanding, investment objectives, financial situation, or other specific needs, any decision to act on the information published on the Website or sent to you by other means is entirely at your own risk if you In doubt or unsure about your understanding of a particular product, instrument, service or transaction, you should seek professional or legal advice before trading. Investing in CFDs carries a high level of risk, as they are leveraged products and have small movements Often the market can result in much larger movements in the value of your investment, and this can work against you or in your favor. Please ensure you fully understand the risks involved, taking into account investments objectives and level of experience, before trading and, if necessary, seek independent advice.

Currency Hedger No Comments

GBP/USD climbs above 1.3240 as Iran hopes dent US Dollar

  • GBP/USD rises as ceasefire speculation weighs on the US Dollar.
  • Softer US services data added pressure on the Greenback.
  • Traders now await US inflation, jobless claims and Fed minutes.

Theย British Poundย (GBP) advances by over 0.40% on Monday as US President Donald Trump said the Tuesday deadline he has set for Iran to make a deal is final, while rumors of a possible de-escalation weighed on the US Dollar (USD). GBP/USD trades around the 1.3240 figure at the time of writing.

Sterling gains as ceasefire rumors lift mood, soften Greenback

Risk appetite improved on Monday after Axios reported that US and Israeli officials, along with regional mediators, are discussing a 45-day ceasefire that could be extended if needed. Investors cheered theย news, as depicted by USย equitiesย posting gains of 0.15% to 0.52%.

Data from the US showed that business activity deteriorated, according to the Institute for Supply Management (ISM), as the Services PMI in March slipped from 56.1 to 54, below economists’ forecasts of 55. The Prices Paid sub-component of the PMI rose to its highest level since October 2022, coming at 70.7, sparked by the rise of oil and fuel costs, commented Steve Miller, the Chair of the ISMโ€™s Services Business Survey Committee.

Last week, strong US jobs data posted the largest job gains in 15 months and a dip in the Unemployment Rate. Nonfarm Payrolls rose by 178K in March, exceeding estimates of 60K. Meanwhile, the Unemployment Rate fell to 4.3% from 4.4% in February.

Consequently, expectations that theย Federal Reserveย (Fed) will cutย ratesย are none, according to data from Prime Market Terminal, which reflects that the Fed funds rate will remain in the 3.50%-3.75% range, steady in 2026.

Fed interest rate probabilities

Source: Prime Market Terminal

Traders’ eyes will be on the release of US inflation figures,ย jobless claims, and the Federal Reserve’s last meeting minutes.

GBP/USD Price Forecast: Technical Outlook

Chart Analysis GBP/USD

In the daily chart, GBP/USD trades at 1.3239. The near-term bias is mildly bearish as spot holds below the downward-sloping resistance trend line from 1.3869 and trades under the clustered simple moving averages near 1.3500, which now cap the upside. The persistent rejection along that descending line, combined with price pressure below the 50โ€“100โ€“200-day group, signals sellers retaining control, even as the longer-term rising support trend line from 1.3035 still prevents a steeper breakdown.

Initial resistance is now at 1.3320, where recent rebounds have stalled beneath the descending trend line, followed by 1.3435 and the moving-average zone around 1.35. A daily close above that 1.35 area would be needed to dilute the current bearish tone and reopen 1.3600. On the downside, immediate support is seen at 1.3187, with 1.3130 and the rising trend line from 1.3035 below; a clean break under that trend support would confirm a deeper bearish extension toward 1.3050.

(The technical analysis of this story was written with the help of an AI tool.)

Pound Sterling Price Today

The table below shows the percentage change of British Pound (GBP) against listed major currencies today. British Pound was the strongest against the US Dollar.

USDEURGBPJPYCADAUDNZDCHF
USD-0.23%-0.28%0.02%-0.22%-0.33%-0.45%-0.25%
EUR0.23%-0.03%0.24%0.00%-0.13%-0.25%-0.05%
GBP0.28%0.03%0.25%0.00%-0.09%-0.22%0.00%
JPY-0.02%-0.24%-0.25%-0.23%-0.36%-0.49%-0.28%
CAD0.22%-0.00%-0.01%0.23%-0.10%-0.23%-0.02%
AUD0.33%0.13%0.09%0.36%0.10%-0.14%0.09%
NZD0.45%0.25%0.22%0.49%0.23%0.14%0.23%
CHF0.25%0.05%-0.01%0.28%0.02%-0.09%-0.23%

The heat map shows percentage changes of major currencies against each other. The base currency is picked from the left column, while the quote currency is picked from the top row. For example, if you pick the British Pound from the left column and move along the horizontal line to the US Dollar, the percentage change displayed in the box will represent GBP (base)/USD (quote).

Currency Hedger No Comments

EUR/USD inches higher above 1.1500 amid hopes on US-Iran ceasefire talks

  • EUR/USD trades with mild gains around 1.1520 in Mondayโ€™s early European session.ย 
  • The US and Iran explore a 45-day ceasefire ahead of the deadline.ย 
  • ECB policymakers emphasized that policy will remain restrictive until inflation sustainably returns to the target.ย  ย 

The EUR/USD pair posts modest gains near 1.1520 during the early European session on Monday.ย The Euroย (EUR) strengthens against the Greenback amid optimism about the US-Iran ceasefire. The US March ISMย Services Purchasing Managers Index (PMI) report is due later on Monday.ย 

Bloomberg reported on Monday, citing Axios, that the US, Iran, and regional mediators are discussing terms for a possible 45-day ceasefire that could lead to an end of fighting. The source said that the chances of reaching a deal over the next 48 hours are low. Earlier, US President Donald Trump extended his deadline by 20 hours, posting a new deadline of Tuesday at 8:00 pm EST (00:00 GMT on Wednesday). 

Data on Friday suggested US labor market conditions remained calm in March, though economists warned that a prolonged war in the Middle East posed a downside risk. “Our concern is that with the Middle East conflict showing little sign of coming to an imminent conclusion, an overlay of heightened geopolitical, economic and market angst is not going to incentivise business to suddenly start hiring now,” said ING economist James Knightley. 

Hawkish comments from the European Central Bank (ECB) policymakers could support the shared currency. The ECB has maintained a firm commitment to combating inflation. Presidentย Christine Lagardeย and other Governing Council members have delivered consistent messages, emphasizing that policy will remain restrictive until inflation sustainably returns to the 2% target. ย 

Currency Hedger No Comments

CAD remains depressed against a firmer USD; bullish Oil prices limit losses

  • USD/CAD trades with a positive bias for the third straight day, though it lacks bullish conviction.
  • Rising geopolitical tensions and Fed rate hike bets continue to support the USD and spot prices.
  • Elevated Crude Oil prices underpin the Loonie and hold back bulls from placing aggressive bets.

Theย USD/CADย pair attracts some buyers for the third consecutive day on Monday and trades just below mid-1.3900s during the Asian session, well within striking distance of a nearly four-month high set last week amid a firmer US Dollar (USD). The uptick, however, lacks bullish conviction as elevated Crude Oil prices could underpin the commodity-linked Loonie and cap gains for spot prices.

US President Donald Trump threatened to target Iranโ€™s power plants and bridges if the Strait of Hormuz is not reopened by Tuesday, while Iran introduced new conditions for reopening the strategic waterway. This raises the risk of a further escalation of the ongoing conflict in the Middle East and continues to underpin the USD’s status as the global reserve currency. Adding to this, rising bets for an interest rate hike by the USย Federal Reserveย (Fed) turn out to be another factor supporting the USD and acting as a tailwind for the USD/CAD pair.

The closely-watched US Nonfarm Payrolls (NFP) report showed on Friday that the US economy added 178K new jobs in March, reversing the previous month’s revised net loss of 133K. Adding to this, the Unemployment Rate unexpectedly fell to 4.3% last month. This comes on top of inflation fears stemming from the war-driven surge in Crude Oil prices and removes any near-term pressure on the Fed to cutย rates, which remains supportive of elevated US Treasury bond yields. Theย outlook, in turn, continues to support the USD and the USD/CAD pair.

Meanwhile, supply disruption worries lift Crude Oil prices to a nearly four-week top. This might hold back traders from placing aggressive bearish bets around the Canadian Dollar (CAD) and warrants some caution before positioning for any further move higher for the USD/CAD pair. Hence, it will be prudent to wait for a sustained strength and acceptance above the 1.3900 mark, or the year-to-date high, before positioning for an extension of a nearly one-month-old uptrend from the 1.3525 region, or the March monthly swing low.

Currency Hedger No Comments

Trade of The Day – AUD/JPY

Facts: 
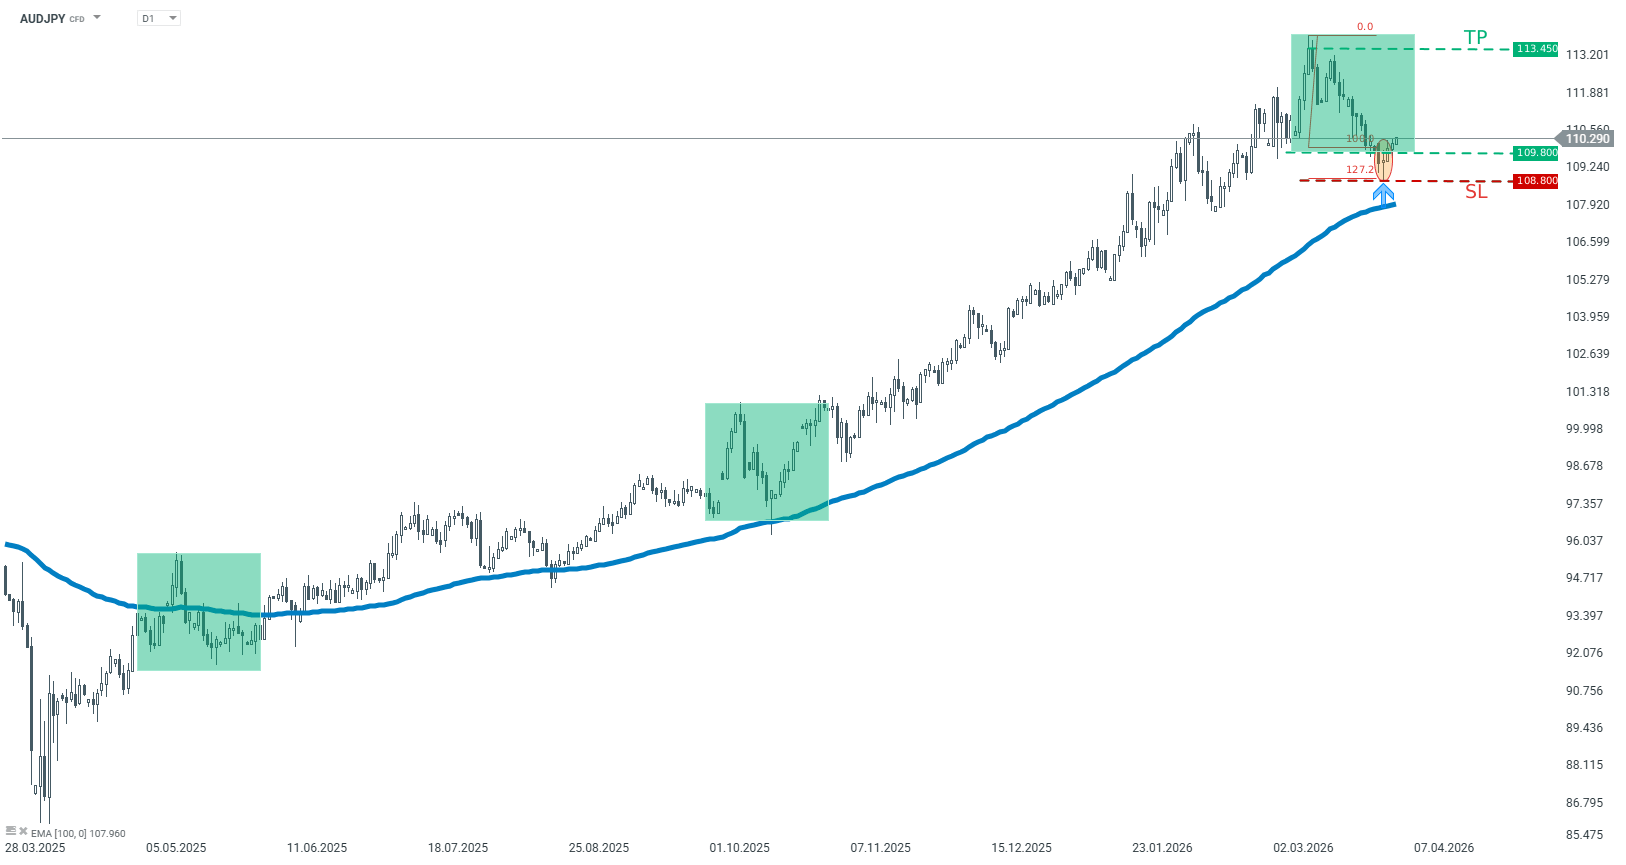
Pair bounced off the lower limit of the 1:1 structure at 109.80
The main sentiment remains bullish from April 2025

Recommendation: 
Trade: Long AUDJPY at market price
Target: 113.45
Stop: 108.80

Opinion: Looking at the D1 interval on AUDJPY chart, one can see that the price bounced off the key support. The support is marked with the lower limit of 1:1 structure at 109.80. In addition, the price sits above the 100-period moving average from the D1 interval. Taking this into account, another upward impulse is the base case scenario. We recommend going long AUDJPY at market price with a target of 113.45. We also recommend placing a stop loss order at 108.80. Source: xStation5
 

Currency Hedger No Comments

WTI rallies back closer to $99.00 as Trumpโ€™s comments dampen Iran de-escalation hopes

  • WTI stages a solid recovery from a one-week low, touched on Wednesday.
  • Trumpโ€™s remarks temper de-escalation hope and boost the commodity.
  • Reviving Fed rate hike bets underpin the USD, which might cap Oil prices.

West Texas Intermediate (WTI) Crude Oil prices catch aggressive bids during the Asian session on Thursday and surge past the $97.00 mark as US President Donald Trump’s prime-time address gets underway. The commodity now seems to have snapped a two-day losing streak to a one-week low, around mid-$92.00s, touched the previous day.

Trump reiterated the 2-3 week timeline and also threatened to hit Iran’s energy infrastructure if no deal is reached. This comes on top of the Wall Street Journal’s report on Tuesday that the United Arab Emirates (UAE) is pushing for military action to reopen the Strait of Hormuz and is lobbying for a UN Security Council resolution to authorize such an operation.

Moreover, the US is heavily reinforcing the Middle East with thousands of troops, marking the largest military buildup in two decades. This raises the risk of a further escalation of ongoing conflicts in the world’s premier oil-producing region and backs the case for a further appreciating move for the black liquid, back closer to a multi-week top set on Tuesday.

Meanwhile, the latest leg up in revives inflationary concerns, bolstering bets for an interest rate hike by the US Federal Reserve (Fed). Apart from this, a fresh wave of the global risk-aversion trade benefits the US Dollar’s (USD) status as the global reserve currency, which tends to undermine USD-denominated commodities, and might keep a lid on Crude Oil prices.

Currency Hedger No Comments

Currency Hedger – Future Talk

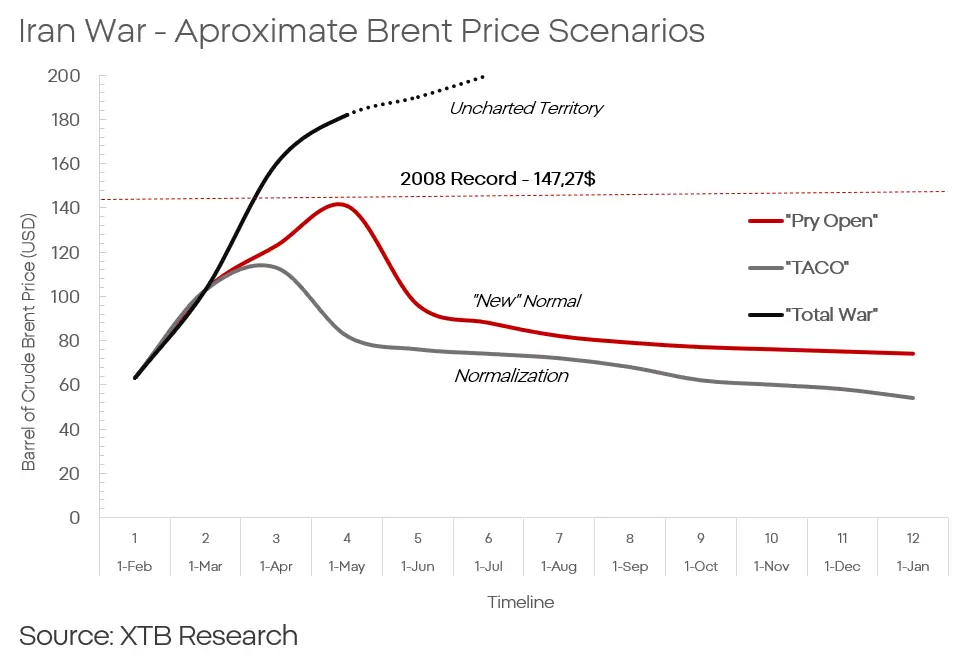
Most market participants are currently forced to factor the potential short-term development of the situation in Iran into asset pricing. The scale, objectives and time horizon of military operations on both sides will have a real impact on markets. One question must nevertheless be asked: no war lasts forever.

What will happen once it ends?

Armed conflicts are negative-sum undertakings. The enormous scale of destruction and the volume of resources burned in sustaining them impose a limited time horizon on such wars. The same applies to the ongoing conflict in the Persian Gulf. The United States is facing mounting pressure from fuel and fertilizer prices, while inflation and the midterm elections are looming ever larger over President Donald Trumpโ€™s administration. On the Iranian side, the situation is even worse. The backward and neglected economy of an overcrowded desert state cannot survive under conditions of continuous and large-scale bombardment by the United States and Israel. The blockade of the Strait of Hormuz also means that both European and Asian countries, despite their lack of direct involvement in the conflict, have a vital interest in its de-escalation or at the very least in reopening the strait.

In light of all available information and based on cautious forecasts, it is already possible at this stage of the conflict to identify a number of scenarios that appear the most likely and to analyze how they may affect financial markets.

Scenario 1. Forcing the strait open and partial normalization

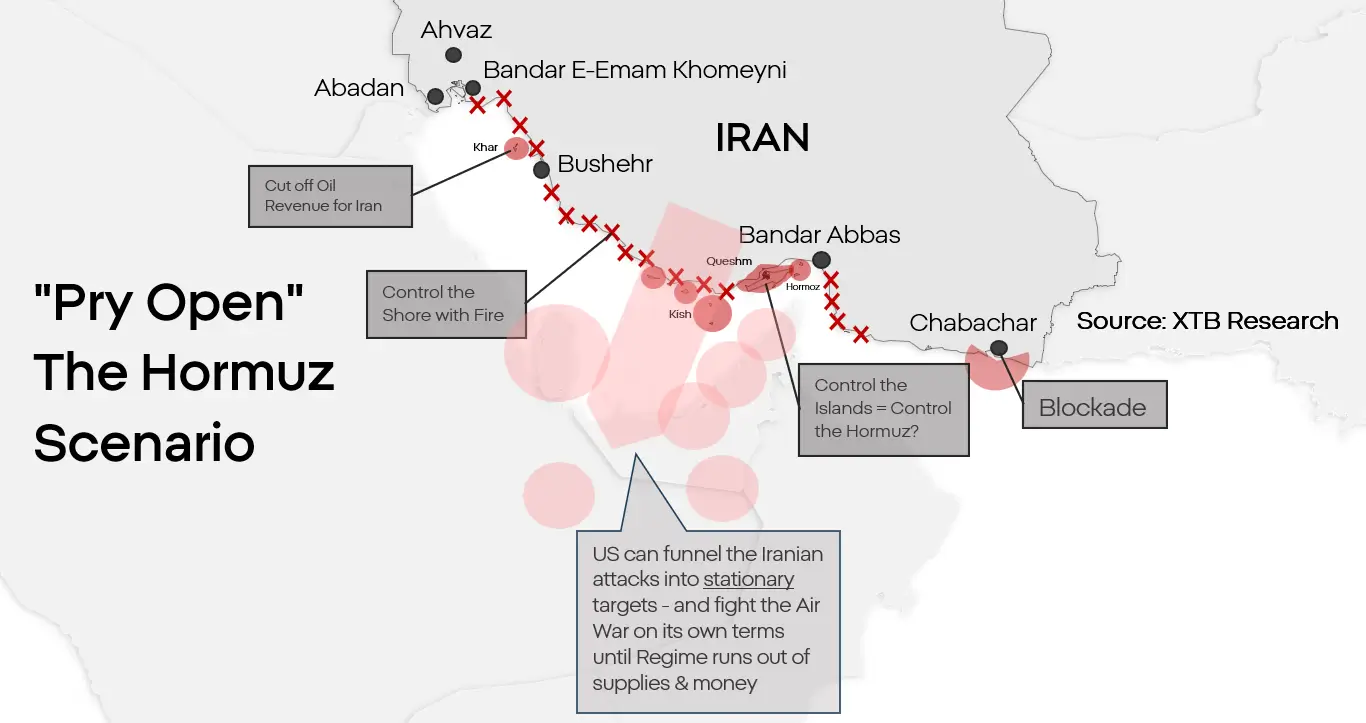
For now, this appears to be the base-case scenario for which both sides are preparing. While a full-scale invasion of Iran is possible, contrary to the opinion of many observers, that does not mean it will be necessary. The United States does not need to conquer Iran. It needs to neutralize Iranโ€™s nuclear program and reopen the Strait of Hormuz. This scenario assumes a landing on one or several islands in the strait, their seizure, and the control of the coastline through naval gunfire. Iran lacks the capability to defend forward positions along the Persian Gulf coast, and the drones it uses to attack tankers are not capable of striking moving targets from deep inland. Paralysing Iranโ€™s ability to block the strait would, over time, remove the main constraints on the American side and deprive Iran of its most important lever. This would in no way mean the fall of the government of the Islamic Republic, but over time it could force Iran into some form of ceasefire or even a limited yet still functional capitulation.

Market reaction:

  • Support for oil prices primarily over the longer term. Such an operation could last many months, and Iran, even if defeated, would remain dangerous. Beyond the costs of reconstruction and the normalization of supply chains, this would imply a persistent long-term risk premium tied to the possibility of renewed conflict in the strait.
    • A short-term rise in Brent to around $120 to $140 per barrel
    • Followed by a gradual decline to around $80 per barrel, with a long-term risk premium of $5 to $10
  • Escalation could also support gold prices and valuations of defense-sector companies.
  • A 5 to 7% increase in gold prices is possible in the short to medium term on the back of escalation.
  • It would also put pressure on emerging-market currencies.
  • A long-term but moderate decline in Asian equities and parts of the European market is also likely.

Scenario 2. Total escalation and a fragile peace

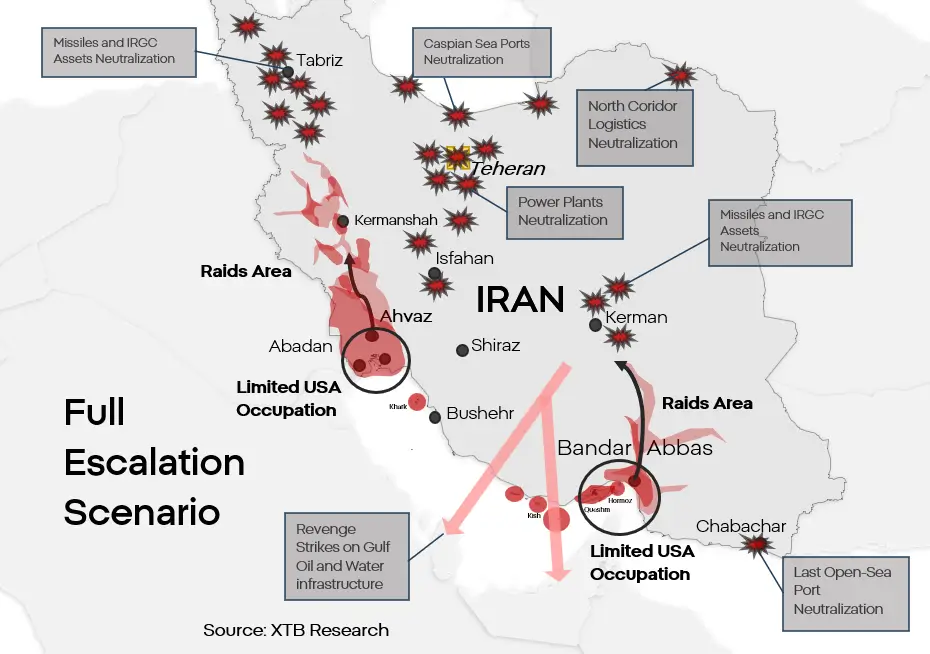
This is the logical โ€œmaximum optionโ€, representing an extension of the first scenario. It assumes a genuine attempt to destroy the Iranian regime in its current form and to sign some kind of โ€œagreementโ€ with whatever remains of it. It should be remembered that both sides, though the United States to a greater extent, are still limiting the scale of their attacks and the profile of their targets. The United States could combine a ground strike with attacks on critical infrastructure. Damage to infrastructure used for energy production and water supply in Iran would lead to a humanitarian crisis on a scale that is difficult to imagine. A scale that would make it impossible for the regime to continue military operations and organized resistance. In retaliation, Iran would attempt to strike, with all remaining means, desalination infrastructure as well as extraction and refining assets in the GCC states. Iran does not possess the capability to cause a full collapse of energy and water systems on the other side of the Gulf. However, the destruction could be severe enough to force the evacuation of part of the population from the area, while infrastructure damage could leave installations out of use for many months after the end of the conflict.

Neither the Iranian military nor the IRGC is capable of repelling a determined American ground assault, should one occur. The combination of unrestricted strikes on Iran and a limited ground invasion in the region, for example in Khuzestan or Bandar Abbas, would give the United States room to establish a forward operating base for special forces raids aimed at neutralizing Iranโ€™s nuclear program and/or supporting any anti-government movements. Such a scenario would, at enormous cost to all sides, lead to the partial or complete neutralization of Iran as a threat to the region.

Market reaction:

  • The rise in oil prices would be larger and more violent, although it is difficult to predict how prices would behave over the long term given such a major shift in the regional balance of power.
    • The price of Brent could initially reach as high as $160 to $180 per barrel
  • Gold prices could also rise.
    • A return to $5,100 would be within reach.
  • The conflict would likely spread geographically even further, which could push airline stocks even lower.
    • Another sell-off of around 6 to 10% should be expected.
  • The dollar could once again experience extraordinary gains, similar to those seen in 2022.
    • Possible levels would be around 1.18-1,2 on EUR/USD and 3.8 to 3.9 on USD/PLN
  • Defense-sector stocks would likely reach new highs.

Scenario 3. Iranian-style “TACO”

Escalation is currently the base-case scenario, but it is not the only one. Although it would undoubtedly be difficult, Donald Trump may decide to attempt to withdraw the United States from the conflict without bringing it to a definitive resolution. A scenario involving de-escalation and a U.S. withdrawal from the strait on terms close to those desired by Iran is less likely, not only because it would represent a reputational defeat for the United States, but also because of the difficult-to-ignore informal influence Israel exerts on American foreign policy. That does not mean, however, that it is impossible. A military defeat, political crisis or economic crisis could force the United States into some form of compromise that, from Washingtonโ€™s perspective, would amount to defeat. Such a compromise could be more or less formal and would ultimately involve some form of sanctions relief in exchange for a certain degree or type of disarmament on Iranโ€™s part.

Market reaction:

  • In the scenario most favorable to Iran, the possibility would emerge for the country to reintegrate into the global market. In the medium and long term, this would imply a collapse in oil prices.
    • After a ceasefire is signed, oil could quickly fall to around $75 per barrel, and over the course of several quarters could even reach the $50 range.
  • A decline in geopolitical risk would put pressure on the dollar and defense stocks.
    • A gradual return of EUR/USD to around 1.10 – 1.12 would be possible.
  • Despite the decline in risk, gold should still perform relatively well due to inflation risk and demand from central banks.
    • That would not, however, apply to silver or platinum.
  • A rebound in cryptocurrencies and in the shares of companies most heavily hit by the conflict, such as airlines, car manufacturers and the tourism sector, would also be possible.
    • Gains could range from several to even a dozen or so percent.
  • This would also represent a reputational, and not only reputational, defeat for the United States. In the short term, this might not have a major effect on capital allocation, but over the longer term it could lead to a shift in the economic and market center of gravity away from the United States and toward Europe and Asia.

The material on this page does not constitute financial advice and does not take into account your level of understanding, investment objectives, financial situation or any other specific needs. All information provided, including opinions, market research, mathematical results and technical analyzes published on the Website or transmitted To you by other means, it is provided for information purposes only and should in no way be construed as an offer or solicitation for a transaction in any financial instrument, nor should the information provided be construed as advice of a legal or financial nature on which any investment decisions you make should be based exclusively To your level of understanding, investment objectives, financial situation, or other specific needs, any decision to act on the information published on the Website or sent to you by other means is entirely at your own risk if you In doubt or unsure about your understanding of a particular product, instrument, service or transaction, you should seek professional or legal advice before trading. Investing in CFDs carries a high level of risk, as they are leveraged products and have small movements Often the market can result in much larger movements in the value of your investment, and this can work against you or in your favor. Please ensure you fully understand the risks involved, taking into account investments objectives and level of experience, before trading and, if necessary, seek independent advice.

Currency Hedger No Comments

U.S Dollar Index (DXY) eases from YTD peak, trades below 100.50 on Iran de-escalation hopes

  • DXY attracts some sellers following a modest Asian session rise to a fresh YTD top.
  • Trump is reportedly open to ending the war without reopening the Strait of Hormuz.
  • Inflation concerns and rising Fed rate hike bets should help limit losses for the USD.

The US Dollar Index (DXY), which tracks the Greenback against a basket of currencies, retreated from its highest level since May 2025, touched during the Asian session this Tuesday, snapping a five-day winning streak. The index, however, lacks follow-through selling amid contrasting headlines over peace talks to end the war in the Middle East and currently trades around the 100.40-100.45 region, down less than 0.10% for the day.

The Wall Street Journal โ€‹reported โ€‹on Monday that US President Donald Trump is willing to end โ€‹the military โ€‹campaign against Iran even if the โ€‹Strait of โ€‹Hormuz remains largely closed. The headlines trigger a turnaround in the global risk sentiment, which, in turn, is seen undermining the safe-haven USD. Furthermore, a corrective pullback in Crude Oil prices helps ease inflationary concerns and keep US Treasury bond yields on the defensive, turning out to be another factor weighing on the Greenback.

Meanwhile, Trump issued a stark warning that the US could launch massive strikes on Iran’s key energy infrastructure if a deal is not reached soon and if the Strait of Hormuz is not immediately reopened to commercial traffic. Moreover, Iran has signaled reluctance to engage in direct negotiations with the US, highlighting fragile diplomatic progress. Adding to this, the US is still deploying additional troops and assets to the region, fueling uncertainty about a quick de-escalation of tensions in the region.

This should act as a tailwind for Crude Oil prices, which keeps inflation risks and bets for a rate hike by the US Federal Reserve (Fed) in play. The hawkish outlook, in turn, should help limit deeper losses for the USD and warrants some caution before confirming that the index has topped out in the near term. Traders now look to the US economic data โ€“ JOLTS Job Openings and the Conference Board’s US Consumer Confidence Index, for a fresh impetus later during the North American session.

US Dollar Price Today

The table below shows the percentage change of US Dollar (USD) against listed major currencies today. US Dollar was the strongest against the New Zealand Dollar.

USDEURGBPJPYCADAUDNZDCHF
USD-0.06%-0.14%-0.03%0.03%-0.01%0.03%-0.12%
EUR0.06%-0.07%0.05%0.13%0.08%0.12%-0.03%
GBP0.14%0.07%0.13%0.21%0.16%0.20%0.05%
JPY0.03%-0.05%-0.13%0.06%0.02%0.05%-0.08%
CAD-0.03%-0.13%-0.21%-0.06%-0.04%-0.00%-0.15%
AUD0.00%-0.08%-0.16%-0.02%0.04%0.05%-0.11%
NZD-0.03%-0.12%-0.20%-0.05%0.00%-0.05%-0.16%
CHF0.12%0.03%-0.05%0.08%0.15%0.11%0.16%

The heat map shows percentage changes of major currencies against each other. The base currency is picked from the left column, while the quote currency is picked from the top row. For example, if you pick the US Dollar from the left column and move along the horizontal line to the Japanese Yen, the percentage change displayed in the box will represent USD (base)/JPY (quote).