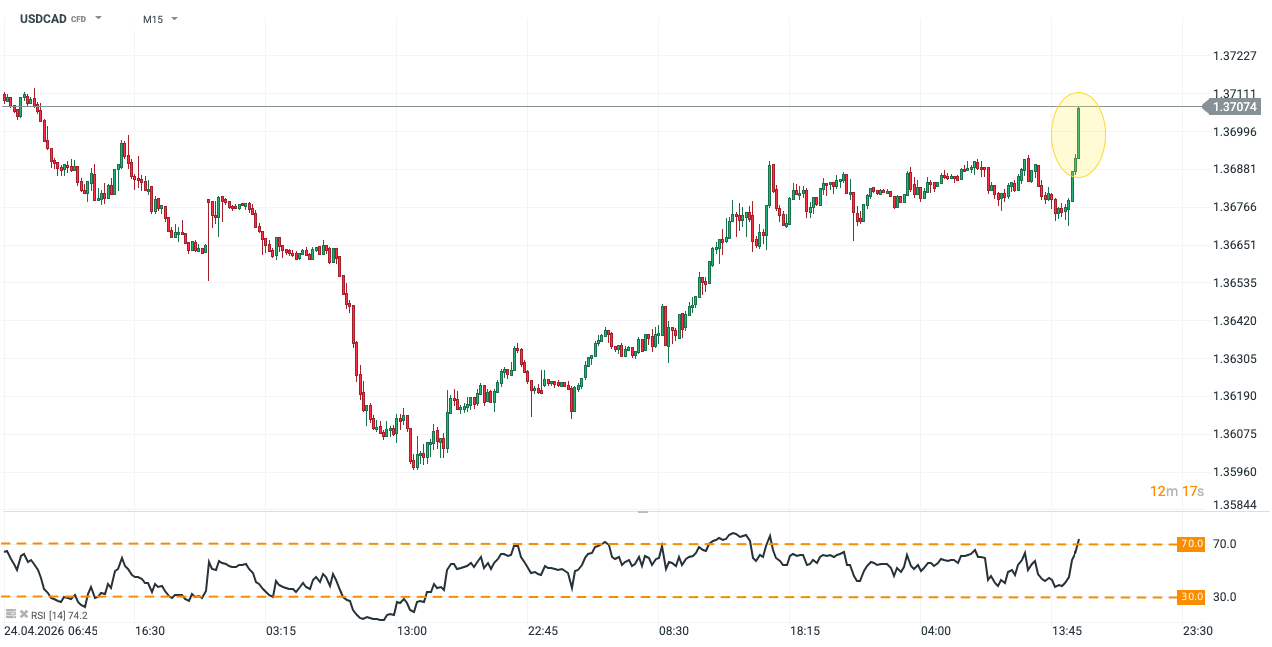
The Bank of Canada maintained its policy interest rate at 2.25%, a level held since October. The Governing Council decided to “look through” the immediate inflationary impact of the Middle East war. However, policy remains “nimble,” with potential for rate hikes if energy price shocks lead to persistent, generalized inflation. Economic projections:
Inflation Outlook : March CPI inflation rose to 2.4% from 1.8% in February, driven by surging gasoline prices. Inflation is forecast to peak at 3% in April before returning to the 2% target in early 2027.
Economic Growth Projections : GDP growth is projected at 1.2% in 2026, rising to 1.7% by 2028 as trade and investment gradually recover. While consumption and government spending support the economy, US tariffs and trade uncertainty—specifically the CUSMA review—weigh on exports. Canada’s net oil exporter status provides some relative resilience.
Labor Market and Risks : The labor market is soft, with unemployment between 6.5% and 7%. Key risks include new US trade restrictions, which could trigger rate cuts, or persistent energy price pressures that might necessitate consecutive rate increases. Productivity is seeing an early boost from businesses adopting artificial intelligence technologies.
GBP/USD wobbles around 1.3500 as the US Dollar consolidates in the countdown to Fed-BoE policy announcements.
The Fed is expected to warn of upside inflation risks after leaving interest rates unchanged.
Investors expect the BoE to hold interest rates steady at 3.75%.
The GBP/USD pair is broadly sideways around 1.3500 during the European trading session on Wednesday. The Cable consolidates as investors await monetary policy announcements by the Federal Reserve (Fed) and the Bank of England (BoE).
The Fed is anticipated to leave interest rates unchanged in the range of 3.50%-3.75% in its monetary policy announcement at 18:00 GMT, according to the CME FedWatch tool. In the monetary policy statement, the Fed is expected to warn about de-anchored inflation projections and growing economic risks amid higher oil prices due to prolonged Strait of Hormuz closure.
Ahead of the Fed’s policy meeting, the US Dollar Index (DXY), which tracks the Greenback’s value against six major currencies, trades 0.1% higher to near 98.70.
On Thursday, the BoE is expected to hold interest rates steady at 3.75%, with an 8-1 majority. In an event at the International Monetary Fund (IMF) this month, BoE Governor Andrew Bailey said the war has resulted in a “big negative shock” to the economy; however, there is no rush for any monetary policy adjustment.
GBP/USD technical analysis
GBP/USD trades flat at around 1.3500, holding a modest bullish bias as it sits above the 20-day Exponential Moving Average (EMA) at 1.3470 and the 38.2% Fibonacci retracement at 1.3432.
The Relative Strength Index (RSI) at 55.4 leans slightly positive, suggesting buyers retain the upper hand while upside traction remains gradual.
On the topside, immediate resistance is aligned at the 50.0% Fibonacci retracement at 1.3515, with further barriers at the 61.8% level at 1.3599, followed by 1.3718 and 1.3870. On the downside, initial support is seen at the 20-day EMA at 1.3470, ahead of the 38.2% retracement at 1.3432; a deeper pullback would expose the 23.6% level at 1.3328 and the structural floor near 1.3161.
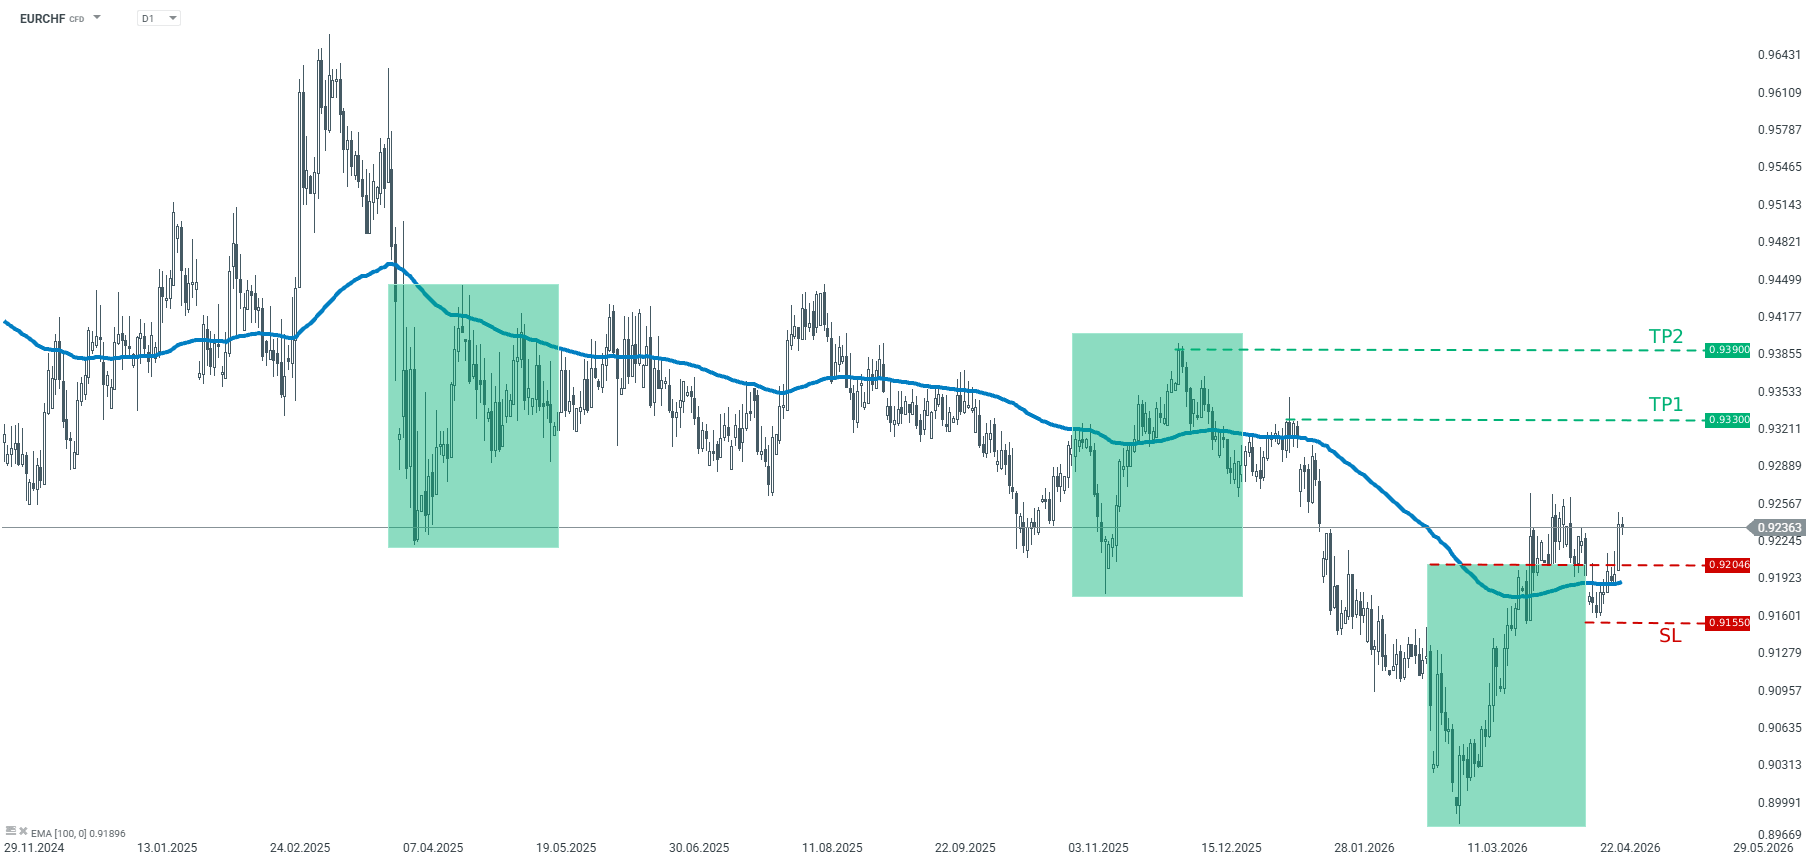
EURCHF is trading above the 100-period exponential moving average from D1 interval
Recommendation: Trade: Long EURCHF at market price Target: 0.9330, 0.9390 Stop: 0.9155
Opinion: Looking at EURCHF on the H4 interval, one can see a potential trend reversal. The pair managed to break above the 1:1 structure – according to the Overbalance strategy, such a situation heralds a bigger upward move. It seems that as long as the price sits above the 0.9204 support, continuation of the upward move is the base case scenario. In addition the pair sits above the 100-period moving average from the D1 interval. We recommend going long EURCHF at market price with two targets: 0.9330 and 0.9390. We also recommend placing a stop loss order at 0.9155. Source: xStation
USD/CAD trades firmly near 1.3700 as the US Dollar gains ahead of the Fed’s monetary policy.
The Fed and the BoC are expected to hold interest rates steady.
Investors await fresh cues on the US inflation and the interest rate outlook.
The USD/CAD pair clings to Tuesday’s gains around 1.3690 during the European trading session on Wednesday. The Loonie pair reflects strength as the US Dollar (USD) trades higher ahead of the Federal Reserve’s (Fed) monetary policy announcement at 18:00 GMT.
At the press time, the US Dollar Index (DXY), which tracks the Greenback’s value against six major currencies, trades 0.15% higher to near 98.75.
Investors expect the Fed to leave interest rates unchanged in the range of 3.50%-3.75%, as elevated energy prices have de-anchored inflation projections globally. Market participants will pay close attention to the monetary policy statement and Fed Chair Jerome Powell’s speech to get fresh cues on inflation and the United States (US) interest rate outlook.
Ahead of the Fed’s policy, the Bank of Canada (BoC) will announce its monetary policy at 13:45 GMT, in which it is also expected to hold interest rates steady. Market participants will closely monitor remarks regarding the Canadian labor market outlook, with the Unemployment Rate remaining higher at 6.7%.
USD/CAD technical analysis
USD/CAD reflects strength at around 1.3690 as of writing. However, the price keeps a mildly bearish near-term tone as it remains below the 20-period Exponential Moving Average (EMA) at 1.3724.
The Relative Strength Index (RSI) near 44 suggests fading bullish momentum and hints that sellers are gaining incremental control while price remains capped by the overhead EMA.
On the topside, immediate resistance aligns with the 20-period EMA at 1.3724, and a daily close above this barrier would be needed to ease the current downside bias and reopen a push toward 1.3800. Looking down, initial support is seen at the former trend-line-based floor near 1.3593; a sustained break below that area would reinforce the developing bearish phase.
The Indian Rupee continues to underperform against the US Dollar amid rising oil prices.
US President Trump warns of extending the blockade on Iranian sea ports.
The Fed is expected to leave interest rates unchanged.
The Indian Rupee (INR) extends its decline against the US Dollar (USD) on Wednesday. The USD/INR pair rallies further to near 94.75, as oil prices have extended their advance, following comments from United States (US) officials on late Tuesday that President Donald Trump has instructed aides to prepare for an extended blockade of Iran, The Wall Street Journal (WSJ) reported.
At the press time, the WTI Oil price trades flat around $97.00 but gained sharply in the late Tuesday’s session to near $99.50, the highest level seen in almost three weeks.
Currencies from economies, such as India, which rely heavily on oil imports to meet their energy needs, tend to underperform in a high oil price environment.
Trump prefers squeezing oil flows from Iran than bombing its territory again
The WSJ report showed the US President Trump has stated that the continuation of the blockade of Iranian sea ports is a preferred measure to push Tehran on the back foot in negotiating terms for a permanent ceasefire than bombing Iranian territory again.
The continuous US blockade on Iran means the prolonged closure of the Strait of Hormuz, a vital passage for almost 20% of global energy supply.
FIIs keep offloading their stake in Indian stock market
Overseas investors have emerged as net sellers for the seventh straight trading day on Tuesday, and have offloaded their stake worth Rs. 20,395.08 crore. Foreign Institutional Investors (FIIs) worry that “higher-for-longer” oil prices would be a major drag on India Inc.’s earnings projections by hitting their margins and will also diminish households’ spending power.
Investors shift focus to the Fed policy
On Wednesday, the major trigger for global markets will be the Federal Reserve’s (Fed) monetary policy announcement at 18:00 GMT, in which the central bank is expected to leave interest rates unchanged in the range of 3.50%-3.75%.
The Fed is expected to warn of upside inflation and downside economic risks amid escalated energy prices. This will be the last Fed policy meeting by Jerome Powell as Chairman. Investors will pay close attention to Fed Chair Powell’s speech to get fresh cues on the US interest rate outlook.
Technical Analysis: USD/INR approaches all-time high above 95.00
USD/INR trades higher at around 94.75 in the opening session on Wednesday. The pair holds a bullish near-term bias as spot remains above the 20-day exponential moving average (EMA) at roughly 93.66, keeping the recent advance supported.
The Relative Strength Index (RSI) around 63 suggests firm but not yet overbought upside momentum, reinforcing the constructive tone while leaving room for additional gains.
On the downside, immediate support is seen at the 20-day EMA near 93.66. As long as USD/INR defends this moving average, dips are likely to attract buying interest, and the broader uptrend is expected to stay intact. Looking up, the spot is expected to revisit the all-time high slightly above 95.00.
EUR/USD trades calmly near 1.1700 ahead of the Fed-ECB monetary policy announcement.
Both the Fed and the ECB will likely maintain the status quo.
The German HICP is estimated to have grown at a stronger pace of 3% YoY in April.
The EUR/USD pair consolidates around 1.1700, inside Tuesday’s trading range, during the Asian trading session on Wednesday. The major currency pair has remained broadly sideways, with investors awaiting monetary policy announcements by the Federal Reserve (Fed) and the European Central Bank (ECB) on Wednesday and Thursday, respectively.
Both the Fed and the ECB are expected to leave interest rates unchanged at their current levels, and warn of upside inflation risks amid elevated energy prices due to the prolonged closure of the Strait of Hormuz.
Investors will pay close attention to commentaries from Fed Chair Jerome Powell and ECB President Christine Lagarde to get cues about whether their respective central banks are discussing the need to tighten monetary conditions in the near term.
Ahead of the Fed-ECB policy announcement, investors will focus on the preliminary German Harmonized Index of Consumer Prices (HICP) data for April, which will be published at 12:00 GMT. The data is expected to show that the German inflation accelerated to 3% Year-on-Year (YoY) from 2.7% in March.
EUR/USD technical analysis
EUR/USD trades flat at around 1.1700 as of writing. The pair reflects a sideways trend as it remains sticky to the 20-day exponential moving average (EMA), which is at 1.1698, but stays above the 38.2% Fibonacci retracement at 1.1666.
The Relative Strength Index (RSI) shifts into the 40.00-60.00 zone after failing to sustain above 60.00 for longer, which indicates loss of upside momentum, but the upside bias remains intact.
On the topside, immediate resistance emerges at the 50.0% Fibonacci retracement near 1.1745, followed by the 61.8% retracement around 1.1825, with further hurdles at 1.1938 and the cycle high near 1.2082. Looking down, the 38.2% retracement at 1.1666 is the initial support; a break below that area would expose deeper supports at the 23.6% level near 1.1567 and the structural floor around 1.1408.
GBP/USD may appreciate toward the two-month high of 1.3599.
The 14-day Relative Strength Index near 56 signals positive momentum without indicating overbought conditions.
The pair is testing the lower boundary of the ascending channel around 1.3510.
GBP/USD inches higher after registering little losses in the previous day, trading around 1.3520 during the Asian hours on Wednesday. The technical analysis of the daily chart indicates a potential for a bearish reversal as the pair is hovering around the lower boundary of the ascending channel pattern.
However, the GBP/USD pair maintains a modest bullish bias as it holds above the nine-day Exponential Moving Average (EMA) and the 50-day EMA. The clustering of these averages below the spot suggests a supportive backdrop after the recent advance, while the 14-day Relative Strength Index around 56 hints at positive but not overextended momentum, leaving room for further gains while the pair remains under nearby resistance.
The GBP/USD pair may rise toward the primary barrier at the two-month high of 1.3599, recorded on April 17. Further advances would support the pair to explore the region around the upper boundary of the ascending channel near the 1.3869, the highest level since September 2021, reached on January 27.
On the downside, the GBP/USD pair is testing the lower boundary of the ascending channel around 1.3510. aligned with the nine-day EMA of 1.3509. Further support lies at the 50-day EMA at 1.3440. A successful break below this confluence support zone would expose the five-month low of 1.3159, recorded on March 31, followed by the 1.3010, the lowest since April 2025, which was recorded in November 2025.
GBP/USD: Daily Chart
Pound Sterling Price Today
The table below shows the percentage change of British Pound (GBP) against listed major currencies today. British Pound was the strongest against the New Zealand Dollar.
USD
EUR
GBP
JPY
CAD
AUD
NZD
CHF
USD
-0.02%
-0.03%
-0.02%
-0.01%
0.11%
0.14%
-0.11%
EUR
0.02%
-0.03%
0.02%
0.00%
0.11%
0.18%
-0.08%
GBP
0.03%
0.03%
0.02%
0.02%
0.13%
0.18%
-0.07%
JPY
0.02%
-0.02%
-0.02%
-0.01%
0.13%
0.18%
-0.04%
CAD
0.01%
-0.00%
-0.02%
0.01%
0.14%
0.18%
-0.07%
AUD
-0.11%
-0.11%
-0.13%
-0.13%
-0.14%
0.05%
-0.25%
NZD
-0.14%
-0.18%
-0.18%
-0.18%
-0.18%
-0.05%
-0.26%
CHF
0.11%
0.08%
0.07%
0.04%
0.07%
0.25%
0.26%
The heat map shows percentage changes of major currencies against each other. The base currency is picked from the left column, while the quote currency is picked from the top row. For example, if you pick the British Pound from the left column and move along the horizontal line to the US Dollar, the percentage change displayed in the box will represent GBP (base)/USD (quote).
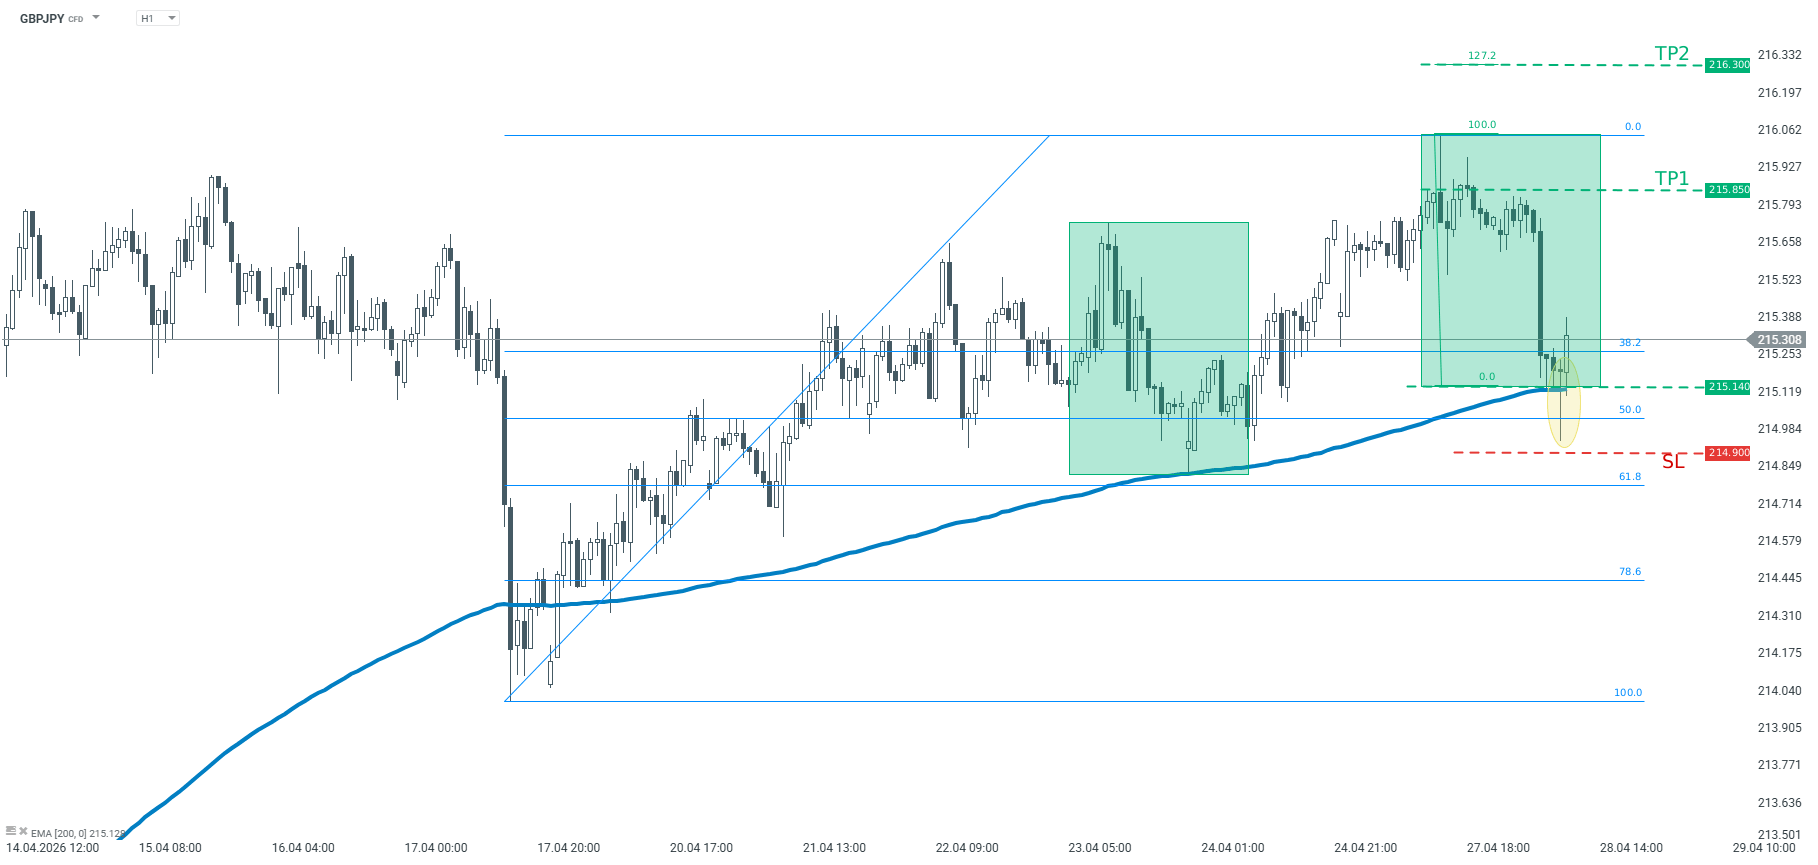
The pair reached the lower limit of 1:1 structure at 215.14 Main trend on the pair remains upward
Recommendation:
Trade: Long GBPJPY at market price Target: 215.85, 216.30 Stop: 214.90
Opinion:
Looking at GBPJPY chart, one can observe that the price reached the key technical support today. This support is marked with the lower limit of 1:1 structure (green rectangles), as well as 200-period moving average. In addition the bullish candlestick pattern – pin bar appeared on the H1 chart. Should buyers manage to hold the price above the support at 215.14, another upward impulse may be on the cards. We recommend taking a long position on GBPJPY at market price with two targets: 215.85 and 216.30 We recommend placing a stop loss order at 214.90.
To provide the best experiences, we use technologies like cookies to store and/or access device information. Consenting to these technologies will allow us to process data such as browsing behavior or unique IDs on this site. Not consenting or withdrawing consent, may adversely affect certain features and functions.
Functional
Always active
The technical storage or access is strictly necessary for the legitimate purpose of enabling the use of a specific service explicitly requested by the subscriber or user, or for the sole purpose of carrying out the transmission of a communication over an electronic communications network.
Preferences
The technical storage or access is necessary for the legitimate purpose of storing preferences that are not requested by the subscriber or user.
Statistics
The technical storage or access that is used exclusively for statistical purposes.The technical storage or access that is used exclusively for anonymous statistical purposes. Without a subpoena, voluntary compliance on the part of your Internet Service Provider, or additional records from a third party, information stored or retrieved for this purpose alone cannot usually be used to identify you.
Marketing
The technical storage or access is required to create user profiles to send advertising, or to track the user on a website or across several websites for similar marketing purposes.