USD/JPY Continues to hold 20-day EMA amid fears of Middle East war escalation

April 6, 2026
  • USD/JPY edges down to near 159.55 as the US Dollar ticks lower.
  • US President Trump promises an assault on Iran if it doesn’t reopen the Strait of Hormuz.
  • Investors await the US ISM Services PMI data for March.

The USD/JPY pair trades marginally down at around 159.55 during the Asian trading session on Monday. The pair shows a subdued performance as the US Dollar (USD) ticks lower, while broadly remaining firm due to threats from United States (US) President Donald Trump that he will destroy Iranian infrastructure if it doesn’t agree to a deal.

During the press time, the US Dollar Index (DXY), which tracks the Greenback’s value against six major currencies, trades marginally lower to near 100.15.

Over the weekend, US President Trump promised “hell” for Iran’s power plants and bridges, through a post on Truth.Social, if Tehran doesn’t reopen the Strait of Hormuz before the deadline, which is Tuesday, April 7, at 9:00 PM Eastern time.

On the macro front, investors await the US ISM Services PMI data for March, which will be released at 14:00 GMT. The Services PMI is expected to arrive lower at 55.0 from 56.1 in February.

Meanwhile, fears of escalating Middle East war have also improved the safe-haven demand of the Japanese Yen (JPY).

USD/JPY technical analysis

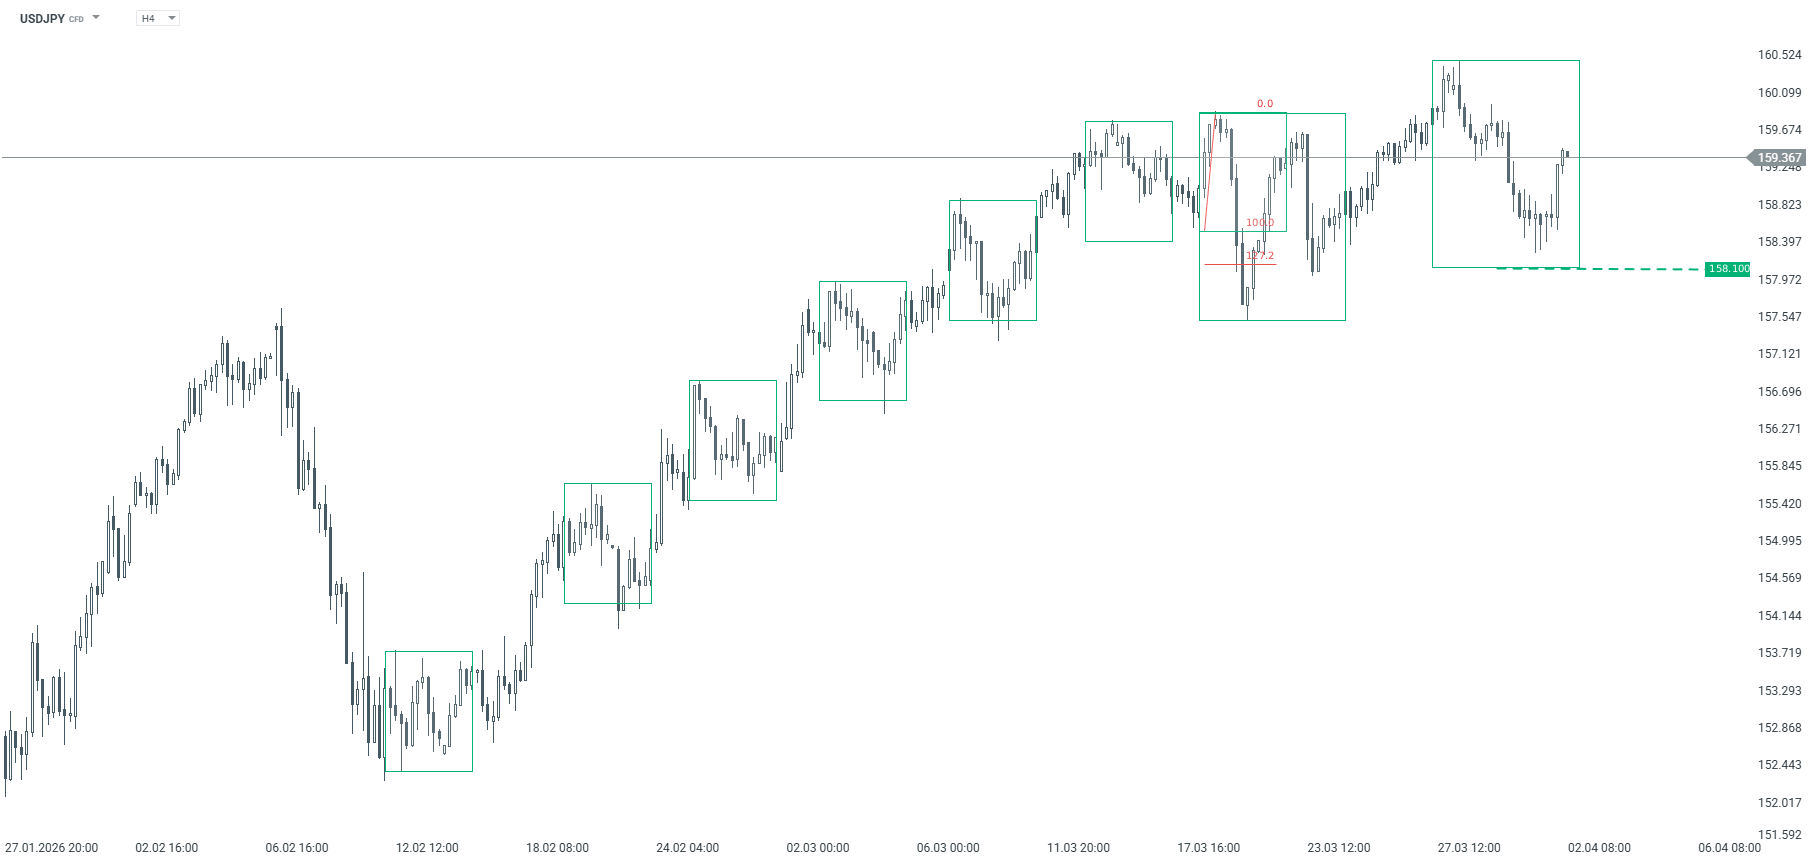
USD/JPY ticks lower at around 159.55 as of writing. However, the near-term bias is bullish as price holds within an ascending channel and consolidates beneath the upper boundary. The pair trades above the 20-day exponential moving average around 158.90, which underpins the advance and aligns with the pattern of higher lows along the channel floor near 158.10.

The 14-day Relative Strength Index (RSI) has shifted into the 40.00-60.00 zone, indicating positive, though not extreme, momentum that supports ongoing upside pressure while the channel structure is respected.

Initial resistance emerges at 160.45, the recent swing high, with the channel top near 161.00 as the next barrier to extended gains. A clear break above the latter would open the way toward higher psychological levels beyond 162.00. On the downside, immediate support is seen at the 20-day EMA near 158.90, ahead of the channel base around 158.10, which defines the lower boundary of the current uptrend. A daily close below 158.10 would weaken the bullish structure and expose deeper retracement levels toward the mid-157.00s.

AUD/USD Price Forecast: Tests nine-day EMA after breaking above 0.6900

April 6, 2026
  • AUD/USD may find the initial support at the 11-week low of 0.6833.
  • The 14-day Relative Strength Index hovers near 43, suggesting mild bullish pressure.
  • The pair tests the immediate barrier at the nine-day EMA of 0.6918.

AUD/USD holds gains after two days of losses, trading around 0.6910 during the Asian hours on Monday. The technical analysis of the daily chart indicates that the pair remains within a descending wedge pattern, suggesting that selling pressure is gradually weakening as lower highs and lower lows converge. This structure often reflects a loss of bearish momentum, increasing the likelihood of a bullish breakout.

However, the 14-day Relative Strength Index (RSI) is around 43, suggesting a bearish bias, with momentum slipping below the midline after failing to sustain earlier strength. Moreover, the near-term bias is bearish as the AUD/USD pair holds below the nine-day Exponential Moving Average (EMA) and the flatter 50-day EMA.

The initial support lies at the 11-week low of 0.6833, which was recorded on March 30, followed by the lower boundary of the descending wedge around 0.6810. A break below the wedge would strengthen the bearish bias and open the doors for the AUD/USD pair to navigate the region around a deeper 0.6400 rebound support zone.

The AUD/USD pair could find the immediate barrier at the nine-day EMA of 0.6918, followed by the 50-day EMA at 0.6958 around the upper boundary of the wedge. A sustained break above this confluence resistance zone would lead the pair to test the 0.7187, the highest since June 2022, reached on March 11.

AUD/USD: Daily Chart

(The technical analysis of this story was written with the help of an AI tool.)

Australian Dollar Price Today

The table below shows the percentage change of Australian Dollar (AUD) against listed major currencies today. Australian Dollar was the strongest against the Swiss Franc.

USDEURGBPJPYCADAUDNZDCHF
USD-0.02%-0.09%-0.05%-0.05%-0.15%-0.14%0.09%
EUR0.02%-0.04%-0.06%0.00%-0.14%-0.14%0.09%
GBP0.09%0.04%-0.02%-0.00%-0.09%-0.10%0.16%
JPY0.05%0.06%0.02%0.02%-0.11%-0.11%0.13%
CAD0.05%-0.00%0.00%-0.02%-0.10%-0.10%0.14%
AUD0.15%0.14%0.09%0.11%0.10%-0.01%0.24%
NZD0.14%0.14%0.10%0.11%0.10%0.01%0.26%
CHF-0.09%-0.09%-0.16%-0.13%-0.14%-0.24%-0.26%

The heat map shows percentage changes of major currencies against each other. The base currency is picked from the left column, while the quote currency is picked from the top row. For example, if you pick the Australian Dollar from the left column and move along the horizontal line to the US Dollar, the percentage change displayed in the box will represent AUD (base)/USD (quote).

Trade of The Day – AUD/JPY

April 3, 2026

Facts: 
Pair bounced off the lower limit of the 1:1 structure at 109.80
The main sentiment remains bullish from April 2025

Recommendation: 
Trade: Long AUDJPY at market price
Target: 113.45
Stop: 108.80

Opinion: Looking at the D1 interval on AUDJPY chart, one can see that the price bounced off the key support. The support is marked with the lower limit of 1:1 structure at 109.80. In addition, the price sits above the 100-period moving average from the D1 interval. Taking this into account, another upward impulse is the base case scenario. We recommend going long AUDJPY at market price with a target of 113.45. We also recommend placing a stop loss order at 108.80. Source: xStation5
 

EUR/GBP Analysis – Euro stalls below the 0.8740 resistance area

April 3, 2026
  • EUR/GBP flatlines around 0.8720 on Friday after bouncing from 0.8700 support.
  • The pair has rallied nearly 1% over the last three weeks, despite the risk-off sentiment.
  • The Euro is likely to require an additional impulse to breach resistance at 0.8740.

EUR/GBP’s reversal from one-month highs at 0.8740 found support above 0.8700 earlier this week, before stalling halfway through the last few days’ range around 0.8720. Technical indicators show waning bullish momentum, while thinned market volumes suggest that further consolidation is the most likely outcome on Friday.

The Euro (EUR) remains on track for a nearly 0.5% weekly gain and is nearly 1% up over the last three weeks. The risk-averse sentiment stemming from the war in Iran has been weighing both currencies against the safe-haven US Dollar (USD). Still, the positive manufacturing activity and the moderate uptick in inflation seen in the Eurozone earlier this week have provided some support to the Euro (EUR), while UK manufacturing PMI failed to convince investors.

Chart Analysis EUR/GBP

Technical Analysis

EUR/GBP’s near-term bias remains mildly bullish, although technical indicators point to a weakening momentum. The 4-hour Relative Strength Index at 58 stays above its midline, but the Moving Average Convergence Divergence (MACD) indicator slips marginally below the zero line, and the MACD line has crossed below the Signal line, which is a bearish sign.

Bears will have to breach Wednesday’s and Tuesday’s lows, at 0.8705 and 0.8676, respectively, to undermine the near-term bullish structure and expose the 0.8630-08635 area, which provided support to the pair on March 23, 24, and 26.

On the upside, bulls are likely to require additional impulse to break resistance at the 0.8740 area (March 3 and April 1 highs), and shift the focus to the key area between 0.8790 and 0.8800, which capped bulls several times in December and early March

Euro Price Today

The table below shows the percentage change of Euro (EUR) against listed major currencies today. Euro was the strongest against the New Zealand Dollar.

USDEURGBPJPYCADAUDNZDCHF
USD-0.02%-0.11%0.00%0.01%-0.12%0.13%-0.08%
EUR0.02%-0.06%0.02%0.03%0.01%0.13%-0.06%
GBP0.11%0.06%0.11%0.08%0.11%0.20%-0.00%
JPY0.00%-0.02%-0.11%0.00%-0.01%0.10%-0.11%
CAD-0.01%-0.03%-0.08%-0.00%-0.01%0.12%-0.09%
AUD0.12%-0.01%-0.11%0.01%0.00%0.12%-0.09%
NZD-0.13%-0.13%-0.20%-0.10%-0.12%-0.12%-0.21%
CHF0.08%0.06%0.00%0.11%0.09%0.09%0.21%

The heat map shows percentage changes of major currencies against each other. The base currency is picked from the left column, while the quote currency is picked from the top row. For example, if you pick the Euro from the left column and move along the horizontal line to the US Dollar, the percentage change displayed in the box will represent EUR (base)/USD (quote).

EUR/JPY Price Gathers strength to near 184.00, bullish bias persists above 100-day EMA

April 3, 2026
  • EUR/JPY edges higher to near 184.15 in Friday’s early European session. 
  • The positive outlook of the cross remains intact above the 100-day EMA, with bullish RSI momentum. 
  • The initial support level is located at 183.50; the first upside barrier emerges at 184.80. 

The EUR/JPY cross gathers strength around 184.15 during the early European session on Friday. Trading volumes are likely to be thin due to the Good Friday holiday. Meanwhile, hawkish remarks from European Central Bank (ECB) policymakers provide some support to the Euro (EUR) against the Japanese Yen (JPY). ECB Governing Council member Francois Villeroy de Galhau said on Thursday that the central bank’s next interest rate move will very likely be an increase, although it is still ‌too early to say when it will start hiking. 

On the other hand, escalations in the Middle East could boost a safe-haven demand, supporting the JPY. US President Donald Trump pressures Iran to make a deal after a military strike destroys a bridge near Tehran. Iran’s foreign minister Abbas Araghchi stated that Washington’s recent strikes on civilian infrastructure will not force the country to back down, adding that such actions “convey the defeat and moral collapse of an enemy in disarray.”

Chart Analysis EUR/JPY

Technical Analysis:

In the daily chart, the near-term bias of EUR/JPY is mildly bullish as price holds above the rising 100-day exponential moving average near 182.10 and consolidates just under the upper Bollinger Band, indicating sustained upside pressure after the recent advance. The Bollinger middle band around 183.50 now tracks below spot and acts as dynamic trend support, while the latest RSI reading just above 54 confirms positive, but not overextended, momentum consistent with a grinding uptrend rather than a climax move.

Immediate support emerges at the 183.50 Bollinger middle band, followed by the 182.50–182.10 area where recent lows converge with the 100-day EMA. A break below this zone would weaken the bullish structure and expose deeper retracement toward 181.50. On the topside, initial resistance stands at the recent upper Bollinger Band region around 184.80, with a daily close above this threshold opening the door toward the 186.00 area where prior band highs cluster and upside risk would intensify.

GBP/USD Rebounds toward 1.3250 near nine-day EMA

April 3, 2026
  • GBP/USD may fall toward the descending channel’s lower boundary around 1.3150.
  • The 14-day Relative Strength Index hovers in the low-40s, indicating weak and negative momentum.
  • The pair may find the primary resistance at the nine-day EMA of 1.3273.

GBP/USD holds gains after registering over 0.5% losses in the previous day, trading around 1.3230 during the Asian hours on Friday. The technical analysis of the daily chart indicates an ongoing bearish bias, as the pair remains within the descending channel pattern.

The near-term bias stays mildly bearish as the GBP/USD pair holds below both the nine-day and 50-day Exponential Moving Averages (EMAs), which cap rebounds and confirm a deteriorating short-term trend. Price action has made a sequence of lower highs and lower closes from the 1.35 area, reinforcing downside pressure.

Additionally, the latest 14-day Relative Strength Index (RSI) hovers in the low-40s, showing negative momentum but not yet oversold, which leaves room for further weakness while limiting the risk of an immediate exhaustion low.

The GBP/USD pair may find its primary support at the descending channel’s lower boundary around 1.3150. A break below the channel would expose the 1.3010, the lowest since April 2025, which was recorded in November 2025.

On the upside, the initial barrier lies at the nine-day EMA of 1.3273. Further advances would lead the GBP/USD pair to test the 50-day EMA at 1.3394, followed by the upper descending channel boundary around 1.3440. A sustained break above this confluence resistance would trigger a bullish bias, opening the doors for exploring the area around the 1.3869, the highest level since September 2021, reached on January 27.

GBP/USD: Daily Chart

(The technical analysis of this story was written with the help of an AI tool.)

Pound Sterling Price Today

The table below shows the percentage change of British Pound (GBP) against listed major currencies today. British Pound was the strongest against the New Zealand Dollar.

USDEURGBPJPYCADAUDNZDCHF
USD-0.00%-0.11%0.00%0.00%-0.13%0.10%-0.05%
EUR0.00%-0.07%0.02%0.00%-0.01%0.09%-0.05%
GBP0.11%0.07%0.11%0.08%0.08%0.17%0.02%
JPY0.00%-0.02%-0.11%-0.01%-0.03%0.07%-0.09%
CAD-0.01%-0.01%-0.08%0.00%-0.01%0.09%-0.06%
AUD0.13%0.01%-0.08%0.03%0.01%0.09%-0.06%
NZD-0.10%-0.09%-0.17%-0.07%-0.09%-0.09%-0.15%
CHF0.05%0.05%-0.02%0.09%0.06%0.06%0.15%

The heat map shows percentage changes of major currencies against each other. The base currency is picked from the left column, while the quote currency is picked from the top row. For example, if you pick the British Pound from the left column and move along the horizontal line to the US Dollar, the percentage change displayed in the box will represent GBP (base)/USD (quote).

Trade of The Day – EUR/USD

April 2, 2026

Facts:

  • The EUR/USD exchange rate failed to close above the 200-day EMA on yesterday’s daily candle
  • The price remains below the 50-, 100-, and 200-day exponential moving averages (EMA)

Recommendation: 

Trade: Short position on the EUR/USD pair at market price

Take Profit 1: 1.14425

Take Profit 2: 1.14115

Stop: 1.16360
 

Opinion:

From a technical perspective, the EURUSD pair remains in a structural downtrend, which is a key argument for maintaining short positions.  The price consistently remains below the 200-, 100-, and 50-day exponential moving averages (EMA), which form dynamic resistance and confirm the dominance of supply over demand in the medium term. Prices are moving within a bearish flag pattern (a trend continuation pattern), and current attempts at a rebound are being stifled by successive resistance levels marked by the downward-sloping EMAs, which technically indicates further potential for the euro-dollar exchange rate to depreciate.

An additional and significant catalyst for the dollar’s strengthening is the escalation of the armed conflict in the Middle East, directly driven by the Trump administration’s actions.  In his Wednesday address to the nation, the president announced that within the next 2–3 weeks, the United States would strike Iran “extremely hard,” promising simultaneous attacks on all Iranian power plants, which—as Trump stated—“will set the country back to the Stone Age.” The escalation of the military operation codenamed “Operation Epic Fury” is generating a classic flight-to-safety effect—primarily toward the dollar—which, combined with the euro-dollar’s technical weakness, creates a consistent environment conducive to the continuation of the downward trend in the EURUSD pair

Methodology and assumptions:
This recommendation is based on a technical analysis of the EURUSD chart. Classical technical analysis was used to assess the situation and analyze the trend. The target level—take profit 1—was set at the level of previous price reactions, using price action methodology. Take profit 2, on the other hand, is based on the location of last month’s local low. The protective stop-loss order was set above the most recent local high using price action methodology.

Currency Talk – USDJPY, NZDUSD, USDCHF

April 2, 2026

The Overbalance analysis aims to identify three financial instruments, analyzed primarily on the daily/four-hour (D1/H4) timeframe. The analysis uses only the Overbalance methodology, which helps determine where a trend may continue or where it may reverse. Today’s analysis covers three instruments, evaluated solely in terms of 1:1 correction structures.

USDJPY
Since February 12, the USDJPY has been trading in a strong uptrend. Initially, the movement was controlled by a 1:1 corrective pattern with a range of approximately 140 pips; however, in mid-March, a deeper correction occurred, after which the market established a new high. As a result, the current largest corrective pattern has a range of approximately 240 pips. At this point, the key support level is 158.10, derived from the lower boundary of this pattern. As long as this level holds, the uptrend remains in place. A break below it, however, could open the way for a larger correction or even a trend reversal.

USDJPY – H4 chart. Source: xStation

NZDUSD
The NZDUSD pair has been trending downward since late January. We are currently seeing an upward corrective move. If the correction continues, the key resistance level remains at 0.5845, where the upper boundary of the 1:1 correction pattern is located. According to the Overbalance methodology, the downtrend remains in effect until this level is negated.

NZDUSD – H4 chart. Source: xStation

USDCHF
Since early January, USDCHF has been in a downtrend. However, an upward correction has been developing since late January, and its range has already exceeded smaller geometric patterns, including the 0.7902 level. Nevertheless, the price has failed to break through the key resistance at 0.8042, where the upper boundary of the largest corrective pattern is located. According to the Overbalance methodology, the downtrend remains in effect until this level is broken. The decline could accelerate after falling below the 0.7902 level, which is the lower boundary of the smaller geometric pattern. Conversely, a break above 0.8042 could lead to a shift to an uptrend.

USDCHF – H4 timeframe. Source: xStation

The material on this page does not constitute financial advice and does not take into account your level of understanding, investment objectives, financial situation or any other specific needs. All information provided, including opinions, market research, mathematical results and technical analyzes published on the Website or transmitted To you by other means, it is provided for information purposes only and should in no way be construed as an offer or solicitation for a transaction in any financial instrument, nor should the information provided be construed as advice of a legal or financial nature on which any investment decisions you make should be based exclusively To your level of understanding, investment objectives, financial situation, or other specific needs, any decision to act on the information published on the Website or sent to you by other means is entirely at your own risk if you In doubt or unsure about your understanding of a particular product, instrument, service or transaction, you should seek professional or legal advice before trading. Investing in CFDs carries a high level of risk, as they are leveraged products and have small movements Often the market can result in much larger movements in the value of your investment, and this can work against you or in your favor. Please ensure you fully understand the risks involved, taking into account investments objectives and level of experience, before trading and, if necessary, seek independent advice.