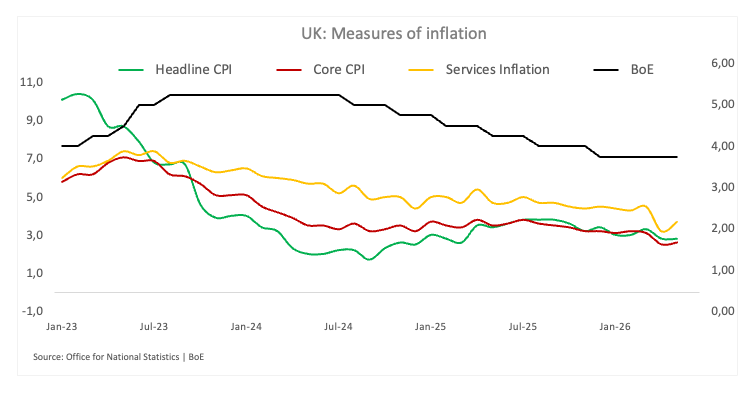
The UK’s ONR Office publishes the June CPI data on Wednesday.
The UK headline CPI is expected to ease toward 2.7% from a year earlier.
Core inflation is also seen easing toward 2.5% over the last 12 months.
The UK Office for National Statistics (ONS) will release the June Consumer Price Index (CPI) figures on Wednesday at 06:00 GMT, a print that will matter for markets. Consensus expectations point to inflation pressures still above the Bank of England’s (BoE) target, although losing further momentum.
UK consumer inflation remains one of the most important inputs for the BoE and typically carries real weight for the British Pound (GBP). Following the latest cautious hold by the BoE on June 18, investors now favour a steady hand by the ‘Old Lady’ at its meeting on July 30.
What to expect from the next UK inflation report?
Headline UK CPI is expected to clock 2.7% in the year to June, a tad lower than the May reading. On a monthly basis, inflation is seen gaining 0.1%, adding to the 0.2% increase recorded the previous month.
Core inflation, which strips out the more volatile food and energy components and is therefore more closely watched by the BoE, is forecast at 2.5% on an annual basis, down a tenth of percent from May.
How will the UK CPI data affect GBP/USD?
The BoE met expectations and kept the bank rate unchanged at 3.75% on June 18. However, the 7–2 vote split carried a slightly more hawkish tone, with Megan Greene joining Huw Pill in supporting a 25-basis-point increase. But the larger message is patience, with policy still firmly in wait-and-see mode and market pricing that reflects that stance.
In his latest comments last week, Governor Andrew Bailey said the renewed hostilities in the Gulf highlighted the instability facing the global economy. Turning to the UK, he argued that the country was supported by both its fiscal framework and monetary policy, while stressing that the central challenge remained economic growth.
Bailey added that the UK’s core banking system was resilient and that debt levels were not overstretched. However, he warned that sustainable economic growth would not be possible without financial stability.
Implied rates currently suggest nearly 43 basis points of tightening by year-end, while consensus sees the central bank keeping its policy rate unchanged at its next gathering on July 30.
Back to technicals, Senior Analyst at FXStreet, Pablo Piovano, notes that the recent multi-week recovery in GBP/USD appears to have encountered some initial hurdle in the 1.3550-1.3560 band near the July tops. “In case bulls regain the upper hand, the next barrier emerges at the May top at 1.3653 (May 11), followed by the YTD ceiling at 1.3868 (January 27),” he adds.
On the downside, Piovano sees initial contention at current yearly lows near 1.3140 (June 24). “Further weakness from here could expose a move toward the November 2025 base at 1.3010 (November 5),” Piovano adds.
Piovano also points out that momentum indicators remain somewhat bullish for now as the Relative Strength Index (RSI) hovers just below 54, while the Average Directional Index (ADX) near 18 suggests the current trend lacks muscle.
EUR/JPY is testing the ascending triangle’s upper boundary near 186.20.
The 14-day Relative Strength Index at 57.48 suggests constructive but not overbought momentum.
The initial support lies at the nine-day EMA at 185.66.
EUR/JPY extends its gains for the second successive day, trading around 186.20 during the Asian hours on Wednesday. The currency cross is retaining a bullish near-term bias as it holds above both the nine-period and 50-period Exponential Moving Averages (EMAs).
The 14-day Relative Strength Index (RSI) at 57.48 suggests constructive but not overbought momentum, reinforcing the scope for further gains as long as price stays above the nearby EMA band.
The daily chart technical analysis shows the currency cross is testing the upper boundary of the ascending triangle around 186.20, suggesting growing bullish momentum and a potential breakout to the upside. A decisive break above the triangle could trigger a powerful bullish continuation, which could expose the all-time high of 187.95, which was recorded on April 17.
On the downside, primary support sits at the nine-day EMA of 185.66, with additional backing at the 50-day EMA of 185.18 and the lower edge of the ascending triangle near 185.10. A sustained break below the triangle pattern would undermine the bullish setup, exposing the EUR/JPY cross to deeper downside toward the five-month low of 181.87, recorded on March 16, and the seven-month low of 180.81.
Euro Price Today
The table below shows the percentage change of Euro (EUR) against listed major currencies today. Euro was the strongest against the Japanese Yen.
USD
EUR
GBP
JPY
CAD
AUD
NZD
CHF
USD
-0.07%
-0.07%
-0.03%
-0.02%
-0.05%
-0.06%
-0.00%
EUR
0.07%
0.00%
0.07%
0.05%
0.00%
0.03%
0.07%
GBP
0.07%
-0.01%
0.04%
0.05%
-0.00%
0.01%
0.06%
JPY
0.03%
-0.07%
-0.04%
0.00%
-0.02%
-0.04%
0.03%
CAD
0.02%
-0.05%
-0.05%
-0.01%
-0.03%
0.02%
0.02%
AUD
0.05%
-0.01%
0.00%
0.02%
0.03%
0.02%
0.05%
NZD
0.06%
-0.03%
-0.01%
0.04%
-0.02%
-0.02%
0.03%
CHF
0.00%
-0.07%
-0.06%
-0.03%
-0.02%
-0.05%
-0.03%
The heat map shows percentage changes of major currencies against each other. The base currency is picked from the left column, while the quote currency is picked from the top row. For example, if you pick the Euro from the left column and move along the horizontal line to the US Dollar, the percentage change displayed in the box will represent EUR (base)/USD (quote).
EUR/JPY may rise toward the ascending triangle’s upper boundary near 186.10.
The 14-day Relative Strength Index is around 53 and signals steady momentum.
The initial support lies at the nine-day EMA at 185.46.
EUR/JPY edges higher after three days of losses, trading around 185.50 during the Asian hours on Tuesday. The currency cross is holding above both the nine-day and 50-day Exponential Moving Averages (EMAs), which reinforces a mildly bullish near-term bias.
The EUR/JPY cross is pressing into the upper end of its recent range while the 14-day Relative Strength Index (RSI) around 53 suggests constructive but not overstretched momentum. The daily chart technical analysis shows the currency cross is remaining within the ascending triangle, signalling aggressive buying pressure.
The EUR/JPY cross may find the initial resistance at the triangle’s upper boundary around 186.10. A decisive break above the triangle could trigger a powerful bullish continuation, which could expose the all-time high of 187.95, which was recorded on April 17.
On the downside, immediate support sits at the nine-day EMA of 185.46, with additional backing at the 50-day EMA of 185.12 and the lower edge of the ascending triangle near 185.00. A breakdown below the triangle pattern would undermine the bullish setup, exposing the EUR/JPY cross to deeper downside toward the March 16 five-month low of 181.87 and the seven-month low of 180.81.
EUR/JPY: Daily Chart
Euro Price Today
The table below shows the percentage change of Euro (EUR) against listed major currencies today. Euro was the strongest against the Japanese Yen.
USD
EUR
GBP
JPY
CAD
AUD
NZD
CHF
USD
-0.04%
-0.08%
0.00%
-0.01%
-0.16%
-0.41%
0.00%
EUR
0.04%
-0.04%
0.06%
0.03%
-0.10%
-0.37%
0.04%
GBP
0.08%
0.04%
0.11%
0.08%
-0.05%
-0.33%
0.09%
JPY
0.00%
-0.06%
-0.11%
-0.01%
-0.15%
-0.43%
0.00%
CAD
0.00%
-0.03%
-0.08%
0.01%
-0.14%
-0.40%
0.01%
AUD
0.16%
0.10%
0.05%
0.15%
0.14%
-0.27%
0.14%
NZD
0.41%
0.37%
0.33%
0.43%
0.40%
0.27%
0.41%
CHF
-0.01%
-0.04%
-0.09%
-0.00%
-0.01%
-0.14%
-0.41%
The heat map shows percentage changes of major currencies against each other. The base currency is picked from the left column, while the quote currency is picked from the top row. For example, if you pick the Euro from the left column and move along the horizontal line to the US Dollar, the percentage change displayed in the box will represent EUR (base)/USD (quote).
EUR/USD struggles to gain any meaningful traction as traders keenly await the crucial ECB meeting.
Reviving inflation fears bolster Fed hike bets and underpin the USD, capping the upside for the pair.
Last week’s failure near the 200- SMA on H4 favors bears and backs the case for further depreciation.
The EUR/USD pair is seen consolidating during the Asian session on Tuesday and trading just above the 1.1400 mark, or a four-day low touched the previous day. Market participants seem hesitant and keenly await the highly-anticipated European Central Bank (ECB) meeting on Thursday before positioning for the next leg of a directional move.
In the meantime, energy-driven inflation fears bolster US Federal Reserve (Fed) rate hike bets and support the US Dollar (USD) amid escalating US-Iran tensions. This could act as a headwind for the EUR/USD pair, warranting caution before confirming that the recent pullback from a four-week high, touched last Wednesday, has run its course.
Spot prices keep a bearish tone following last week’s failure near the 1.1480-1.1485 region, which coincides with the 200-period Simple Moving Average (SMA). Moreover, the Moving Average Convergence Divergence (MACD) indicator remains below zero with a negative reading, while the Relative Strength Index (RSI) at 40.95 stays under the midline.
Momentum indicators together suggest waning bullish momentum and reinforce the downside bias while the EUR/USD pair remains capped beneath the 200-period SMA. This, in turn, backs the case for an eventual break below the 1.1400 round figure and a further decline towards retesting the year-to-date low, around the 1.1325 region, touched on June 24.
On the topside, initial resistance is located at the 200-period SMA around 1.1480. A sustained move above this level is needed to ease the current bearish pressure and open the way for a more constructive outlook. Nevertheless, the sub-50 RSI and negative MACD suggest that the path of least resistance for the EUR/USD pair remains to the downside.
AUD/JPY gains traction to near 113.85 in Tuesday’s early European session.
The cross maintains a constructive tone above the 100-day SMA, with bullish RSI momentum.
The immediate resistance level emerges at 114.10; the first downside target to watch is 113.10.
The AUD/JPY cross trades in positive territory around 113.85 during the early European session on Tuesday. The Australian Dollar (AUD) strengthens against the Japanese Yen (JPY) due to the interest rate differential between the Reserve Bank of Australia (RBA) and the Bank of Japan (BoJ). However, fears of possible intervention from Japanese authorities might cap the upside for the cross.
After delivering three consecutive 25 basis points (bps) hikes earlier this year, the Reserve Bank of Australia (RBA) decided to hold the Official Cash Rate (OCR) steady at 4.35% at its June policy meeting.
Economists warned that rising oil and fuel prices could cement a fourth interest rate rise this year if US President Donald Trump’s renewed conflict with Iran is not resolved within a week.
Traders have raised their bets on an RBA rate hike since airstrikes resumed last week, now pricing in nearly a 23% odds of a hike in August and more than a 50% chance by December, according to the Guardian.
Technical Analysis:
In the daily chart, AUD/JPY holds a bullish near-term bias as it remains above the 100-day simple moving average (SMA) and the Bollinger Bands’ 20-day middle band, keeping the broader uptrend intact. Price is advancing toward the Bollinger upper band, while the Relative Strength Index (14) around 60 suggests firm but not overstretched upside momentum.
On the topside, immediate resistance aligns with the Bollinger Bands’ upper band at 114.10. The next hurdle is located at the May 13 high of 114.74, en route to the 115.00 psychological level.
On the downside, initial support is seen at the July 20 low of 113.10. The next contention level to watch is the 100-day SMA at 112.75, followed by the Bollinger middle band at 112.55, with a deeper cushion coming in at the lower band near 111.05 should a corrective pullback develop.
USD/CAD builds on the previous day’s solid recovery from an over one-month trough.
The fundamental backdrop favors bullish traders and backs the case for further gains.
A move beyond the 1.4100 confluence is needed to reaffirm the constructive setup.
The USD/CAD pair attracts buyers for the second straight day on Tuesday and recovers further from its lowest level since June 17, around the 1.4000 psychological mark touched the previous day. Spot prices advanced to a one-week high during the Asian session, though the intraday move up stalls ahead of the 1.4100 mark amid mixed fundamental cues.
The soft Canadian consumer inflation figures on Monday reaffirmed bets that the Bank of Canada (BoC) will keep interest rates unchanged through the remainder of 2026. This marks a significant divergence in comparison to expectations that the US Federal Reserve (Fed) will raise borrowing costs at least once in 2026 amid concerns about energy-driven inflation. Apart from this, US President Donald Trump’s new tariff of 50% on Canadian products undermines the Canadian Dollar (CAD) and acts as a tailwind for the USD/CAD pair.
Meanwhile, hawkish Fed expectations and an escalation of tensions between the US and Iran continue to act as a tailwind for the safe-haven US Dollar (USD). This is seen as another factor supporting the currency pair. That said, elevated oil prices, bolstered by the closure of the Strait of Hormuz, hold back traders from placing aggressive bearish bets on the commodity-linked Loonie and cap gains for the USD/CAD pair. Nevertheless, the broader fundamental backdrop suggests that the path of least resistance for spot prices is to the upside.
From a technical perspective, the overnight breakout through the 23.6% Fibonacci retracement level of the recent pullback from the highest level since April 2025 favors bullish traders. Furthermore, the Moving Average Convergence Divergence (MACD) is turning positive, and the Relative Strength Index (RSI) is hovering around 56. Momentum indicators together hint at recovering upside pressure. That said, it will still be prudent to wait for a move beyond the 1.4100 confluence before positioning for any further near-term appreciation.
The said handle comprises the 38.2% Fibo. level and the 200-period Simple Moving Average (SMA) on the 4-hour chart, above which the USD/CAD pair could climb to the 50.0% retracement at 1.4126 and the 61.8% level at 1.4155. On the downside, support emerges at the 23.6% retracement near 1.4059, with a more substantial structural floor at the Fibonacci anchor around 1.4000, where a deeper pullback could pause if selling pressure resumes.
USD/CAD 4-hour chart
Canadian Dollar Price This week
The table below shows the percentage change of Canadian Dollar (CAD) against listed major currencies this week. Canadian Dollar was the strongest against the Swiss Franc.
USD
EUR
GBP
JPY
CAD
AUD
NZD
CHF
USD
0.09%
0.09%
0.10%
0.40%
-0.59%
-0.50%
0.21%
EUR
-0.09%
0.01%
-0.06%
0.31%
-0.67%
-0.60%
0.11%
GBP
-0.09%
-0.01%
-0.07%
0.30%
-0.65%
-0.61%
0.15%
JPY
-0.10%
0.06%
0.07%
0.39%
-0.64%
-0.65%
0.22%
CAD
-0.40%
-0.31%
-0.30%
-0.39%
-0.94%
-1.03%
-0.15%
AUD
0.59%
0.67%
0.65%
0.64%
0.94%
0.07%
0.84%
NZD
0.50%
0.60%
0.61%
0.65%
1.03%
-0.07%
0.76%
CHF
-0.21%
-0.11%
-0.15%
-0.22%
0.15%
-0.84%
-0.76%
The heat map shows percentage changes of major currencies against each other. The base currency is picked from the left column, while the quote currency is picked from the top row. For example, if you pick the Canadian Dollar from the left column and move along the horizontal line to the US Dollar, the percentage change displayed in the box will represent CAD (base)/USD (quote).
The USDJPY market currently resembles another round of a fight between two heavyweight contenders. On one side stands the dollar, supported by high US asset yields and the ongoing advantage in interest rates. On the other side stands the yen, which despite the Bank of Japan beginning the process of monetary policy normalization, remains under pressure. Japan has taken the first step away from its ultra-loose monetary policy, but the gap between interest rate levels in the United States and Japan remains extremely wide. This difference continues to be the main argument supporting the dollar. At the same time, USDJPY is trading at levels that are attracting increased attention from speculators and Japanese authorities.
Today’s holiday in Japan means lower market liquidity, and such conditions often increase the risk of sharp price movements. Tokyo has been signaling for months that it will not tolerate excessive yen volatility, meaning markets must continue to account for the possibility of direct intervention. USDJPY currently resembles a fight in which the dollar continues to score points thanks to its fundamental advantage, but every additional move higher increases the risk of a response from Japan.
Source: xStation5
The key factors currently shaping USDJPY1. Japan and the risk of currency intervention
The most important psychological factor for the USDJPY market remains the possibility of direct action from Japanese authorities. Japan’s Ministry of Finance has been monitoring developments in the currency market for months and has repeatedly emphasized that excessive yen volatility may require action. The issue is not only the absolute level of USDJPY, but above all the speed of the move. History shows that Japan has typically reacted when yen weakness became too rapid and started affecting expectations among businesses and households. Tokyo understands that an excessively weak currency increases the cost of imported energy and raw materials, making the fight against inflation more difficult. Today’s holiday in Japan adds another layer of attention to the market. With liquidity reduced, even smaller capital flows can generate larger moves in exchange rates. For authorities, such conditions could create a situation where a potential intervention would have a stronger psychological impact. At the same time, Japan needs to remain patient. Using foreign currency reserves too quickly could produce only a short-term effect if fundamentals continue to favor the dollar. Tokyo needs the right moment, when the market is most vulnerable to a change in direction.
2. Interest rate differentials remain the main argument supporting the dollar
The most important fundamental factor for USDJPY remains the difference between monetary policy in the United States and Japan. The Bank of Japan has started raising interest rates, but the path toward a more restrictive policy will likely remain very gradual. The Federal Reserve, meanwhile, continues to maintain rates at elevated levels, while investors continue to assess when and how quickly the Fed may begin a rate-cutting cycle. For the currency market, the key factors are not only current interest rate levels but also bond yields and expectations regarding future monetary policy. If the Fed maintains a cautious approach and continues limiting expectations for rapid policy easing, the dollar may remain supported. Even with lower inflation in the United States, dollar strength can persist as long as real interest rates remain attractive for investors. Japan faces a different challenge. The Bank of Japan must balance the need to normalize monetary policy with the risk of weakening economic growth. Moving too quickly with rate increases could hurt the economy, which is why the tightening process remains cautious.
3. Middle East tensions and oil prices increase pressure on the yen
Another factor influencing USDJPY remains the geopolitical situation in the Middle East. The intensifying conflict in the Persian Gulf has increased the importance of the oil market and the risk of disruptions to energy supplies. Rising oil prices can affect currencies through several channels. The first channel is inflation. Higher energy costs make further declines in price pressures more difficult and may limit the room available for central banks to ease monetary policy. The second channel is related to security. During periods of heightened uncertainty, investors often move capital toward the dollar as the world’s primary reserve currency. This provides additional support for the US currency during periods of increased risk. The situation is particularly challenging for Japan, as the country remains a major energy importer. Higher oil prices can worsen the trade balance and increase costs throughout the economy. As a result, geopolitical developments may currently work against the yen, despite the fact that the Japanese currency has historically benefited during periods of elevated risk aversion.
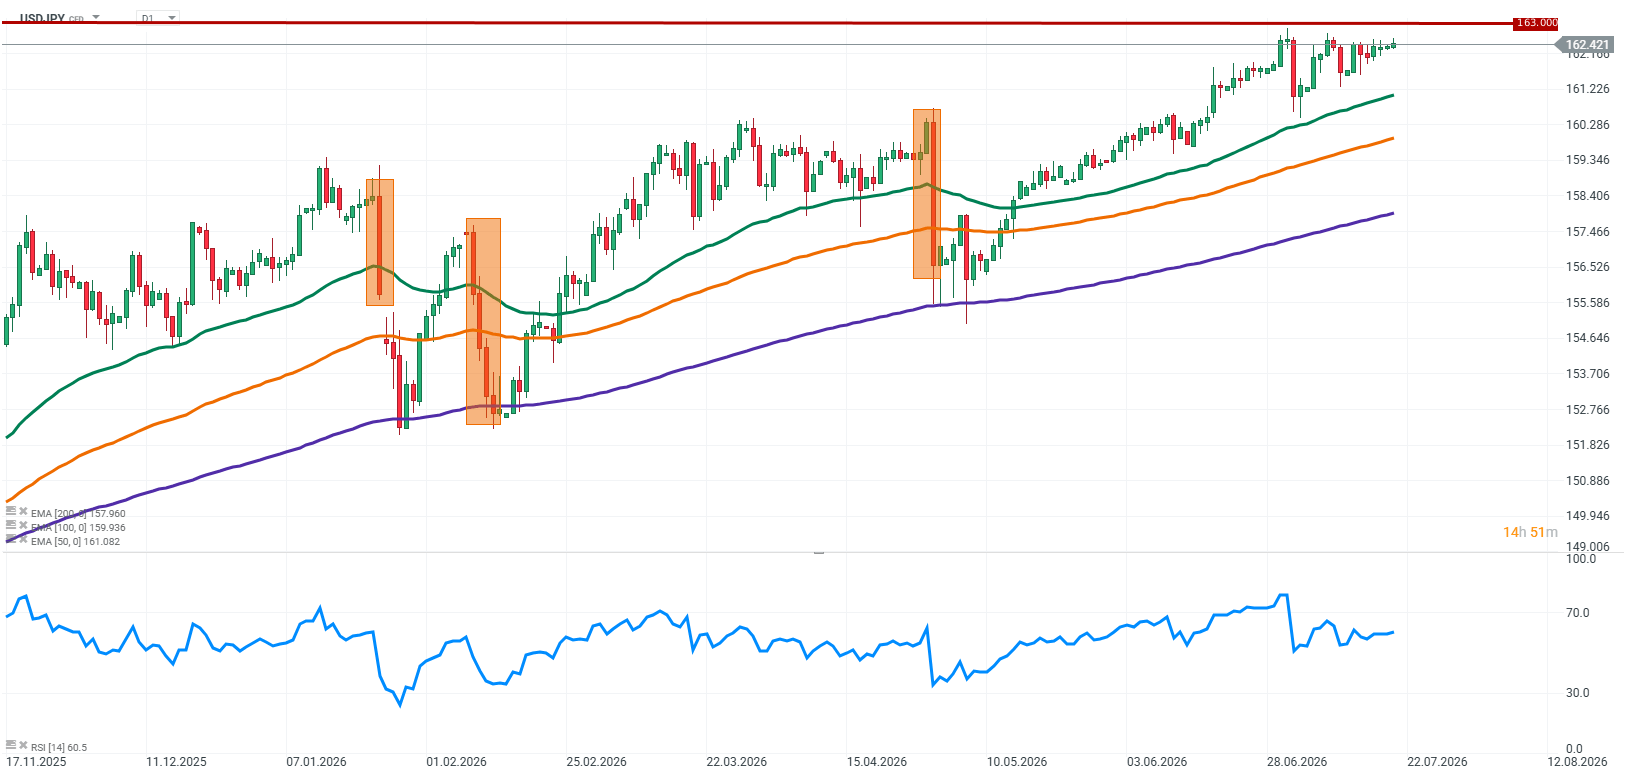
USDJPY: The Dollar Still Leads, but Japan Remains in the Fight
The current situation in USDJPY is the result of several overlapping factors that are pushing the market in different directions. The dollar continues to benefit from the interest rate advantage and high US Treasury yields. Despite softer inflation data, the Federal Reserve remains cautious about starting a rapid easing cycle, which limits pressure on the US currency. Japan, meanwhile, remains in a difficult position. The Bank of Japan has started changing the direction of monetary policy, but the pace of normalization remains slow. At the same time, every additional decline in the yen increases pressure on the Ministry of Finance, which must consider the economic costs of an excessively weak currency. From a technical perspective, the pair remains in an uptrend and continues to trade within an ascending channel. The RSI indicator remains in positive territory but has not yet reached extreme overbought levels, suggesting that buying pressure remains present. The key question for the market is whether the dollar’s fundamental advantage will be strong enough to overcome the growing risk of Japanese intervention.
Key Takeaways
USDJPY remains one of the most important currency pairs due to the combination of strong fundamentals and the possibility of political action from Japan.
The interest rate differential between the US and Japan remains the main argument supporting the dollar.
The Bank of Japan has started the process of monetary policy normalization, but the pace of change remains significantly slower than in the United States.
Today’s holiday in Japan increases market attention toward the possibility of intervention during a period of reduced liquidity.
Middle East tensions and rising oil prices may add further pressure on the yen through the energy channel while increasing demand for the dollar as a safe-haven currency.
Technically, USDJPY remains in an uptrend, but levels near historical highs increase the risk of a sharp market reaction.
USDJPY is currently at a very interesting point. The dollar continues to score points thanks to its fundamental advantage, but every additional move higher increases the importance of Japan as a contender capable of changing the course of the entire fight at the right moment.
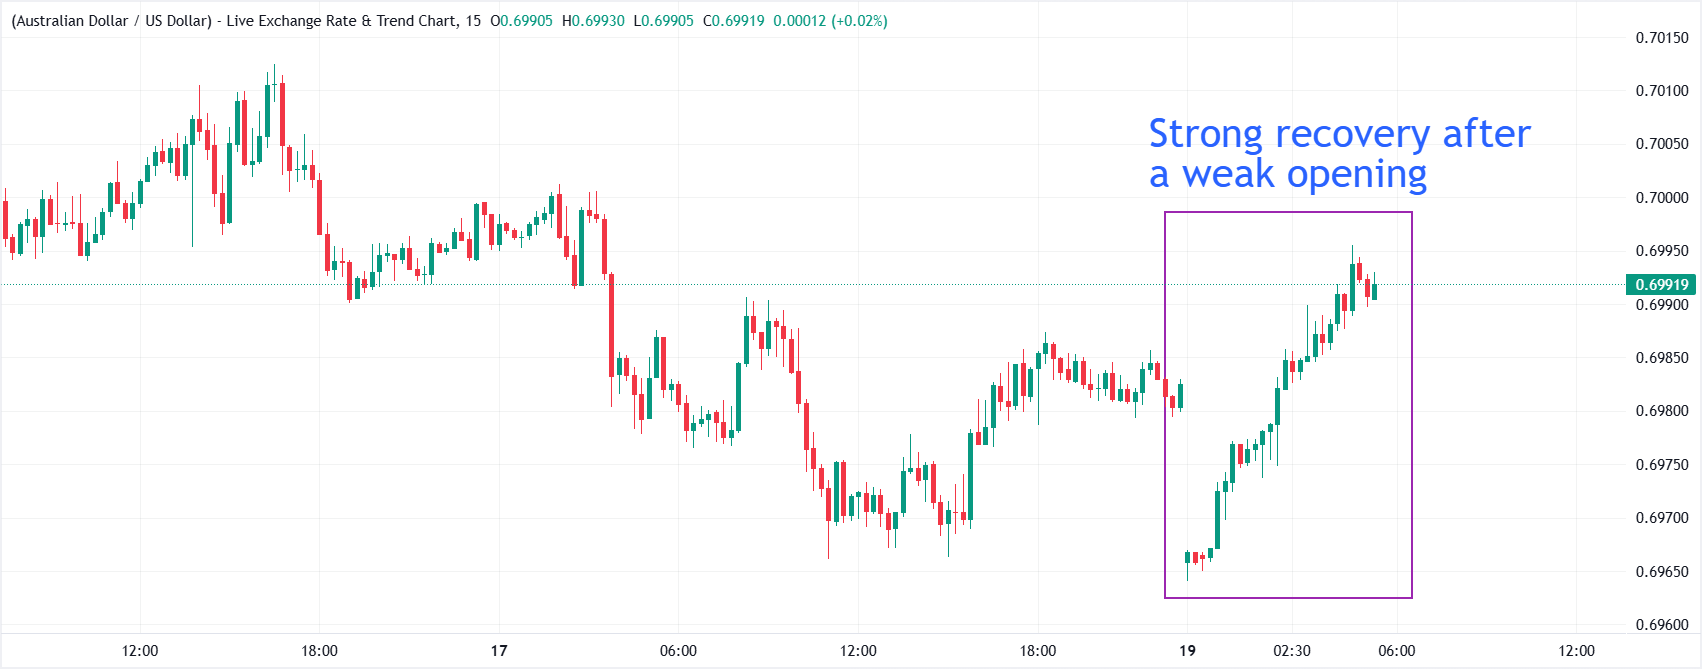
AUD/USD rises to near 0.6995 after a weak opening.
The Fed is highly anticipated to leave interest rates unchanged in the policy meeting later this month.
Soft US CPI data for June forced traders to pare hawkish Fed bets.
The Australian Dollar (AUD) trades 0.12% higher to near 0.6995 against the US Dollar (USD) during the Asian trading session on Monday. The AUD/USD pair bounces back after a weak opening, as the US Dollar faces selling pressure amid intensified expectations that the Federal Reserve (Fed) will not hike interest rates in the policy meeting later this month.
At press time, the US Dollar Index (DXY), which gauges the Greenback’s value against six major currencies, trades marginally lower around 100.70. The USD Index fell sharply after a strong opening move.
According to the CME FedWatch tool, the odds of the Fed leaving interest rates unchanged in the July meeting are 85.6%, up from 65.8% recorded last week. Market participants turned confident that the Fed will maintain the status quo in the July meeting after the release of the United States (US) Consumer Price Index (CPI) data for June, which showed that inflationary pressures cooled down.
On the Australian Dollar front, the currency outperforms its major peers, following the People’s Bank of China’s (PBOC) monetary policy announcement, in which it left Prime Lending Rates (PLRs) unchanged.
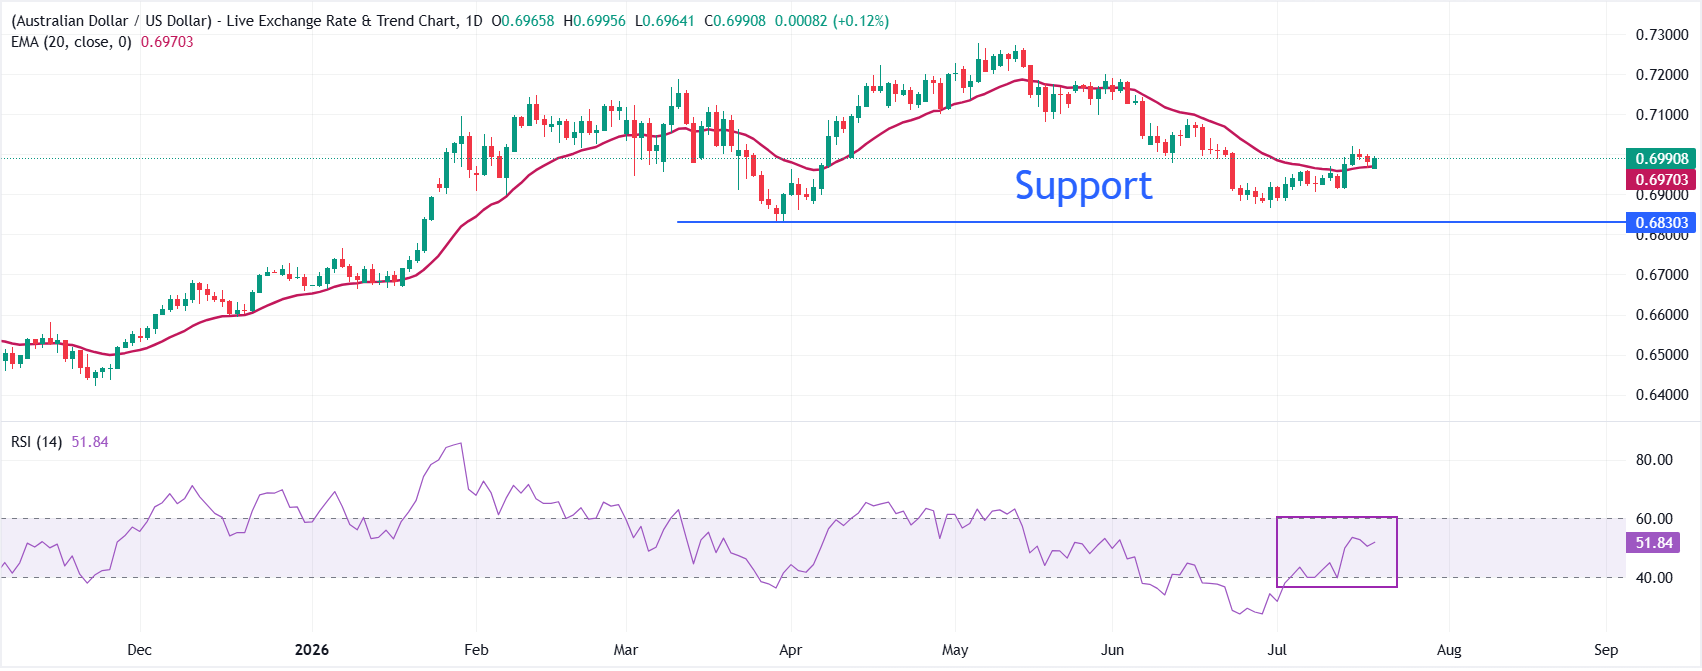
AUD/USD technical analysis
AUD/USD trades higher at around 0.6990 at press time, holding a modestly bullish near-term bias as it extends above the 20-day exponential moving average (EMA) at 0.6970. The pair has reclaimed this short-term trend indicator after its late-June weakness, while the Relative Strength Index (14) at 51.8 sits just above the neutral line, suggesting stabilizing upside momentum rather than aggressive buying pressure.
On the downside, immediate support is located at the 20-day EMA near 0.6970, which is likely to act as the first line of defence on any pullback, followed by the recent price troughs below 0.6950 if sellers regain control. Below 0.6950, the March 30 low at 0.6874 will be the key support level. As long as spot holds above the 0.6970 region on a daily closing basis, the technical tone should remain mildly constructive. Looking up, the pair could extend its advance towards 0.7100 if it manages to break above the July 15 high at 0.7021.
To provide the best experiences, we use technologies like cookies to store and/or access device information. Consenting to these technologies will allow us to process data such as browsing behavior or unique IDs on this site. Not consenting or withdrawing consent, may adversely affect certain features and functions.
Functional
Always active
The technical storage or access is strictly necessary for the legitimate purpose of enabling the use of a specific service explicitly requested by the subscriber or user, or for the sole purpose of carrying out the transmission of a communication over an electronic communications network.
Preferences
The technical storage or access is necessary for the legitimate purpose of storing preferences that are not requested by the subscriber or user.
Statistics
The technical storage or access that is used exclusively for statistical purposes.The technical storage or access that is used exclusively for anonymous statistical purposes. Without a subpoena, voluntary compliance on the part of your Internet Service Provider, or additional records from a third party, information stored or retrieved for this purpose alone cannot usually be used to identify you.
Marketing
The technical storage or access is required to create user profiles to send advertising, or to track the user on a website or across several websites for similar marketing purposes.