The British pound is regaining momentum at the end of the week, driven by a stronger-than-expected batch of UK economic data.
This surprise surge in retail sales successfully halted sterling’s broad decline against most G10 currencies. Leading the recovery is the GBP/CHF pair, which broke cleanly above key moving averages to cement the pound’s robust positioning across Europe this Friday.
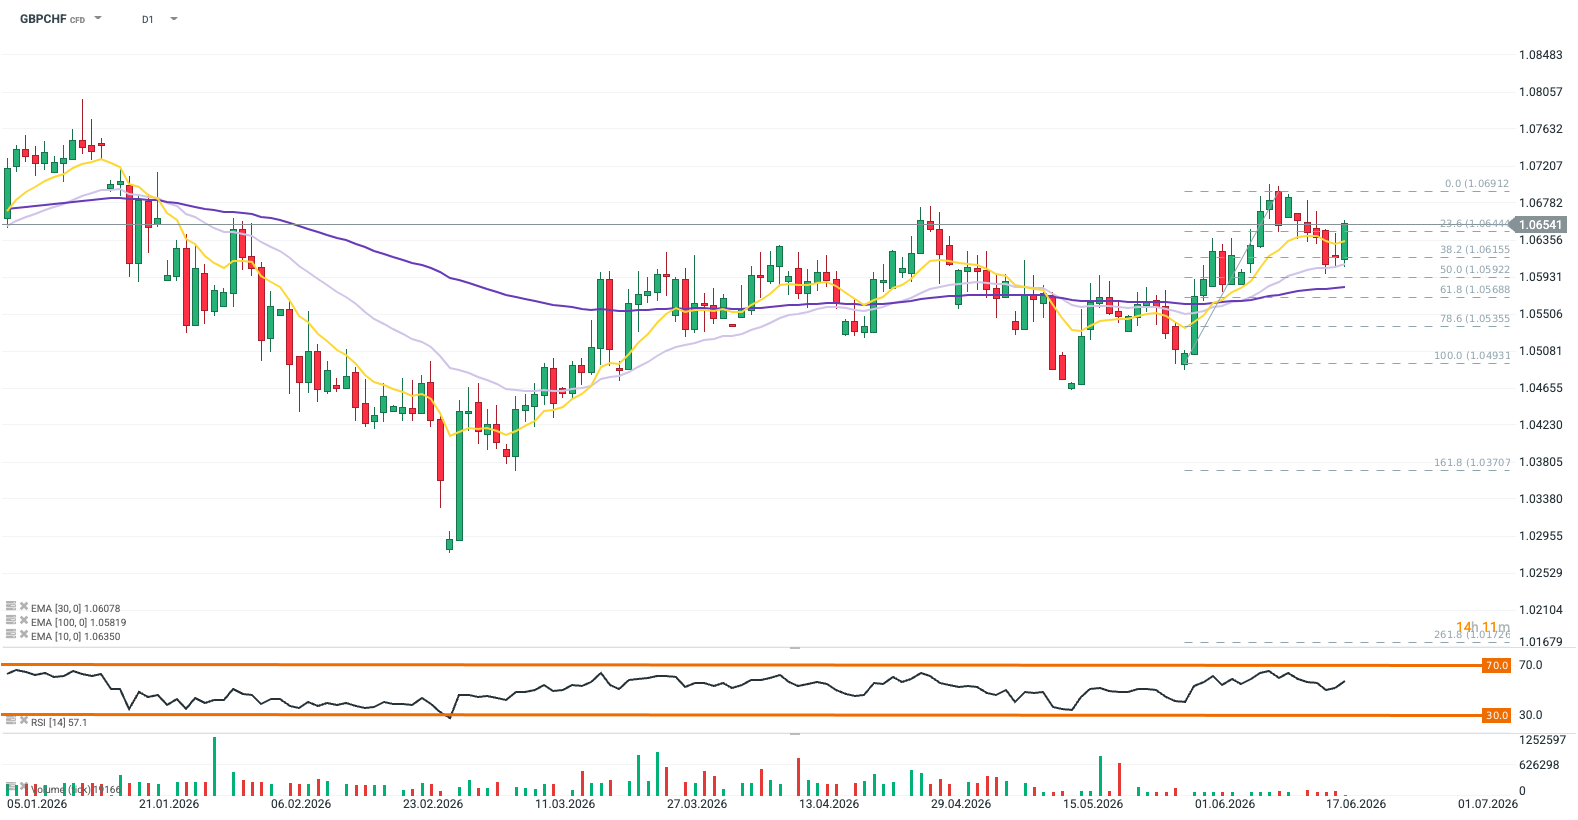
GBPCHF is exhibiting a bullish outlook, rebounding firmly to 1.0651 after finding support near the 38.2% Fibonacci level. The pair trades cleanly above its 10, 30, and 100-day EMAs, saving the upward trend. With the RSI at 56.7, there is plenty of room for further gains toward recent local highs. Source: xStation5
What’s Driving GBPCHF Today?
Sales Surprise on the Upside: Driven by the joint-third warmest May on record and retail promotions, UK retail sales volumes jumped 1.2% in May 2026, bouncing back from a 1.0% decline in April. This growth significantly outperformed economists’ forecasts, with annual sales rising 3.2%. Department and online stores performed particularly well, boosting the online sales share to 28.8%, though overall volumes still remain 0.4% below their pre-pandemic February 2020 levels.
Fragile Trend Sustainability: Over the three months to May 2026, sales volumes edged up 0.4%, supported by strong demand for tech products and outdoor items. However, long-term consumer confidence remains fragile. Shoppers are showing caution regarding big-ticket purchases due to cost-of-living pressures and geopolitical uncertainty surrounding the conflict in Iran. Major supermarket groups like Tesco and Morrisons have already noted a distinct slowdown in sales growth since this conflict began.
Burnham’s Turning Point: Greater Manchester Mayor Andy Burnham’s decisive parliamentary victory in Makerfield has cleared the way for a potential challenge against the deeply unpopular Prime Minister Keir Starmer, threatening fresh political instability in the UK. Positioned as a prime minister-in-waiting and heavily favored by party members, Burnham’s win severely weakens Starmer—who already faces resignation calls from a quarter of his lawmakers—and sets the stage for a high-stakes battle over the future direction of the Labour government.
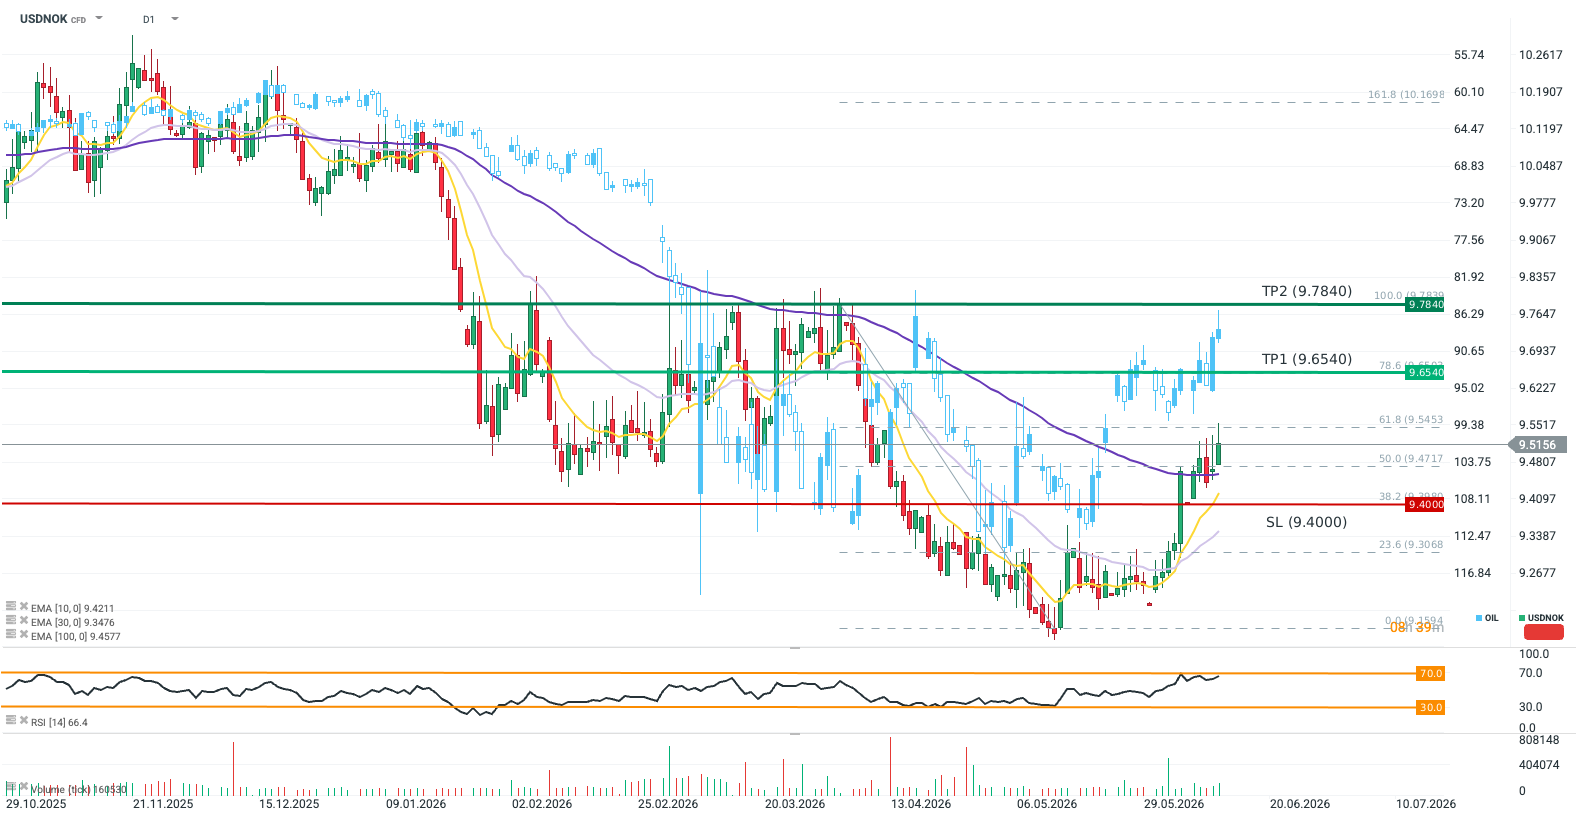
The USDNOK exchange rate ended yesterday’s session above the 100-day exponential moving average (EMA100; purple).
Brent crude oil futures (OIL) are losing ground for the second consecutive session, slipping below 90 USD per barrel—their lowest level since April 20, 2026.
CPI inflation in Norway fell to 3.1% in May from 3.4% in April.
USDNOK is gaining momentum, increasingly solidifying a trend reversal on a pair whose volatility in recent months was primarily shaped by upward pressure on oil prices. Over the past two weeks, the price crossed three exponential moving averages (the 10-, 30-, and 100-day EMA; yellow, light purple, and dark purple, respectively) and successfully defended support where the EMA100 overlaps with the 50.0 Fibonacci retracement level of the latest downward wave. This technical bullish momentum is also well-supported by geopolitical and macroeconomic realities. Fluctuations in the Trump administration’s stance toward Iran did not trigger significant volatility (by recent months’ standards) in oil contracts, and the cancellation of an attack planned for yesterday contributed to a sharp drop in commodity prices.
This suggests that, for the market, the worst regarding the Strait of Hormuz is already behind us, thereby causing the risk premium for oil-producing countries’ currencies to fade out. Alongside the correlation between the Norwegian krone and oil, the latest inflation reading from Norway indicated a second consecutive drop in CPI, with economists forecasting a further decline in price pressure—particularly in the food sector, which is vital for households and their expectations. Meanwhile, in the US, hawkish expectations are mounting for the Fed (OIS curve imlies 73% chance for a hike bedore the end of 2026), benefiting the greenback. Therefore, the monetary policy trajectories of both economies consistently support a continuation of the upward move in USDNOK. A short-term risk remains the near-overbought condition of the pair. The RSI sits right below the 70-point threshold (currently at 66.4), which may discourage investors from pushing the exchange rate higher without a minor technical correction.
Methodology
The recommendation was prepared based on a technical analysis of the USDNOK chart and a fundamental analysis of the discussed economies (monetary policy in Norway and the US), as well as the exchange rate’s correlation with crude oil prices. The direction of the recommendation was determined using moving averages and market expectations regarding Fed policy. The Take Profit and Stop Loss levels were set using Fibonacci retracements and price action (TP1 and TP2 at the 78.6 and 100 Fibo levels of the last downward wave; SL at the 38.2 Fibo level).
Monday’s rise in energy commodity prices proved short-lived, weighing further on the Norwegian currency. The USDNOK pair is approaching the 9.50 level, which was last seen two months ago. Aside from headlines coming out of the Middle East, tomorrow’s scheduled releases of May inflation data from both Norway and the US should take center stage for the pair.
Geopolitics
The weekend exchange of fire between Israel and Iran has cast doubt on the fragile ceasefire currently in place across the region. Under pressure from Washington, both sides halted further strikes. However, the situation remains highly uncertain, which could sustain high volatility in the prices of key energy commodities.
Macroeconomic Data
Tomorrow’s readings are expected to show core inflation remaining unchanged at 3.2%, alongside a slight decline in the headline figure to 3.1% in Norway. An upside surprise could raise expectations for further monetary policy tightening by Norges Bank. As a reminder, the central bank delivered its first interest rate hike since 2023 back in May, reacting to rapidly rising inflation expectations, persistently elevated wage growth, and the concerning stickiness of core inflation. Meanwhile, the headline CPI figure in the United States is expected to edge upward to 4.2%. The consensus also forecasts a modest increase in the core metric to 2.9%. Investors have already fully priced in a Fed rate hike for 2026. A further build-up of price pressures could increase the likelihood of this hike occurring as early as this autumn.
Technical Analysis
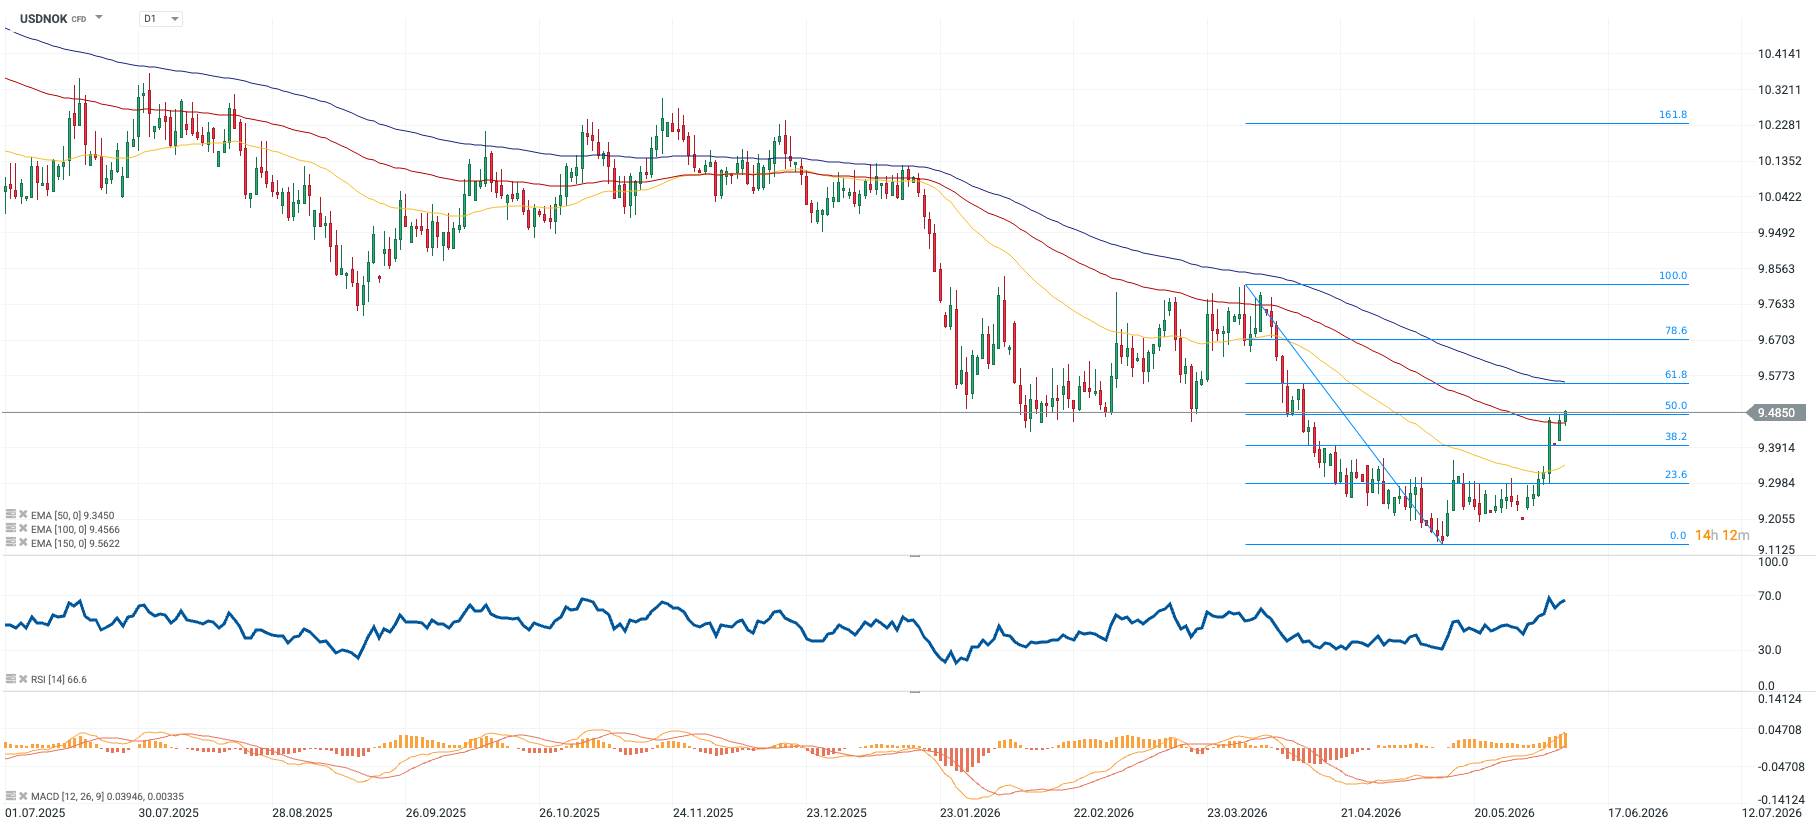
Chart 1: USDNOK (01.07.2025 – 09.06.2026)
Source: xStation, 09.06.2026
After establishing a new local low at the 9.13 level, a strong and aggressive demand-driven rebound ensued. The first two key technical resistance levels have been broken. The price has approached the 50% Fibonacci retracement level, which could serve as a crucial test for the ongoing upward trend. The strong momentum of the move is reflected in technical indicators. The RSI is currently hovering around 67 points, signaling that the market is gradually entering overbought territory, which could trigger a temporary pause in momentum.
Key Levels to Watch:
To the Upside: If buyers manage to sustain the price above the tested 50% Fibo level, the next natural target for the market could be the 9.56 level, where both the 61.8% Fibonacci retracement and the 100 EMA coincide.
To the Downside: Conversely, a sustained rejection of the current resistance level would mean anticipating a return to the primary trend and a retest of lower support levels.
The EUR/USD pair failed to rally despite stronger-than-expected Eurozone inflation data, suggesting that investors remain cautious about the euro’s strength amid mixed economic signals from the region. On one hand, inflation pressures appear to be re-emerging, while on the other, cyclical sectors such as manufacturing continue to show weakness, and the labor market is displaying increasingly concerning signs of slowing momentum.
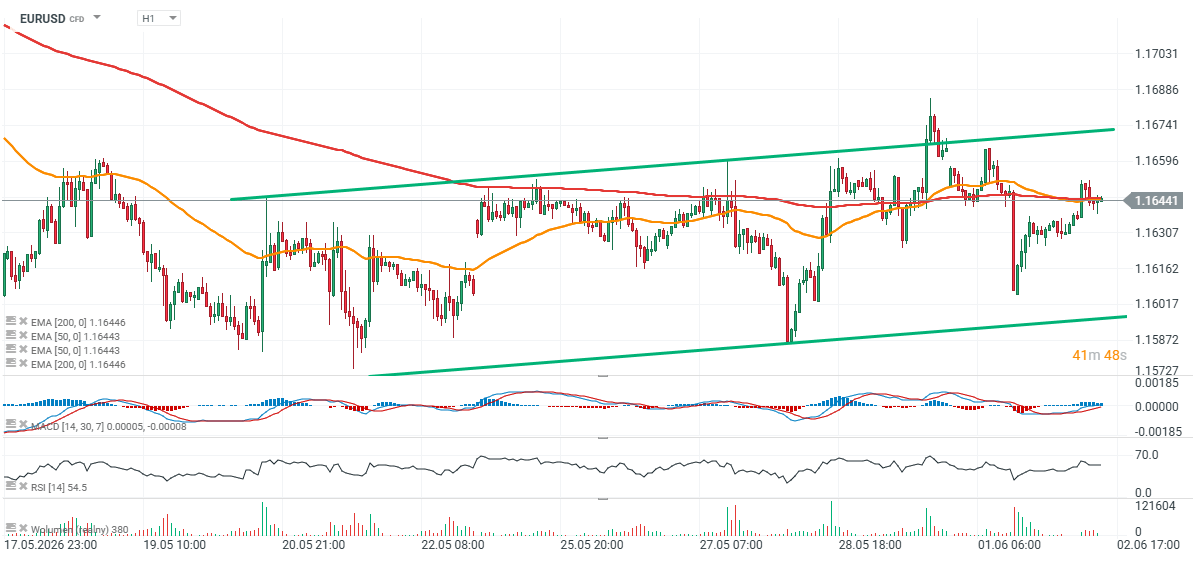
The preliminary May CPI report showed headline inflation rising by 3.2% year-over-year, in line with forecasts and unchanged from the previous reading. However, core CPI surprised to the upside, accelerating to 2.6% versus expectations of 2.4% and the prior reading of 2.2%. EUR/USD is currently trading in the middle of an upward-sloping price channel. The key resistance zone appears to be located around 1.167–1.170, while 1.160 remains an important support level.
The EMA50 and EMA200 moving averages (orange and red lines) are positioned close to current market levels, suggesting that the 1.164 area could act as a short-term momentum pivot. Given that the current relatively modest recovery follows a sharp decline from the 1.20 area, it remains possible that the pair is forming a bearish flag pattern. A break below 1.160 would strengthen that technical scenario and potentially signal a continuation of the broader downtrend.
GBP/USD lacks any firm intraday directional bias and oscillates in a narrow range on Monday.
Geopolitical uncertainties and hawkish Fed expectations underpin the USD, capping spot prices.
The technical setup, too, warrants some caution before positioning for any meaningful upside.
The GBP/USD pair struggles to capitalize on its goodish recovery from a one-and-a-half-week low, touched last Thursday, and oscillates in a narrow range around mid-1.3400s at the start of a new week. The US Dollar (USD) regains some positive traction amid the uncertainty over a potential US-Iran peace deal and hawkish US Federal Reserve (Fed) bets. This, in turn, is seen as a key factor acting as a headwind for spot prices.
The British Pound (GBP), on the other hand, is undermined by expectations for a delayed rate hike from the Bank of England (BoE), especially after softer inflation figures and an unexpected rise in the Unemployment Rate. Traders, however, opt to wait for this week’s important US macro releases and BoE Governor Andrew Bailey’s appearances before positioning for the next leg of a directional move for the GBP/USD pair.
From a technical perspective, spot prices hold a capped tone below the 200-period Simple Moving Average (SMA) on the 4-hour chart, which should continue to act as overhead supply. However, the rising trend-line support around 1.3356 underpins the broader advance. Meanwhile, momentum indicators are mildly constructive, yet signaling at stabilizing downside pressure rather than a decisive bullish shift for the GBP/USD pair.
In fact, the Relative Strength Index (RSI) is hovering above the 50 line, while the Moving Average Convergence Divergence (MACD) is marginally positive. This, in turn, suggests that any subsequent move up is more likely to confront stiff resistance near the 1.3500 psychological mark (200-period SMA). A sustained move above this barrier would be needed to reopen the path toward higher highs.
On the downside, the next notable support aligns with the prior uptrend support line around 1.3356, where buyers would be expected to emerge on a deeper pullback. A convincing break below that zone would suggest a more meaningful deterioration of the medium-term bullish structure.
(The technical analysis of this story was written with the help of an AI tool.)
GBP/USD 4-hour chart
US Dollar Price Today
The table below shows the percentage change of US Dollar (USD) against listed major currencies today. US Dollar was the strongest against the New Zealand Dollar.
USD
EUR
GBP
JPY
CAD
AUD
NZD
CHF
USD
0.09%
-0.05%
0.13%
0.07%
-0.03%
0.31%
0.27%
EUR
-0.09%
-0.12%
0.00%
-0.02%
-0.07%
0.23%
0.17%
GBP
0.05%
0.12%
0.15%
0.11%
-0.01%
0.33%
0.28%
JPY
-0.13%
0.00%
-0.15%
-0.03%
-0.14%
0.21%
0.14%
CAD
-0.07%
0.02%
-0.11%
0.03%
-0.11%
0.23%
0.18%
AUD
0.03%
0.07%
0.00%
0.14%
0.11%
0.29%
0.28%
NZD
-0.31%
-0.23%
-0.33%
-0.21%
-0.23%
-0.29%
-0.05%
CHF
-0.27%
-0.17%
-0.28%
-0.14%
-0.18%
-0.28%
0.05%
The heat map shows percentage changes of major currencies against each other. The base currency is picked from the left column, while the quote currency is picked from the top row. For example, if you pick the US Dollar from the left column and move along the horizontal line to the Japanese Yen, the percentage change displayed in the box will represent USD (base)/JPY (quote).
g toward EURUSD. If the ECB ultimately decides to raise rates, the euro could benefit in the short term, although the central bank would risk further weakening economic activity in exchange for making additional progress in the fight against inflation. On the other hand, a decision to leave rates unchanged—despite markets being almost fully convinced of a hike—could weigh on the euro and pressure EURUSD, which is currently trading within an interesting technical formation.
Technical Analysis (D1 Timeframe)
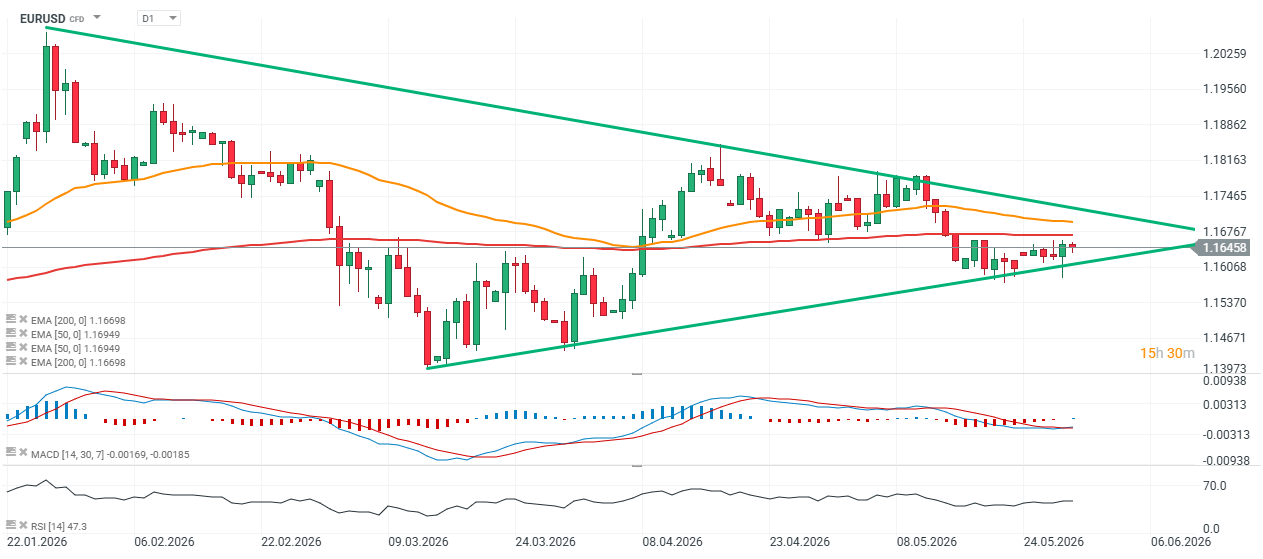
On the daily chart, EURUSD remains trapped within a medium-term symmetrical triangle , a consolidation pattern that has been developing since March. The pair is now trading very close to the apex of the formation, suggesting that a breakout and a stronger directional move may be approaching. Price is currently oscillating around the 50-day EMA (1.1695) and the 200-day EMA (1.1670) . The two moving averages are trading very close to each other, confirming the lack of a clear trend and highlighting the market’s transition into a balanced, range-bound environment. EURUSD remains slightly below the 50-day EMA but above the 200-day EMA, maintaining a broadly neutral technical setup. The upper boundary of the triangle is currently located around 1.1680–1.1700 , while key support can be found near 1.1630–1.1650 . The market has respected both boundaries multiple times, with April and May highs repeatedly stalling near resistance and March and May lows establishing a rising support line. From a technical perspective, breakouts from symmetrical triangles often lead to sharp directional moves, particularly when they occur close to the apex of the pattern. MACD and RSI The MACD remains below the zero line, although the histogram is clearly reducing its negative readings. This suggests:
Fading bearish momentum,
The potential emergence of a bullish signal if the MACD line crosses above the signal line.
While this is not yet a definitive buy signal, selling pressure appears to be weakening. Meanwhile, the RSI is hovering around 48 , almost exactly at neutral territory. This leaves room for both an upside breakout and a downside move without indicating either overbought or oversold conditions. Key Levels to WatchSupport:
1.1640–1.1650 (lower boundary of the triangle)
1.1600
1.1540
Resistance:
1.1680–1.1700 (upper boundary of the triangle)
1.1760
1.1820–1.1850
Bullish Scenario
A break above 1.1700 accompanied by a daily close above the upper boundary of the triangle would represent the first major signal of renewed bullish momentum. In such a scenario, EURUSD could initially target the 1.1760 area before potentially retesting April highs near 1.1820–1.1850 . Bearish Scenario If the pair fails to overcome resistance and instead breaks below support around 1.1640 , the risk of a move toward 1.1600 and subsequently 1.1540 would increase significantly. Such a breakout would also be supported by the MACD remaining below the zero line.
Conclusion
From a technical standpoint, EURUSD is currently at an equilibrium point. The most important feature on the chart remains the narrowing symmetrical triangle, which points to an approaching breakout. As long as the pair remains trapped between 1.1640 and 1.1700 , neither bulls nor bears have a clear advantage. However, the gradual fading of bearish momentum on the MACD slightly increases the probability of an upside breakout attempt in the coming sessions.
Source: xStation5
The material on this page does not constitute financial advice and does not take into account your level of understanding, investment objectives, financial situation or any other specific needs. All information provided, including opinions, market research, mathematical results and technical analyzes published on the Website or transmitted To you by other means, it is provided for information purposes only and should in no way be construed as an offer or solicitation for a transaction in any financial instrument, nor should the information provided be construed as advice of a legal or financial nature on which any investment decisions you make should be based exclusively To your level of understanding, investment objectives, financial situation, or other specific needs, any decision to act on the information published on the Website or sent to you by other means is entirely at your own risk if you In doubt or unsure about your understanding of a particular product, instrument, service or transaction, you should seek professional or legal advice before trading. Investing in CFDs carries a high level of risk, as they are leveraged products and have small movements Often the market can result in much larger movements in the value of your investment, and this can work against you or in your favor. Please ensure you fully understand the risks involved, taking into account investments objectives and level of experience, before trading and, if necessary, seek independent advice.
Weaker US data, in-line inflation, hawkish ECB minutes, and increased Iranian compliance trigger a sharp rebound in the EURUSD pair. A noticeable shift has taken place in the financial markets over the last few hours. The exchange rate of the major currency pair, EURUSD , recorded a sharp rebound after earlier, steeper declines briefly pushed it below the 1.16 level. The euro is currently gaining around 0.1% against the US dollar, trading around the 1.1630 mark. This move stems from a combination of disappointing macroeconomic data from the US, hawkish signals from the European Central Bank, and new developments on the geopolitical front.
Weaker US Macro Data and Inflation Relief
The main catalyst for the weakening of the greenback came from the latest macroeconomic releases from across the Atlantic, which cooled investors’ hawkish fears:
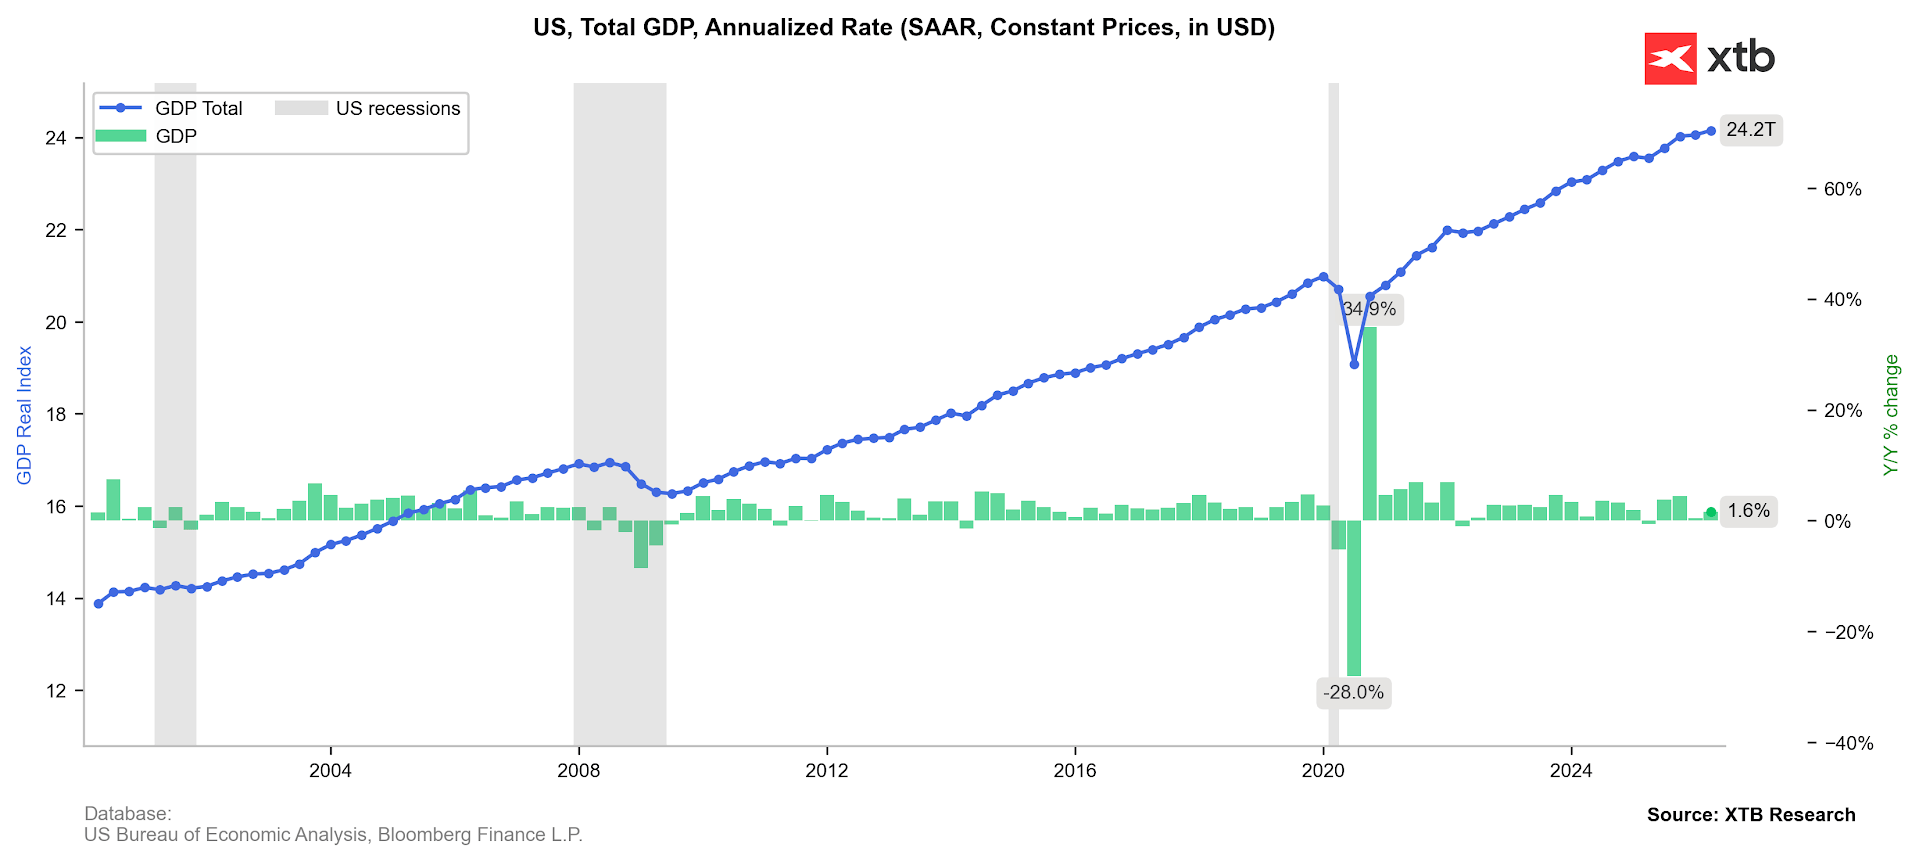
Disappointing GDP Growth: The US Bureau of Economic Analysis published its second revision of Q1 GDP, lowering the economic growth estimate to 1.6% from the previous 2.0%. The market widely expected the figure to hold steady at 2.0%.
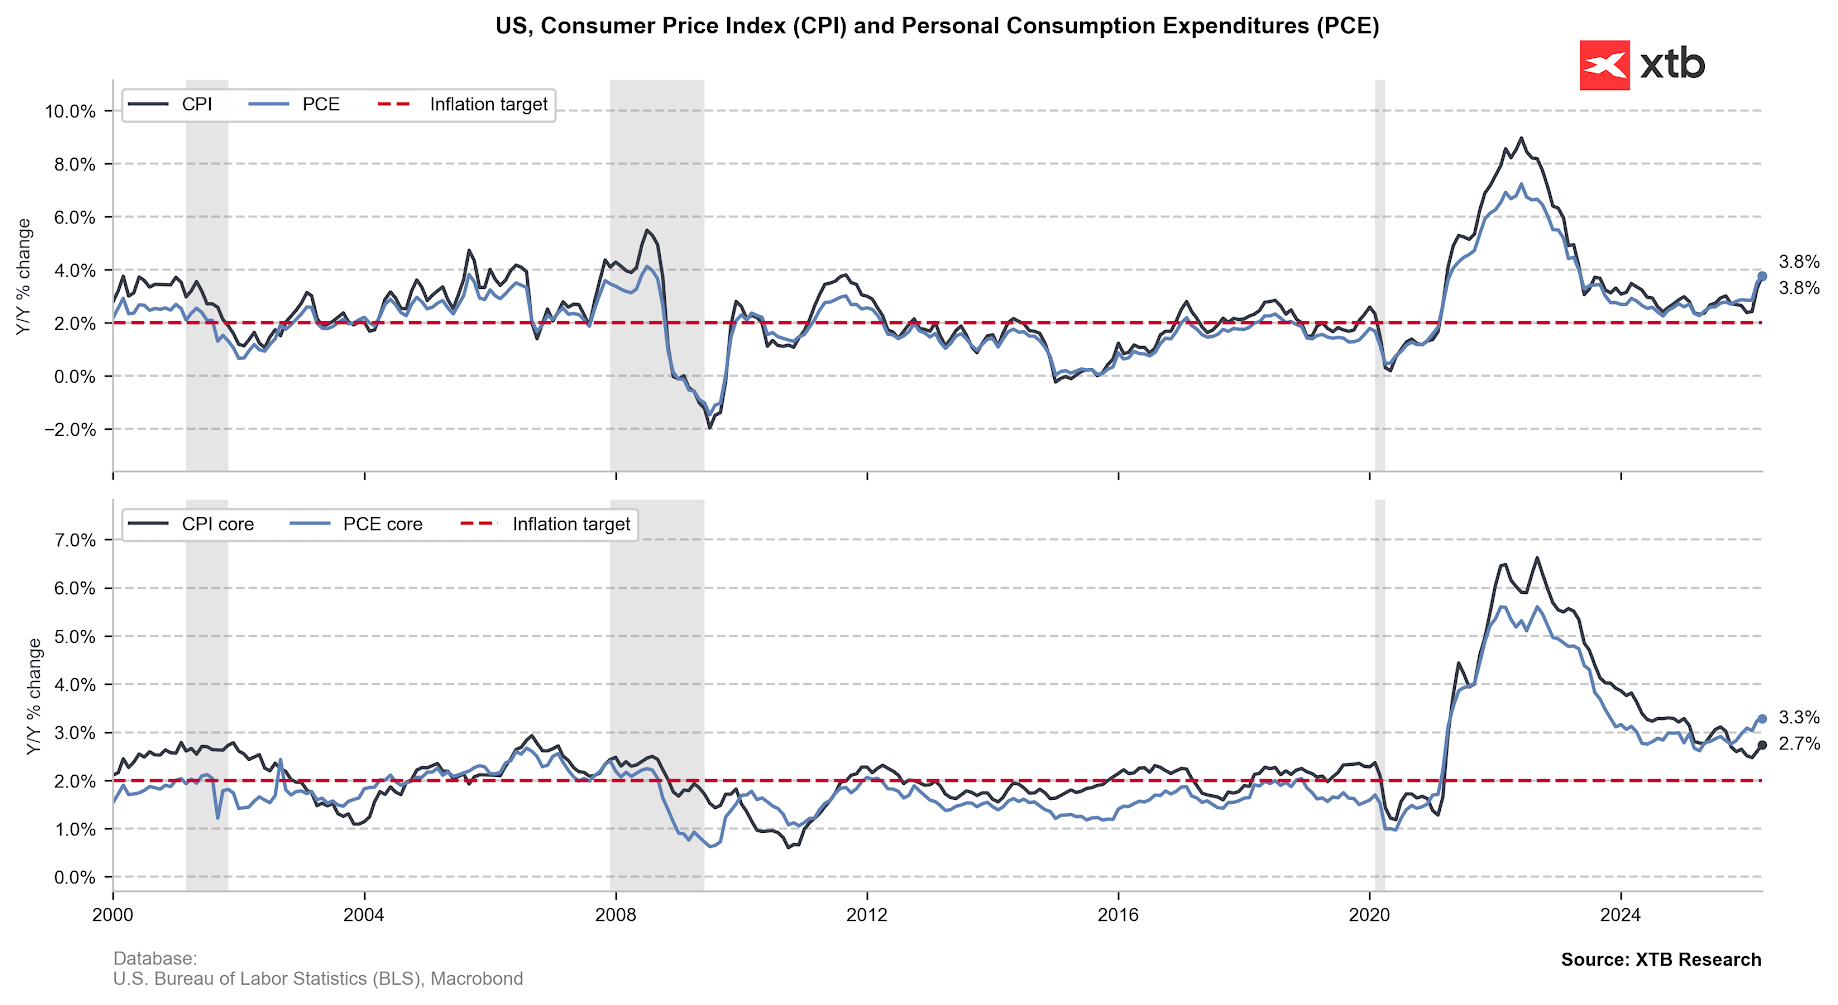
PCE Inflation In-Line with Expectations: The headline Personal Consumption Expenditures (PCE) price index, the Fed’s preferred inflation gauge, rose to 3.8% year-over-year in April (up from 3.5% in March), which was fully in line with market consensus.
Core PCE Stabilization: The Core PCE index (excluding food and energy prices) came in at 3.3% annually, also matching expectations. Furthermore, on a monthly basis, core inflation increased by 0.2%, coming in slightly below forecasts of 0.3%.
The Q1 GDP revision shows lower economic growth. The fact that the conflict with Iran was already underway in March may suggest that Q2 data will also face a substantial negative impact from this front. Source: Bloomberg Finance LP, XTB
PCE inflation rebounds in line with expectations. This stands in stark contrast to the CPI inflation release, which surprised investors with noticeably higher readings. Source: Bloomberg Finance LP The fact that inflation did not surprise to the upside, despite a massive surge in commodity prices, brought relief to investors. Combined with the clear slowdown in GDP momentum, this translated into a decline in the dollar index. In-line inflation and weaker growth could damp market expectations regarding swift rate hikes from the Fed.
Hawkish ECB and Pressure on the Eurozone
While the US economy sends signs of cooling, information supporting the common currency is flowing in from Europe. The published account of the European Central Bank’s April meeting (the so-called minutes) clearly indicates that pro-inflationary risk factors in the Eurozone have significantly intensified. ECB officials highlighted mounting price pressures, suggesting that the European regulator may be forced to keep interest rates at restrictive levels for a longer period. The divergence in monetary policy outlooks between a potentially softer Fed and an inflation-wary ECB provided a strong impetus for the strengthening of the EURUSD.
The market is currently pricing in a staggering 93% probability of an ECB hike in June . Geopolitics: Sanctions and a Potential Nuclear Breakthrough Concurrently, market attention remains focused on the Middle East. Energy commodity prices rose amid renewed clashes between US and Iranian forces in the Persian Gulf region. WTI crude oil surged by over 3% during the morning European session. The situation was further exacerbated by the decision of US Treasury Secretary Scott Bessent, who announced sanctions against a new Iranian institution that had unilaterally declared control over the Strait of Hormuz. However, market sentiment improved following reports from Saudi Arabia’s Al Hadath news channel. According to these reports, Islamabad is set to propose a compromise to Washington under which Iranian uranium would be transferred to Beijing under strict international supervision. Such a diplomatic move could significantly de-escalate the regional conflict, shaving some risk premium off the markets and dampening the safe-haven demand for assets like the dollar. On the other hand, Trump recently stated that he does not want to agree to Iranian uranium ending up in either Russia or China.
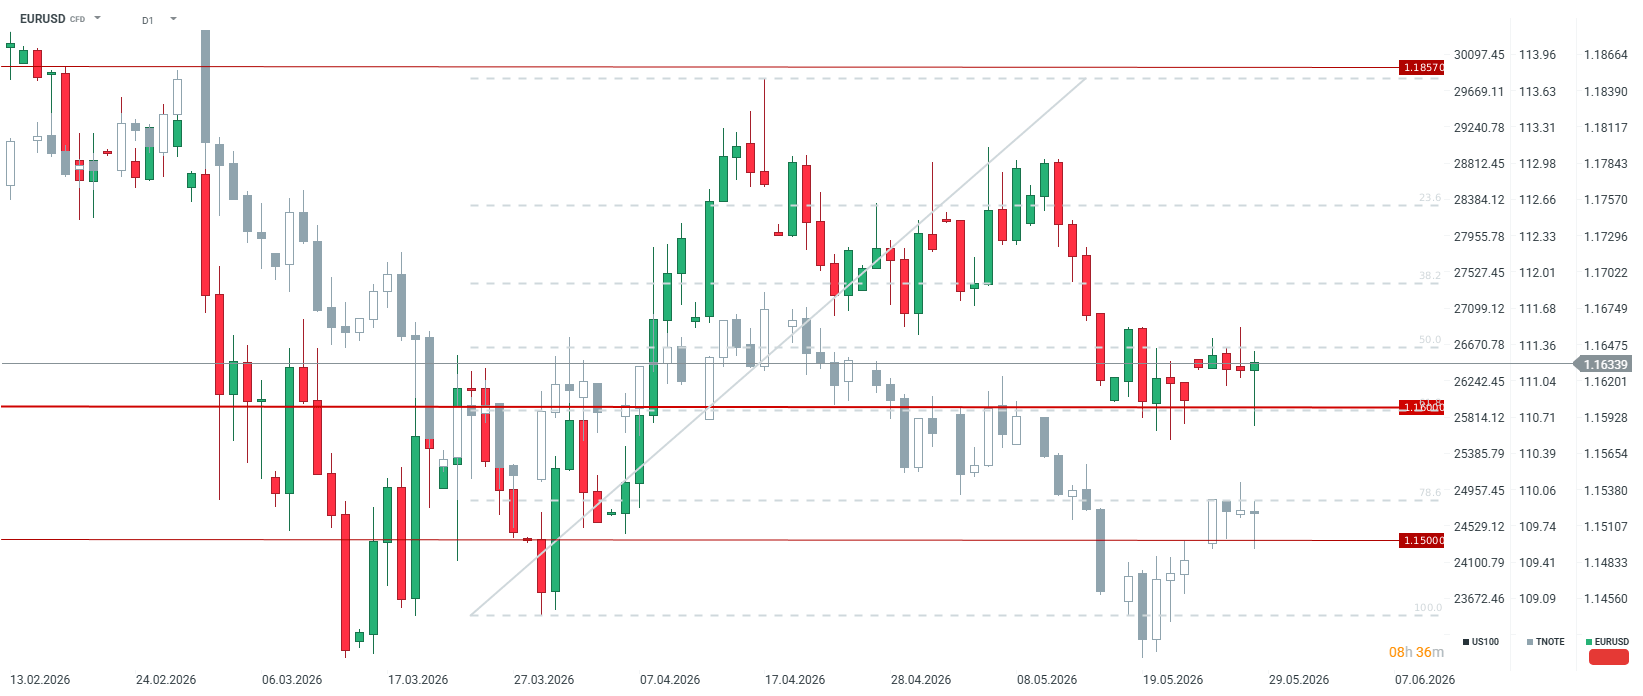
Technical Outlook on EURUSD
The combination of lower-than-expected US economic growth data, a hawkish tone from the ECB, and a potential diplomatic breakthrough regarding the Iranian nuclear program provided solid ground for a sharp EURUSD rebound. Investors gained arguments suggesting that the US central bank will not be forced into immediate policy tightening. The EURUSD closing with such a pronounced candlestick shadow could suggest that key support at the 1.16 level is holding, creating the potential to test resistance at the 50.0% retracement level .
EUR/JPY weakens to around 185.10 in Thursday’s early European session.
The cross keeps the bullish vibe, but further consolidation cannot be ruled out in near term with neutral RSI momentum.
The immediate resistance to watch is 185.65; the initial support level is seen at 184.70.
The EUR/JPY cross loses momentum to near 185.10 during the early European session on Thursday. Escalations in the US-Iran conflict boost the safe-haven currency, such as the Japanese Yen (JPY) and act as a headwind for the cross.
CNN reported on Thursday that Iran’s Islamic Revolutionary Guard Corps (IRGC) launched an attack targeting an American air base, which they said was the source of US strikes on Iranian targets hours before. The US strikes targeted Iranian drones and a launch site near the Strait of Hormuz.
Traders will keep an eye on the Tokyo May Consumer Price Index (CPI) inflation report, which is due later on Friday. In case of a softer-than-expected Tokyo CPI print, this could drag the Japanese Yen lower against the Euro (EUR) in the near term.
Technical Analysis:
In the daily chart, EUR/JPY holds a mild bullish bias as it trades above the 100-day simple moving average and the Bollinger Bands middle line near 184.71, keeping the broader uptrend underpinned. The Relative Strength Index (RSI) hovers around 50, suggesting consolidative but still slightly constructive momentum while price drifts toward the upper Bollinger band.
On the topside, the immediate resistance is the Bollinger upper band around 185.65, and a clear break above this ceiling would open the way for a renewed extension of the advance. On the downside, initial support is seen at the Bollinger middle band near 184.70 and the 100-day SMA at 184.40, with the lower Bollinger band near 183.78 acting as a deeper cushion if a corrective pullback develops.
To provide the best experiences, we use technologies like cookies to store and/or access device information. Consenting to these technologies will allow us to process data such as browsing behavior or unique IDs on this site. Not consenting or withdrawing consent, may adversely affect certain features and functions.
Functional
Always active
The technical storage or access is strictly necessary for the legitimate purpose of enabling the use of a specific service explicitly requested by the subscriber or user, or for the sole purpose of carrying out the transmission of a communication over an electronic communications network.
Preferences
The technical storage or access is necessary for the legitimate purpose of storing preferences that are not requested by the subscriber or user.
Statistics
The technical storage or access that is used exclusively for statistical purposes.The technical storage or access that is used exclusively for anonymous statistical purposes. Without a subpoena, voluntary compliance on the part of your Internet Service Provider, or additional records from a third party, information stored or retrieved for this purpose alone cannot usually be used to identify you.
Marketing
The technical storage or access is required to create user profiles to send advertising, or to track the user on a website or across several websites for similar marketing purposes.