BNY’s Bob Savage highlights that China has criticized the European Union’s (EU) proposed Industrial Accelerator Act as discriminatory, warning of possible countermeasures that could affect trade and investor confidence. He also notes a sharp deterioration in Germany’s consumer climate, with GfK sentiment at its weakest since February 2023, as higher energy prices and Iran-related geopolitical tensions weigh on the Euro area outlook and EUR/USD.
Policy frictions and soft German data
“China’s commerce ministry has criticized the EU for its proposed Industrial Accelerator Act. It formally submitted comments on April 24 outlining strong concerns over what it views as discriminatory provisions against foreign investors.”
“It contends that these measures violate core World Trade Organization principles, including most favored nation and national treatment rules, and could undermine fair competition and investor confidence.”
“Germany’s consumer climate for May deteriorated sharply, with the GfK headline indicator falling to -33.3 from -28.1 in April. This marks a 5.2-point decline and the weakest reading since February 2023.”
“Economic expectations deteriorated further to -13.7, reflecting concerns that geopolitical tensions, particularly the Iran conflict, could derail Germany’s fragile recovery outlook.”
The social web’s success stems from standards and protocols like WebFinger and OAuth, which foster ownership, interoperability, and innovation, surpassing the temporary impact of individual platforms.
EUR/USD remains supported at the start of the week, helped by a weaker US Dollar amid geopolitical uncertainty.
German consumer sentiment deteriorates more than expected, reflecting current economic tensions.
Markets await the Fed and ECB monetary policy decisions later this week.
EUR/USD trades around 1.1740 on Monday, up 0.21% on the day, extending Friday’s rebound from the 1.1670 area, despite a more fragile macroeconomic backdrop in the Eurozone.
Latest data from Germany show a marked deterioration in consumer confidence. The GfK index falls to -33.3 in May, its lowest level in more than three years, from -28.1 previously and well below market expectations. This decline highlights the ongoing impact of geopolitical tensions and rising energy prices on European households. However, the Euro’s (EUR) reaction remains limited, as investors currently focus on external drivers.
The main market catalyst remains developments in the Middle East. Hopes for easing tensions between the United States (US) and Iran are supporting risk appetite, weighing on demand for the safe-haven US Dollar (USD). According to reports from Axios, Tehran has submitted a new peace proposal that includes reopening the Strait of Hormuz, fostering cautious optimism. Nevertheless, negotiations remain stalled, and disruptions to Oil supply keep Crude prices near $100 per barrel, a level that could weigh on global growth.
In this context, the US Dollar Index (DXY) is declining, reflecting broad-based weakness in the Greenback. Expectations that the Federal Reserve (Fed) will keep interest rates unchanged in the near term, alongside the possibility of a more dovish stance ahead, are also contributing to the downside pressure on the USD.
Investors now turn their attention to upcoming monetary policy decisions this week. The Fed is expected to hold rates steady on Wednesday, while the European Central Bank (ECB) is likely to follow suit on Thursday, although it may signal future tightening amid persistent inflationary pressures, particularly driven by energy prices. According to ING, a firm ECB message regarding a potential rate hike could help keep the Euro supported in the short term.
Overall, despite weakening European fundamentals, EUR/USD dynamics remain primarily driven by external factors, particularly US Dollar movements and geopolitical developments.
Euro Price Today
The table below shows the percentage change of Euro (EUR) against listed major currencies today. Euro was the strongest against the US Dollar.
USD
EUR
GBP
JPY
CAD
AUD
NZD
CHF
USD
-0.20%
-0.19%
-0.16%
-0.44%
-0.51%
-0.56%
-0.10%
EUR
0.20%
0.02%
0.04%
-0.24%
-0.27%
-0.34%
0.10%
GBP
0.19%
-0.02%
0.02%
-0.28%
-0.32%
-0.39%
0.08%
JPY
0.16%
-0.04%
-0.02%
-0.28%
-0.35%
-0.41%
0.09%
CAD
0.44%
0.24%
0.28%
0.28%
-0.06%
-0.12%
0.34%
AUD
0.51%
0.27%
0.32%
0.35%
0.06%
-0.04%
0.43%
NZD
0.56%
0.34%
0.39%
0.41%
0.12%
0.04%
0.45%
CHF
0.10%
-0.10%
-0.08%
-0.09%
-0.34%
-0.43%
-0.45%
The heat map shows percentage changes of major currencies against each other. The base currency is picked from the left column, while the quote currency is picked from the top row. For example, if you pick the Euro from the left column and move along the horizontal line to the US Dollar, the percentage change displayed in the box will represent EUR (base)/USD (quote).
EUR/GBP bounced up from lows near 0.8650 but remains capped below 0.8670 so far.
Weak German consumer confidence data has weighed on the Euro across the board.
Technical indicators show a waning bearish pressure.
The Euro (EUR) is trimming some losses against the British Pound (GBP) on Monday after finding support at the 0.8655 area late last week. Upside attempts, however, remain capped below a previous support area at 0.8670 so far, which leaves the broader bearish trend in play for now.
Data from Germany released earlier on Monday revealed that consumer confidence for May, as measured by the GfK Consumer Confidence Survey, deteriorated to its weakest level since February 2023, amid the consequences of the war in Iran. The impact of these figures on the Euro, however, has been cushioned by a mild risk appetite, fuelled by news of ongoing negotiations between the US and Iran to end the Middle East conflict. This is keeping the Euro and the Pound moderately positive against the safe-haven US Dollar (USD).
Technical Analysis: Bears are losing momentum
From a technical perspective, the 4-hour chart shows the EUR/GBP trading within a bearish channel, although Friday’s upper low and a bullish divergence in the Relative Strength Index (RSI) suggest that sellers might be losing momentum.
The RSI has been trending higher, although it is still below the 50 midline, highlighting a mild bearish pressure. The Moving Average Convergence Divergence (MACD) histogram is flat near the zero line, pointing to a lack of strong directional momentum, altogether showing an indecisive market.
Bulls would need to confirm above the area around 0.8685 (April 8, 14 lows, and April 24 high) to clear the path towards trendline resistance, now at 0.8705. Key support is at the confluence of Thursday and Friday’s lows, between 0.8655 and 0.8660, and the channel bottom, at 0.8650. Further down, the next target is the March 24 and 26 lows near 0.8635.
Euro Price Today
The table below shows the percentage change of Euro (EUR) against listed major currencies today. Euro was the strongest against the US Dollar.
USD
EUR
GBP
JPY
CAD
AUD
NZD
CHF
USD
-0.21%
-0.16%
-0.16%
-0.40%
-0.49%
-0.51%
-0.11%
EUR
0.21%
0.08%
0.07%
-0.19%
-0.26%
-0.29%
0.10%
GBP
0.16%
-0.08%
0.00%
-0.24%
-0.34%
-0.37%
0.04%
JPY
0.16%
-0.07%
0.00%
-0.23%
-0.34%
-0.38%
0.08%
CAD
0.40%
0.19%
0.24%
0.23%
-0.10%
-0.14%
0.29%
AUD
0.49%
0.26%
0.34%
0.34%
0.10%
-0.01%
0.39%
NZD
0.51%
0.29%
0.37%
0.38%
0.14%
0.01%
0.41%
CHF
0.11%
-0.10%
-0.04%
-0.08%
-0.29%
-0.39%
-0.41%
The heat map shows percentage changes of major currencies against each other. The base currency is picked from the left column, while the quote currency is picked from the top row. For example, if you pick the Euro from the left column and move along the horizontal line to the US Dollar, the percentage change displayed in the box will represent EUR (base)/USD (quote).
USD/CHF may test the descending channel’s lower boundary near 0.7690.
The 14-day Relative Strength Index near 47 signals weak momentum, not a clear oversold condition.
The initial resistance lies at the nine-day EMA of 0.7843.
USD/CHF remains subdued for the second successive day, trading around 0.7840 during European hours on Monday. The technical analysis of the daily chart indicates the pair is positioned within the descending channel pattern, signaling an ongoing bearish bias.
The USD/CHF pair keeps a bearish near-term bias as the spot price holds beneath both the nine-day and 50-day Exponential Moving Averages, respectively. The short-term EMA flattening just above the price and the longer EMA capping the pair hint at persistent overhead supply, while the 14-day Relative Strength Index (RSI) around 47 reflects subdued momentum rather than a decisive oversold condition.
The USD/CHF pair may navigate the region around the lower boundary of the descending channel around 0.7690. A successful break below the channel would reinforce the bearish bias and put downward pressure on the pair to test 0.7604, the lowest since August 2011, recorded in January.
On the upside, the immediate barrier lies at the nine-day EMA of 0.7843, followed by the 50-day EMA at 0.7862. A break above these EMAs would improve price momentum and support the USD/CHF pair to test the upper boundary of the descending channel around 0.7949. A sustained break above the channel would cause the emergence of the bullish bias and lead the pair to explore the region around the 10-month high of 0.8171, reached in August 2025.
USD/CHF: Daily Chart
(The technical analysis of this story was written with the help of an AI tool.)
Swiss Franc Price Today
The table below shows the percentage change of Swiss Franc (CHF) against listed major currencies today. Swiss Franc was the strongest against the US Dollar.
USD
EUR
GBP
JPY
CAD
AUD
NZD
CHF
USD
-0.24%
-0.18%
-0.14%
-0.42%
-0.54%
-0.54%
-0.18%
EUR
0.24%
0.07%
0.11%
-0.18%
-0.26%
-0.29%
0.07%
GBP
0.18%
-0.07%
0.02%
-0.26%
-0.36%
-0.38%
-0.01%
JPY
0.14%
-0.11%
-0.02%
-0.26%
-0.39%
-0.42%
0.00%
CAD
0.42%
0.18%
0.26%
0.26%
-0.12%
-0.15%
0.24%
AUD
0.54%
0.26%
0.36%
0.39%
0.12%
-0.01%
0.36%
NZD
0.54%
0.29%
0.38%
0.42%
0.15%
0.01%
0.37%
CHF
0.18%
-0.07%
0.00%
-0.00%
-0.24%
-0.36%
-0.37%
The heat map shows percentage changes of major currencies against each other. The base currency is picked from the left column, while the quote currency is picked from the top row. For example, if you pick the Swiss Franc from the left column and move along the horizontal line to the US Dollar, the percentage change displayed in the box will represent CHF (base)/USD (quote).
Logging into your analytics to find a sudden drop in website traffic is incredibly frustrating. Your first thought is usually, “Did I break something, or did Google penalize my site?”
At WPBeginner, we have managed high-traffic websites since 2009. We have seen just about every reason for a traffic dip, from major search engine updates to minor technical settings that accidentally block search bots.
The key to getting your traffic back on track is to calmly diagnose the issue. I’ve helped many site owners through this exact situation.
In this guide, I will walk you through my proven step-by-step process to figure out why your traffic fell and show you how to fix it.
TL;DR: If your WordPress site traffic drops unexpectedly, don’t panic. Start by confirming your analytics tracking is working, then check Google Search Console for manual penalties or algorithm updates. Next, audit recent site changes, verify indexing status, and scan for malware before monitoring your recovery with site notes.
This is a comprehensive troubleshooting article. You can use the quick links below to navigate through the different topics:
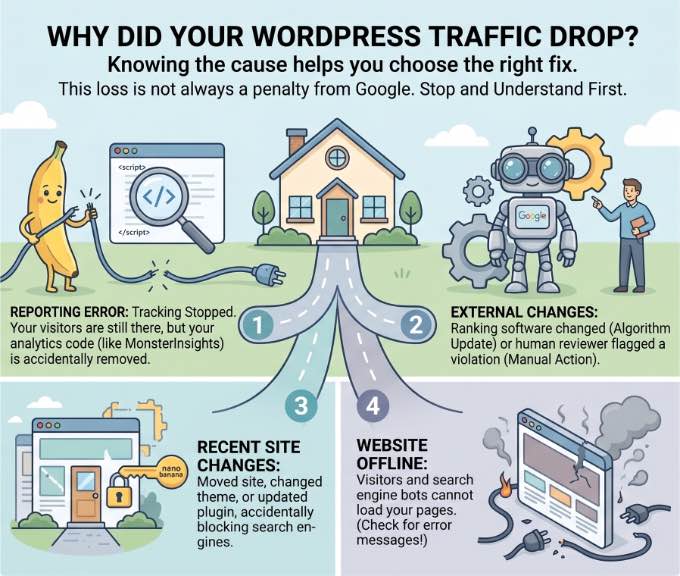
When your website traffic suddenly disappears, it generally means something is preventing visitors from reaching your content or stopping search engines from seeing your site.
Before you start panicking or changing your WordPress SEO settings, you need to understand that this loss is not always a ‘penalty’ from Google.
Knowing the exact cause will help you choose the right fix without wasting time. Generally, traffic drops fall into one of three categories:
Reporting Errors: Your visitors are still there, but your tracking has stopped working. This often happens if your analytics code is accidentally removed.
External Changes: Google changed its ranking software (Algorithm Update) or a human reviewer flagged your site for a violation (Manual Action).
Recent Site Changes: You recently moved your site, changed your theme, or updated a plugin that accidentally blocked search engines.
And sometimes, a traffic drop is simply the result of your website going offline. If you are seeing visible error messages on your site along with the traffic drop, then it means visitors and search engine bots cannot load your pages.
Step 1: Confirm the Traffic Drop (And Check Your Tracking)
The first thing you should do is make sure the data you are seeing is accurate. Sometimes, a drop is actually just a normal seasonal dip or a tracking error.
To check this, you can use MonsterInsights. It is the best Google Analytics plugin for WordPress and makes it easy to compare your traffic over time.
We use MonsterInsights on WPBeginner to collect all our general website statistics, including engagement rates and most-visited pages.
In my experience, if you see your traffic drop to absolute zero instantly, then it is almost always a tracking health failure rather than a search engine penalty.
Check for Normal Seasonal Dips
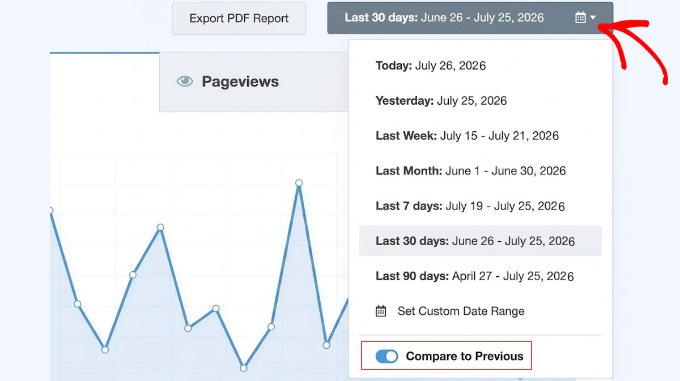
In your WordPress dashboard, go to Insights » Reports. Click on the date selector in the top right to open the date picker.
If you are using MonsterInsights Plus or higher, then you can toggle the ‘Compare to Previous’ switch. This will automatically refresh your reports to display your current data alongside the previous period’s data.
You can use the custom date range tool within this calendar to select the exact same time period from last year.
This allows you to check if your traffic usually dips during this specific season, which is a very common trend for businesses.
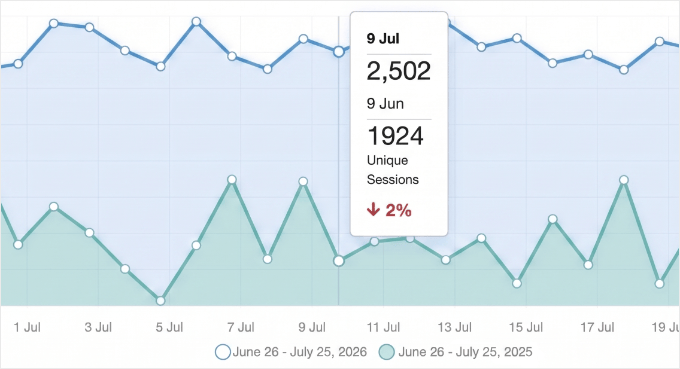
If your chart shows a similar dip during the same time last year, you are likely just experiencing normal seasonality. You don’t need to panic or make any drastic changes.
However, if this drop is entirely new, or if your traffic is significantly lower than last year, then you have a real traffic drop and should continue to the next steps to find the cause.
Check Your Analytics Connection
Alternatively, if you look at your reports and see that your traffic has dropped to absolute zero instantly, it is almost certainly a tracking health issue rather than a Google penalty.
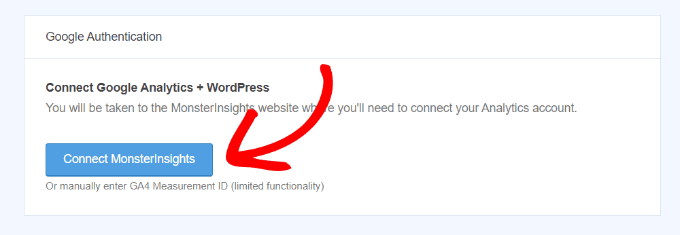
You should navigate to Insights » Settings to make sure your Google Analytics 4 (GA4) property is still properly authenticated.
If the connection was lost, then your site is still getting visitors, but they simply aren’t being counted. This creates a false traffic drop in your reports, even though your actual search rankings haven’t changed.
In this case, you will see a large blue ‘Connect MonsterInsights’ button instead of your active profile data. Simply click this button to reconnect your account to Google Analytics and start tracking your visitors again.
Expert Tip: Always double-check your connection to Google Analytics after major updates. Also, if your traffic dropped by exactly half, then you may have accidentally fixed a ‘double tracking’ error. If Google’s ‘Enhanced Measurement’ and MonsterInsights were both tracking at the same time, your previous numbers were artificially inflated.
If you need help setting this up from scratch, or want to make sure your settings are completely correct, see our step-by-step guide on how to install Google Analytics in WordPress.
Step 2: Check for a Google Manual Action
If your tracking is working correctly but your traffic has still dropped, then the next step is to check if Google has manually penalized your site. A ‘Manual Action’ happens when a human reviewer at Google decides your site doesn’t follow their quality guidelines.
To check for this, you first need to make sure your site is connected to Google Search Console.
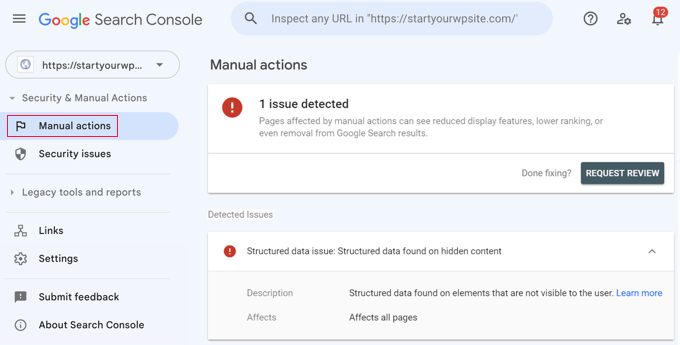
Once you are logged in to your account, look at the left-hand menu, scroll down to the ‘Security & Manual Actions’ section, and click on ‘Manual actions’.
If you see a message saying ‘No issues detected’, then you are in the clear. However, if you see a specific penalty listed, Google will provide details on what is wrong, such as ‘thin content’ or ‘unnatural links’.
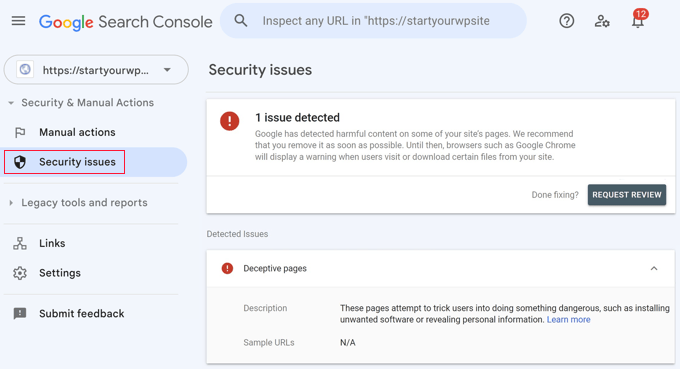
You should also click the ‘Security issues’ tab directly below Manual actions. This will tell you if Google has detected malware or a hack on your site.
When this happens, Google often shows a bright red ‘Deceptive Site Ahead’ warning to anyone trying to visit your site, which will instantly cause your traffic to disappear.
If you find a penalty or security flag, you will need to fix the specific issues and then click the ‘Request Review’ button in Search Console.
When asking Google to reconsider your site, be sure to provide a brief ‘paper trail’ explaining the exact steps you took to clean up the issue (like removing a malicious plugin), as this greatly improves your chances of recovery.
Recovering from these penalties requires you to identify the exact cause (like toxic backlinks or hidden malware), clean your website files, and submit a thorough review request to Google.
Unlike manual actions, Google algorithm updates are automated. Google frequently changes its ranking algorithm to improve search results, and these updates can cause your rankings to shift overnight.
The easiest way to see if an update hit your site is by using All in One SEO (AIOSEO). It is the best SEO plugin for WordPress and includes a powerful Search Statistics feature (available in the Elite plan) that overlays Google update dates directly onto your traffic reports.
Expert Tip: The Search Statistics feature that overlays Google update dates in AIOSEO is exclusive to the Elite plan. For basic on-page SEO analysis, the free version is great, but for this level of historical trend analysis, you’ll need the advanced tier.
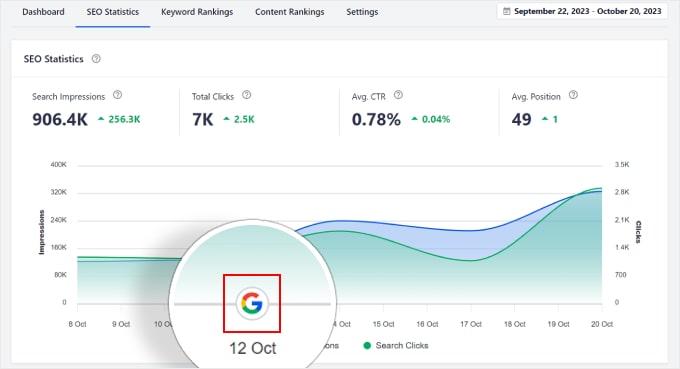
To see this, go to All in One SEO » Search Statistics in your dashboard. On the ‘SEO Statistics’ chart, look for small vertical lines with a Google icon.
You can actually click these markers to read a summary of what that specific core update targeted.
If a traffic drop happens on the exact same day as one of these markers, then your site was likely affected by that specific update.
Since we switched all our brand websites to All in One SEO, we have relied on these search statistics to monitor our performance. We use the ‘Google Update’ markers on our own charts to quickly identify if a ranking shift aligns with a core algorithm change.
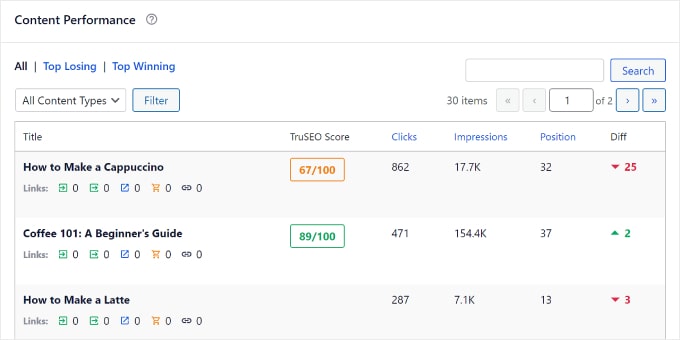
Then, we simply scroll down to AIOSEO’s Content Performance table to see exactly which of our posts lost rankings.
This allows us to pinpoint the cause and react quickly, saving weeks of uncertainty and lost traffic.
Unlike manual actions, you cannot submit a review request to Google for an algorithmic penalty.
To recover, you must identify what the update targeted (such as ‘thin content’ or ‘spammy links’), then rewrite the affected pages to be more helpful and wait for Google’s algorithm to naturally reward your improvements.
Related Guide: You may also be receiving less traffic because more people are using AI search to get information. For tips on how to fix this, see our guide on how to optimize your content for AI search overviews.
Step 4: Audit for Technical Errors and Recent Site Changes
If your drop isn’t related to a Google update, then it is often caused by a recent change you made to your own site. This is especially common after a WordPress site migration, a theme change, or a major plugin update.
Expert Tip: Before making any major site changes like a theme switch or plugin update, always test them on a staging site first. This lets you catch potential issues that could cause traffic drops without impacting your live website.
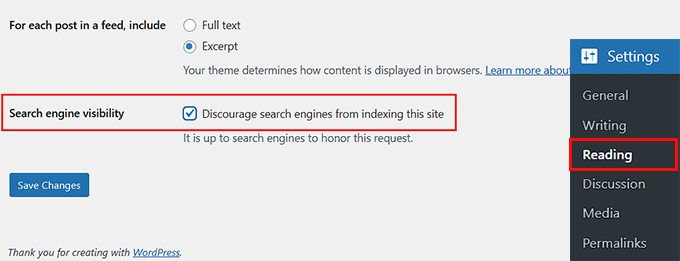
Verify Search Engine Visibility
First, you should review the ‘Search engine visibility’ setting.
Sometimes developers or site owners accidentally select this box while working on a site and forget to uncheck it when they go live.
Go to Settings » Reading and look at the ‘Search engine visibility’ option.
If the box next to ‘Discourage search engines from indexing this site’ is checked, that is likely the cause of your traffic drop. You will need to uncheck this box immediately and click the ‘Save Changes’ button.
Keep in mind that once unchecked, it can take a few days for Google to recrawl your website and place your pages back into search results, so don’t panic if your traffic doesn’t return instantly.
You should also make sure you haven’t accidentally left your site in ‘Maintenance Mode‘ using a plugin like SeedProd or accidentally set your most important pages to ‘noindex‘ inside your SEO plugin’s advanced settings.
Review Security Plugin Settings
Next, you should check your security plugins. Some security tools use ‘aggressive bot detection’ to stop hackers. But if misconfigured, they can accidentally block Google’s crawlers.
This usually happens if the security settings are set too high or if the plugin fails to recognize Google’s IP addresses as safe.
Expert Tip: When setting up security plugins, start with the recommended default settings. Overly aggressive firewall rules can accidentally block real search engines, causing your traffic to drop.
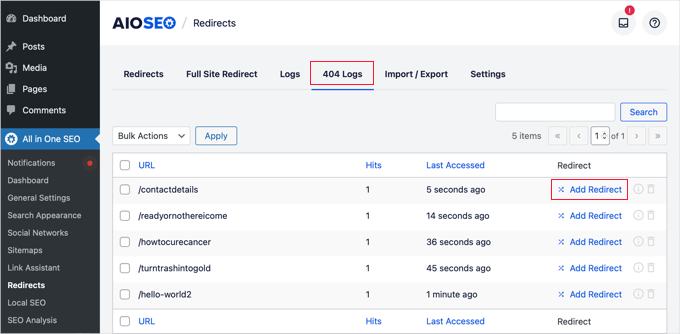
First, you will need to make sure the advanced Redirection Manager feature is activated so it can track these errors.
Once that is turned on, simply go to All in One SEO » Redirects » 404 Logs. If you see a sudden spike in 404 errors here, it could mean your URL structure was broken during a recent change.
Speaking of 404 errors, two of the most common self-inflicted traffic drops happen when users change their permalink structure or delete old content.
If you recently changed your URLs (permalinks) without setting up proper 301 redirects, then Google can no longer find your pages, and your content will disappear from search results.
Similarly, deleting old content, especially pages that previously ranked well or had backlinks, will result in an immediate loss of traffic.
If you must change a URL or delete a post, always use a redirection manager, like the one in AIOSEO, to point the old link to a relevant new page or your homepage so you don’t lose that valuable SEO ranking power.
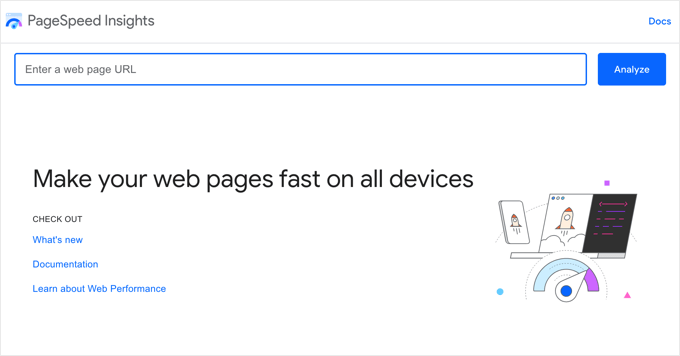
Test Your Website Speed
Another technical issue to check is your website’s load time. If a recent plugin update or theme change drastically slowed down your site, then Google may lower your rankings due to poor Core Web Vitals. People hate slow websites, and search engines do too.
If you have checked these common culprits and still can’t find the issue, you may have a deeper underlying problem. To run a complete diagnostic check of your site’s foundation, see our technical WordPress SEO framework checklist.
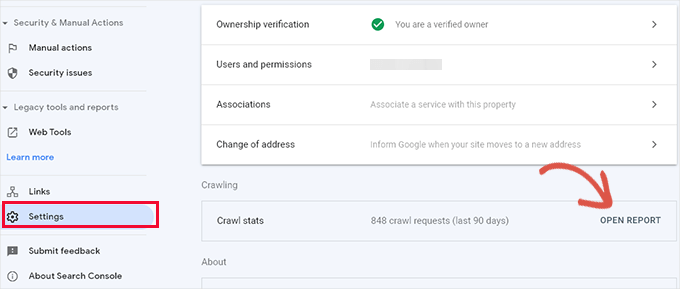
Step 5: Verify Your Indexing Status
Sometimes your site is still live, but Google has decided to stop showing certain pages in search results. This often happens because Google isn’t crawling your website efficiently.
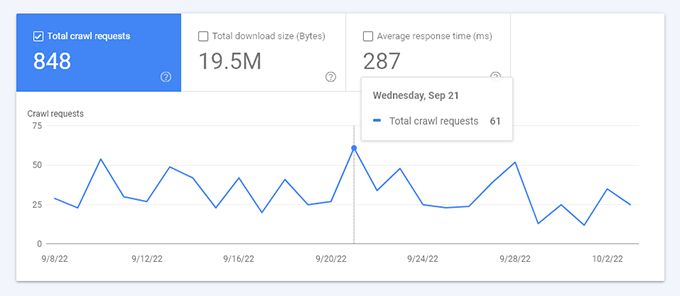
You can check this using the Google Search Console account you set up earlier. In the left-hand menu, click ‘Settings’ and then click ‘Open Report’ next to ‘Crawl stats’.
This report shows an overview of how many times Google bots request pages from your site.
If you look at the breakdown and see that Google is spending its time crawling 404 errors or RSS feeds instead of your actual articles, it means Google is struggling to read your site.
This is known as a ‘Crawl Budget’ problem.
WordPress automatically generates hundreds of extra URLs in the background (like author feeds or category tags). If you don’t manage them, then Google wastes its daily crawling budget on these low-value links instead of discovering your real content.
To fix this, you need to clean up these extra URLs so Google can focus on your most important pages. You can do this easily using the advanced Crawl Cleanup feature available in the premium versions of All in One SEO.
If you have followed the steps above and still haven’t found the cause, then your site may have been compromised. Hackers often launch ‘SEO Spam’ attacks where they inject junk links into your old posts.
Google will notice and drop your rankings as a result.
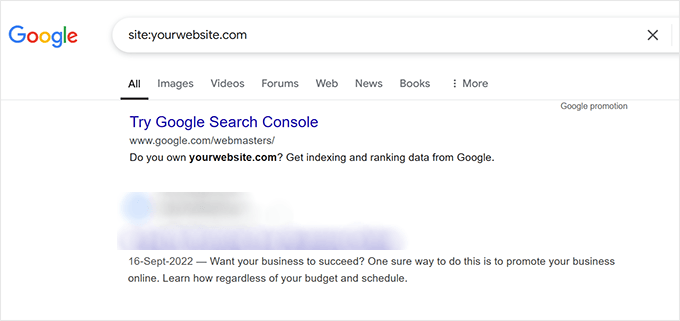
You can do a quick manual check by typing site:yourdomain.com into a Google search. If you see foreign characters, pharmaceutical keywords, or strange titles in your search results that you didn’t write, then your site has been hacked.
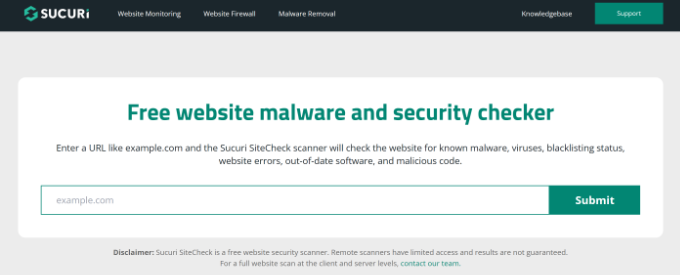
For hidden hacks like this, you should run a thorough scan of your site using a security tool like Sucuri.
It is a tool we trusted for years to find malicious code and unauthorized redirects that only show up for certain visitors, such as those on mobile devices.
You should also check Users » All Users in your dashboard to ensure no unauthorized admin accounts have been created.
If you suspect your site is infected, you will need to scan your core files, themes, and plugins to isolate the malware.
Warning: Cleaning your WordPress database and replacing core files are highly destructive actions. Always create a complete backup of your website before proceeding. This will allow you to restore your site if anything goes wrong.
If your scan reveals SEO spam, simply deleting the visible text on your pages won’t work.
You will need to clean your WordPress database, replace infected theme files with fresh copies, and reset all your passwords.
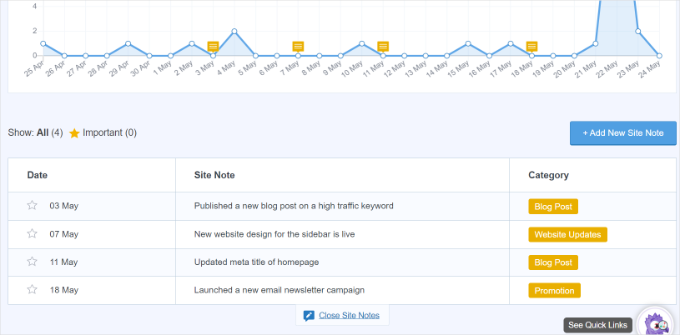
The best way to keep an eye on your progress is by using the Site Notes feature in MonsterInsights.
Adding a new note creates a clear timestamp on your Insights » Reports overview. You can even do this directly from the WordPress content editor the moment you hit ‘Update’ on a fixed page.
Checking this chart daily helps you see exactly when your traffic starts to trend upward again, proving that your fixes worked.
You can check your notes to see exactly what changed on that day.
For a detailed walkthrough on how to set this up, see our guide on how to get GA4 site annotations and notes in WordPress. It will show you how to manage your annotations, customize your categories, and add notes directly from your reports or the post editor.
Frequently Asked Questions About WordPress Traffic Drops
When your website traffic disappears, it is natural to have questions about what went wrong and how long it will take to see a recovery.
Here are some of the most common questions our readers ask about diagnosing and fixing traffic drops in WordPress.
1. How long does it take for website traffic to recover?
The recovery time depends entirely on the cause of the drop. If the issue was a simple technical error, such as accidentally blocking search engines in your WordPress settings, you may see your traffic return within a few days of fixing it.
However, if your site was affected by a major Google algorithm update, it can often take several weeks or even months of consistent content improvements before your rankings fully stabilize.
2. Can changing my WordPress theme or updating plugins cause a traffic drop?
Yes. Changing your theme can impact your traffic if the new theme is slower, lacks mobile optimization, or uses a different heading structure (like changing H1 tags to H2 tags). Similarly, plugin updates can sometimes cause conflicts.
This is why we recommend using the Site Notes feature in MonsterInsights to create a timeline of your changes, allowing you to easily see if a drop aligns with a specific update.
3. Can losing backlinks cause my traffic to drop?
Yes. Backlinks (links from other websites pointing to yours) are a major ranking factor for Google. If a high-authority website recently removed a link to your page, or if a site linking to you was penalized, your page might lose its ranking power.
You can use SEO tools to monitor your backlink profile and see if a sudden loss of links correlates with your traffic drop.
4. What if my traffic dropped, but my Google rankings stayed the same?
If your tracking is working and your rankings haven’t changed, but your traffic is still down, user behavior may have shifted. Sometimes, people simply stop searching for a specific topic due to changing seasons or passing trends.
You can plug your main keywords into a free tool like Google Trends to see if the overall public interest in your topic has naturally declined.
Moving Forward: Keeping Your WordPress Traffic Healthy
I hope this article helped you understand why your WordPress site lost traffic and how to get it back. Now that you’ve navigated the immediate crisis and gotten your traffic back on track, you’re in a much stronger position.
Use the lessons you learned here to keep your WordPress site healthy and growing. To help you build on this success and ensure your rankings stay strong, here are some additional resources:
The Ultimate WordPress SEO Guide – This is our most comprehensive roadmap to ensuring your site is fully optimized for search engines from top to bottom.
How to Monitor Your WordPress Website Server Uptime – Technical downtime is a silent killer of website traffic. This guide teaches you how to set up free automated alerts so you know the exact minute your site goes offline, allowing you to fix it before you lose visitors and SEO rankings.
Proper WordPress Update Order – Many traffic drops happen right after a messy update. This tutorial teaches you the exact order to safely update your core software, plugins, and themes to avoid breaking your site.
If you liked this article, then please subscribe to our YouTube Channel for WordPress video tutorials. You can also find us on Twitter and Facebook.
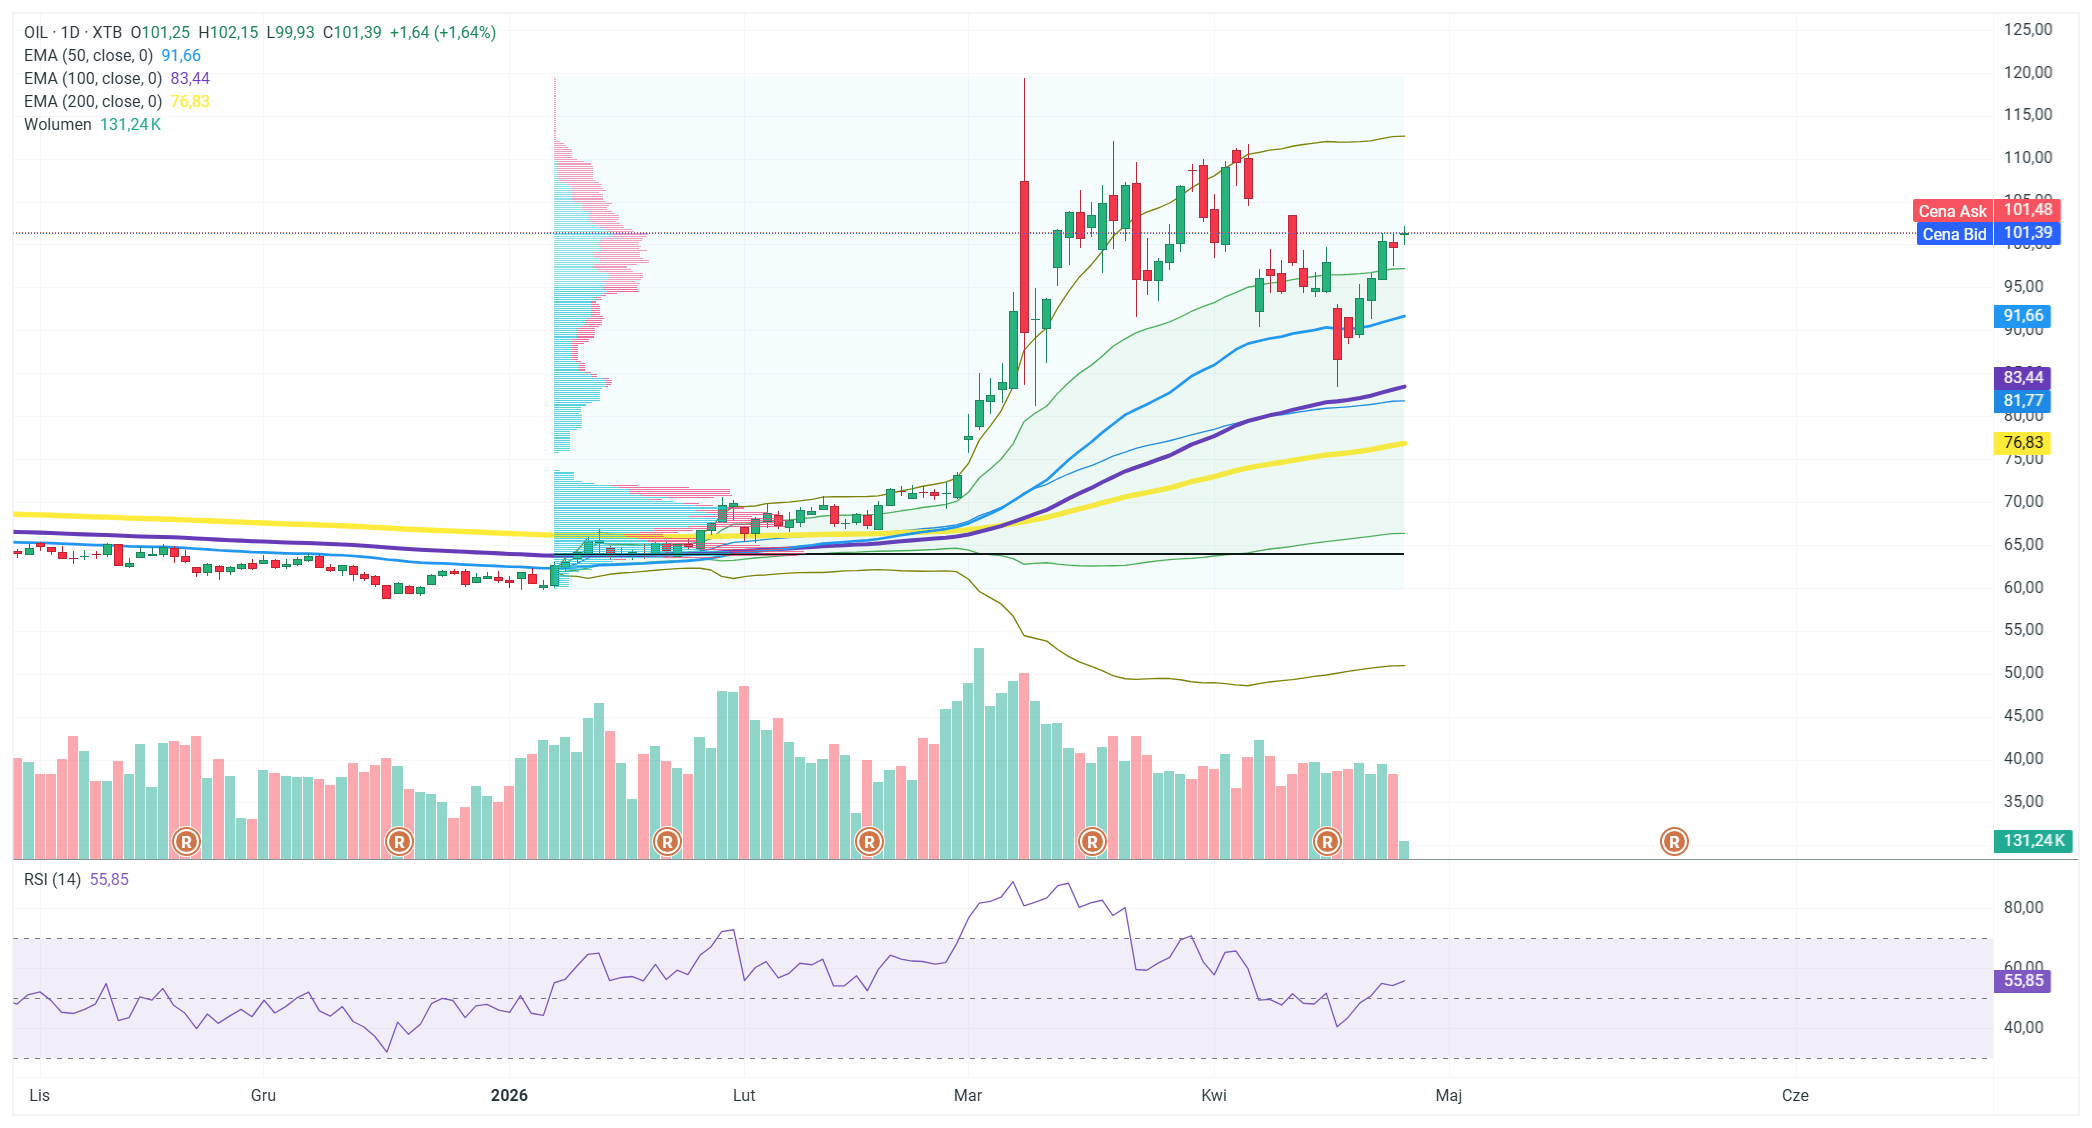
Brent crude opened the new week with gains, trading at $101.56 per barrel (+1.81%), with a daily high of $102.15. On the daily chart, the price has clearly moved away from key moving averages—the EMA50 stands at $91.66, the EMA100 at $83.44, and the EMA200 at $76.83—confirming the strong uptrend that has persisted for many weeks. The RSI(14) at 56.01 indicates moderate upward momentum, with no signs of the market being overbought. The geopolitical situation surrounding the Strait of Hormuz remains the main driver of oil prices.
Following visits to Pakistan and Oman, Iranian Foreign Minister Araghchi announced the continuation of consultations with the Sultanate regarding safe transit through the strait, which the market initially interpreted as a sign of de-escalation—WTI retreated from its daily high of $96.68 to around $95.35.
However, caution is warranted:
control over the Strait of Hormuz remains Tehran’s main bargaining chip, and it is difficult to expect Iran to relinquish it before securing concessions on the nuclear issue. Trump, for his part, has made it clear that he will maintain the naval blockade as a tool of pressure, and any “opening” of the strait would be, at best, a symbolic gesture by Iran in exchange for lifting the blockade. The key event of the day is the Situation Room meeting convened by Trump, the outcome of which could cause oil prices to spike.
Looking at the week as a whole, the oil market will react to decisions by the Fed, ECB, and BoE, as well as macroeconomic data (PCE, GDP, ISM), and any news from the Middle East could trigger sharp volatility in an already heated commodities market.
Peace talks stalemate, but hopes grow a deal can be found
Will Iran be forced to negotiate as oil storage reaches capacity?
US stocks priced for perfection, can Warsh news push them higher?
US stocks outperform Europe
Tech overtakes defense as top sector
Central bank meetings: are they still willing to look through the energy price spike as tensions persist?
Earnings to watch: big week for the Magnificent 7
The Week Ahead:
Central banks and earnings to distract from events in Middle East As we start a new week, we have a central bank bonanza to look forward to, including potentially the last FOMC meeting where Jerome Powell is chair, a Bank of Japan meeting, and an ECB and BOE meeting to digest. There is also a swathe of economic data releases, including the first reading of Q1 GDP in the US and ISM data for April, along with inflation data from the Eurozone, and money supply and house price data from the UK. However, the focus for markets will still be the news flow coming from the Iran conflict. Crude oil prices have climbed at the start of the week, and Brent is higher by more than 1.5% this morning and is above $106 per barrel. It had been above $107 per barrel earlier today, but it pared gains after reports that Iranian officials have proposed a new plan to the US to reopen the Strait of Hormuz. We need to hear from the US to see if this plan will bear fruit and reopen the Strait, but as the conflict drags on, investors are getting worried about the impact on energy prices. There are growing expectations that the oil price will remain higher for longer, as the blockade on the Strait enters its third week. Goldman Sachs has increased its Q4 oil price target to $90 per barrel, from $80, as disruption to production persists for the coming months.
Will latest Iran plan reopen the Strait?
Peace talks stalled at the weekend, and we need to hear whether the US will accept Iran’s proposal around the Strait. The most likely scenario is that more talks are scheduled to discuss this latest plan. The global economy will be counting on this latest proposal to finally open the Strait. Stock markets have been resilient so far to the blockade of the Strait, especially in the US. If there is no flow of traffic for another week, sentiment might show signs of weakening. Futures prices are pointing to a mildly positive open for the main European indices, and US futures prices are little changed, which suggests that investors remain optimistic that a solution can be found.
Will Iran be forced to negotiate as oil storage reaches capacity?
The longer the blockade lasts for the bigger risk there is to Iranian oil fields. They differ from other wells in the region because they work on low pressure. If they are shut down due to the blockade and a lack of storage, it could cause permanent damage to Iran’s energy infrastructure. Estimates of Iran’s oil storage are around 20 million barrels, this means that Iranian storage facilities could reach capacity in the next few days. If this happens, then the Iranian regime might be compelled to negotiate with the US and find a way to reopen the Strait of Hormuz.
US stocks priced for perfection, can Warsh news push them higher?
The S&P 500 and the Nasdaq are priced for perfection, both US indices closed at record highs at the end of last week on hopes that the US and Iran would restart talks at the weekend. Although the talks failed to materialize, we doubt that stock markets will fall sharply, as there is expectation that talks will resume soon. Markets could also be cheered by the news that the Department of Justice dropped a criminal investigation into the Chair of the Federal Reserve Jerome Powell. Senator Thom Tillis also said on Sunday that he would support President Trump’s pick to be Fed chair, Kevin Warsh.
This means that Warsh’s confirmation to lead the Federal Reserve after Jerome Powell steps down in May, is all but assured. Now that Warsh has a clear path to replacing Jerome Powell, it reduces the chance of President Trump firing Powell, who had promised to stay on as Fed chair on an interim basis, until a new chair was voted into position. This could have led to fears about Fed independence, and weighed on US Treasuries, and market sentiment more broadly.
With that risk now eradicated, the focus will be on what Fed chair Powell does after his term expires next month. He remains a voting member of the Fed until 2028, without the threat of prosecution hanging over him, will he opt to retire? If so, this will mean that President Trump can choose another member of the FOMC board. Trump does not hide his preference for rate cuts, so there could be some expectation of a dovish shift at the Fed in the coming months, which may bolster risk sentiment in the short term.
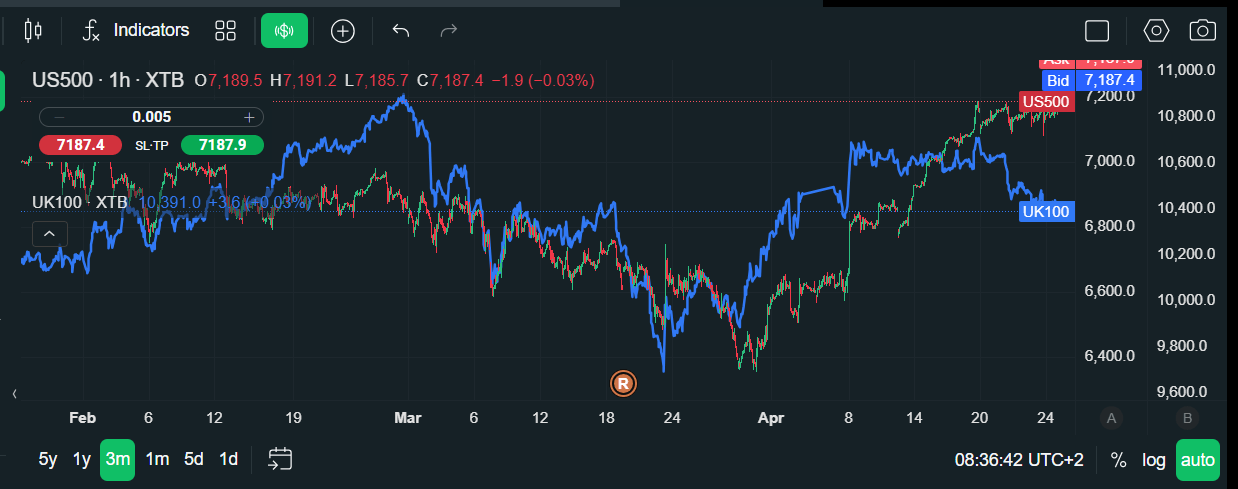
US stocks outperform Europe
This may also help US stocks to continue to outperform their European counterparts. The Nasdaq closed higher by nearly 2% on Friday, led by Intel, which jumped 23% after a positively received earnings report that cements its position as a key AI player in 2026. The Nasdaq rose by 2.4% last week, the S&P 500 was higher by 1.28%.
This compares with a 2% decline for the FTSE 100 and a 0.1% drop for the Dax. Tech is leading the market higher in the US, and the issue for Europe is that it is light on tech. The European market is also a growth taker market, this means that it relies on strong global growth and global themes to drive returns. With the oil price remaining elevated, and global growth threatened, this will limit European stock market upside. In contrast, US tech is rising on the back of lower interest rates, a falling oil price, continued AI spend and hopes that the AI theme has further to run.
Chart 1: S&P 500 vs. FTSE 100
Source: XTB
Tech overtakes defense as top sector
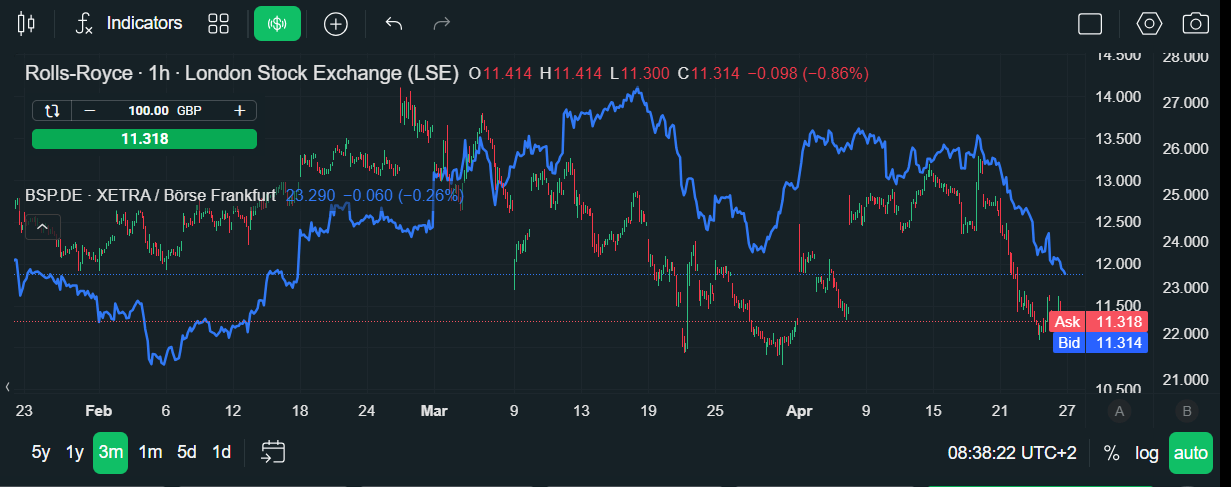
The top performers on the Nasdaq last week were solid AI names. Chipmakers Arm Holdings and AMD were the top two performers last week, rising 40% and 23% respectively. In contrast, defense stocks have been sold off as investors have rotated back into tech, and Lockheed Martin was the weakest performer on the S&P 500 last week, falling 3%. This is another reason why European indices are underperforming their US counterparts; they have several defense names that are coming under pressure. In the UK, Rolls Royce and BAE Systems both fell more than 9% and acted as a major drag on the FTSE 100.
Rheinmetall also dropped 11% last week and hindered the Dax index. US stocks are also benefitting from a strong earnings season. Of the 28% of companies in the S&P 500 that have reported earnings, 84% have reported earnings that were higher than expected, which is above the 5-year and the 10-year averages. There have been upside-earning surprises for the financial, industrial, communication services, and the tech sectors. These have balanced out earnings misses from the energy sector. Ironically enough, the energy sector has been a drag on the US index this year, however, that is unlikely to last into Q2 after the massive surge in the oil price.
Chart 2: Rolls Royce and BAE Systems fall out of favour even though the conflict in the Middle East is ongoing
Source: XTB
Earnings will be a key theme in the coming week, as five of the Magnificent 7 report. Below we look at two key themes that will drive price action in the coming days.
1, Central bank meetings
There is a whole suite of central bank meetings coming up this week, including the Fed, the BOJ, the ECB and the BOE. Analysts do not expect there to be any major change to rates this week from these meetings, and we may need to wait until May/June before central bankers will give their updated view on forward guidance. Energy prices remain elevated and there are concerns that supply chain disruption will increase stagflationary risks as the Strait of Hormuz has remained effectively closed for the best part of 2 weeks now. Investors will be scrutinizing central bankers’ views on the ongoing blockade and what it means for the future of policy and markets are likely to be extremely reactionary to these meetings, especially around the Fed meeting and the BOE meeting on Thursday.
This is likely to be the final meeting for Fed chair Jerome Powell. No new forecasts or Dot Plots are expected, which leaves asset prices vulnerable to the Fed’s views on the growth concerns versus inflation considerations. The market still expects the Fed to cut interest rates this year, and Warsh at the helm of the Fed is expected to reinforce the view that rate cuts are likely in the US by year end. For now, rates are on hold, but signs that the Fed will look through this period of elevated energy costs could boost sentiment in a market that is already optimistic about the future. In the Eurozone, the ECB is also expected to remain on hold, however, the ECB could be more focused on the inflationary impact from the war due to its single mandate for price stability, and the fact that the Eurozone is an energy importer and could import inflation due to this price spike.
A rise in inflation is expected across the currency bloc in April, and this could focus minds on the need to hike rates later this year if the Strait of Hormuz does not reopen soon. The BOE will also announce its latest policy decision on Thursday. The market expects two rate cuts from the BOE this year, and it will be interesting to see if the Governor reacts to market expectations. So far, although inflation has risen in March, growth has held up well, including stronger retail sales and a drop in the unemployment rate. However, we think that the governor will take a cautious stance as the underlying UK economy remains weak, and rising energy prices could knock it even further. A hike could be coming if we see second round inflation effects like rising wages, however, there is no sign of that so far, and UK wages are at their lowest level in 5 years.
2, Earnings to watch
There are 160 S&P 500 members reporting earnings this week, including Meta, Apple, Amazon, Alphabet and Microsoft. General Motors and Robinhood will also be highlights. The biggest tech firms have a high bar to clear, given that there remains lingering concerns in the market about AI spending and investments. These companies need to show that revenues justify the level of capex the companies want to spend. Added to this, their stock prices have already rallied into earnings season, and they have all seen gains of more than 10% this month, with Apple rising 6%. Alphabet is expected to report revenue growth of more than 20% YoY.
There are expectations that the company will report improving monetization from its AI expenditure, particularly with greater uptake of Gemini. The risks to its earnings report are fears about future profit margins, and concerns about capex plans. Alphabet’s stock price tends to rally on the back of earnings reports, with an average gain of 1.3%. Meta will also report results on Wednesday evening. Earlier in the year, Meta’s share price jumped after it reported stronger forward guidance, we will now see if Meta can deliver. YoY revenue growth is expected to be strong, and $55.5bn is expected. The company has beaten earnings expectations in every quarter for the last three years, so expectations are high that they will do so again. Investors want to see bottom line gains from its massive AI expenditure, and a clear strategy about what Meta’s newest AI mode, its Muse Spark, will do and how it will enhance customer experience at the tech giant.
Wednesday is heaving with earnings, as Meta also reports results. Microsoft has had a tough 2026 so far, and is down 12% YTD, after a tough Q4 earnings report and underwhelming earnings guidance. This quarter could be about redemption. The company is expected to report double-digit earnings growth for Q1 relative to a year ago. Its share price is higher by 12% in the past month, as excitement comes back to the market about the AI theme. On average, Microsoft’s shares tend to flatline during earnings reports, so hopes are high that this earnings report can buck the trend. Apple is also in focus, however, it won’t just be revenues that investors want to hear about.
We have already heard that Tim Cook is stepping down in September and John Ternus will succeed him. The company is expected to report revenues of $109.45bn for last quarter, but investors may want to get some sense of what Ternus will bring to Apple when he takes over later this year. Will he push Apple down the AI route, something Cook was unwilling to do? Apple is also known for its shareholder sweeteners, and share buybacks and dividends could also be on the cards. This may boost enthusiasm for the stock, which is basically flat YTD.
To provide the best experiences, we use technologies like cookies to store and/or access device information. Consenting to these technologies will allow us to process data such as browsing behavior or unique IDs on this site. Not consenting or withdrawing consent, may adversely affect certain features and functions.
Functional
Always active
The technical storage or access is strictly necessary for the legitimate purpose of enabling the use of a specific service explicitly requested by the subscriber or user, or for the sole purpose of carrying out the transmission of a communication over an electronic communications network.
Preferences
The technical storage or access is necessary for the legitimate purpose of storing preferences that are not requested by the subscriber or user.
Statistics
The technical storage or access that is used exclusively for statistical purposes.The technical storage or access that is used exclusively for anonymous statistical purposes. Without a subpoena, voluntary compliance on the part of your Internet Service Provider, or additional records from a third party, information stored or retrieved for this purpose alone cannot usually be used to identify you.
Marketing
The technical storage or access is required to create user profiles to send advertising, or to track the user on a website or across several websites for similar marketing purposes.