USD/JPY edges up to near 159.32 as the Japanese Yen trades with caution.
Tokyo CPI ex. Fresh Food grew at a moderate pace of 1.3% YoY in May.
Japan’s FM Katayama warned that authorities could intervene in the forex market to counter excessive volatility.
The USD/JPY pair trades marginally higher to near 159.32 during the Asian trading session on Friday. The pair edges up as the Japanese Yen (JPY) trades cautiously, following the release of the Tokyo Consumer Price Index (CPI) data for May and verbal intervention warning from Japan’s Finance Minister (FM) Satsuki Katayama.
Tokyo’s CPI ex. Fresh Food, which is closely tracked by Bank of Japan (BoJ) officials, arrived lower at 1.3% Year-on-Year (YoY), lower than estimates and the previous reading of 1.5%. The CPI data ex. Fresh Food stayed below the BoJ’s 2% target for a fourth straight month as fuel and education subsidies offset rising raw material costs from the U.S.-Israeli war on Iran, Reuters reports.
Meanwhile, Japan’s FM Katayama warned that authorities could intervene in the foreign exchange (Forex) market to counter excessive volatility against the Japanese Yen.
As of writing, the US Dollar Index (DXY), which tracks the Greenback’s value against six major currencies, trades slightly higher to near 99.00, but is close to Thursday’s low, which is 98.95.
On Thursday, the US Dollar faced a sharp selling pressure after media reports that a deal between the United States (US) and Iran has been prepared and only needs approval from President Donald Trump.
USD/JPY technical analysis
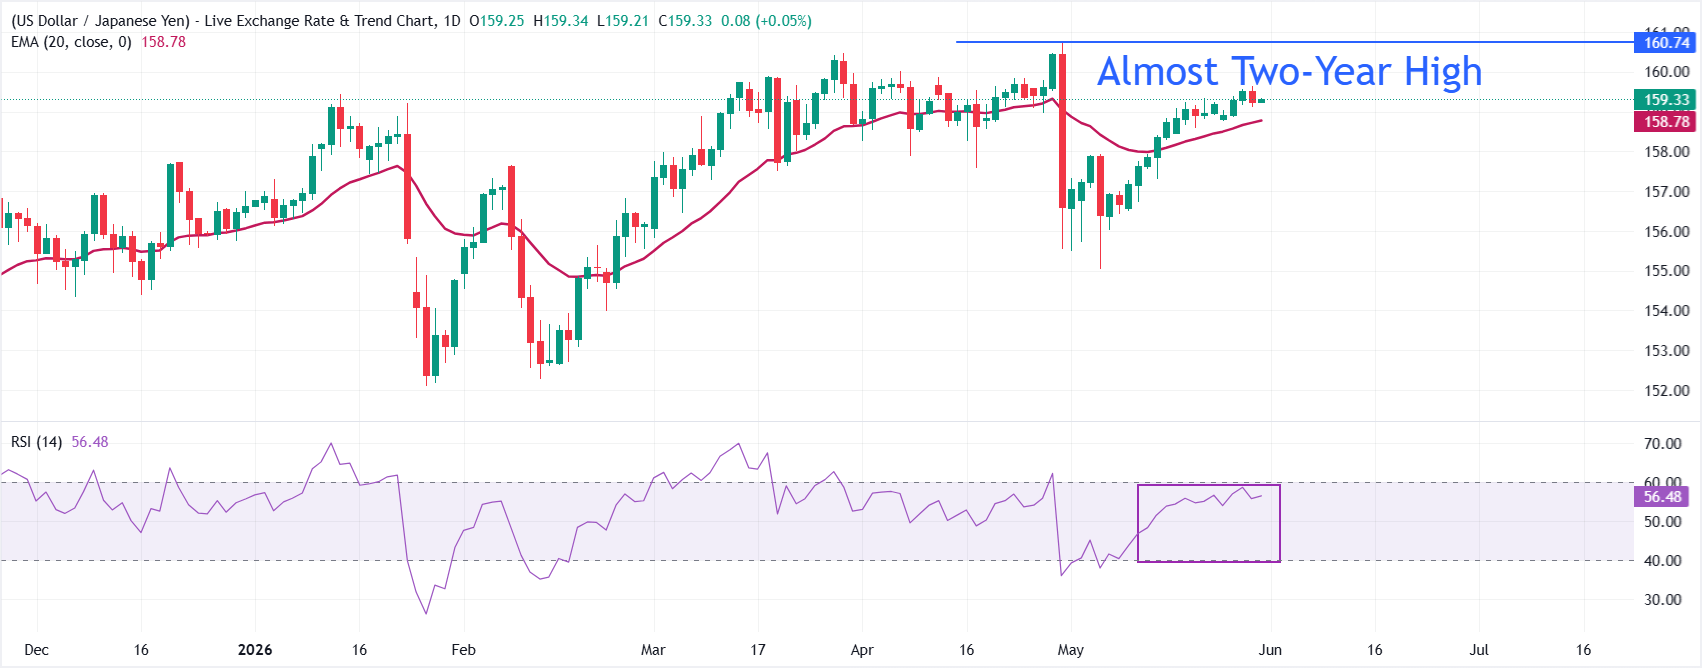
USD/JPY ticks higher at around 159.32 in the Asian trade. The pair holds a constructive bullish bias as spot remains above the 20-day exponential moving average (EMA) at 158.78, keeping the short-term trend underpinned despite recent volatility.
The Relative Strength Index (RSI) near 56 suggests moderate upside momentum rather than overbought conditions, allowing room for further gains while price stays supported above the EMA.
On the downside, immediate support is seen at the 20-day EMA around 158.78, where buyers are likely to defend the short-term uptrend; a decisive break below this area would expose a deeper corrective move towards the May 6 high at 157.94. Looking up, the pair aims to revisit an almost two-year high at 160.74
The offshore yuan steadied around 6.76 per dollar on Friday, hovering near its strongest level since February 2023, bolstered by reports of an extended ceasefire agreement between the US and Iran. Both sides agreed to prolong the truce for another 60 days to allow further negotiations over Tehran’s nuclear program, although US President Donald Trump has yet to formally approve the arrangement. Meanwhile, China’s currency has drawn additional support from the global AI investment boom, which has fueled demand for Chinese technology exports and eased concerns in Beijing over yuan appreciation. For the month, the yuan remains on track for a second consecutive monthly gain despite continued weaker-than-expected daily midpoint fixings from the People’s Bank of China, as investors navigated rapidly shifting developments surrounding the Iran conflict while also assessing progress following the meeting between Presidents Donald Trump and Xi Jinping earlier this month.
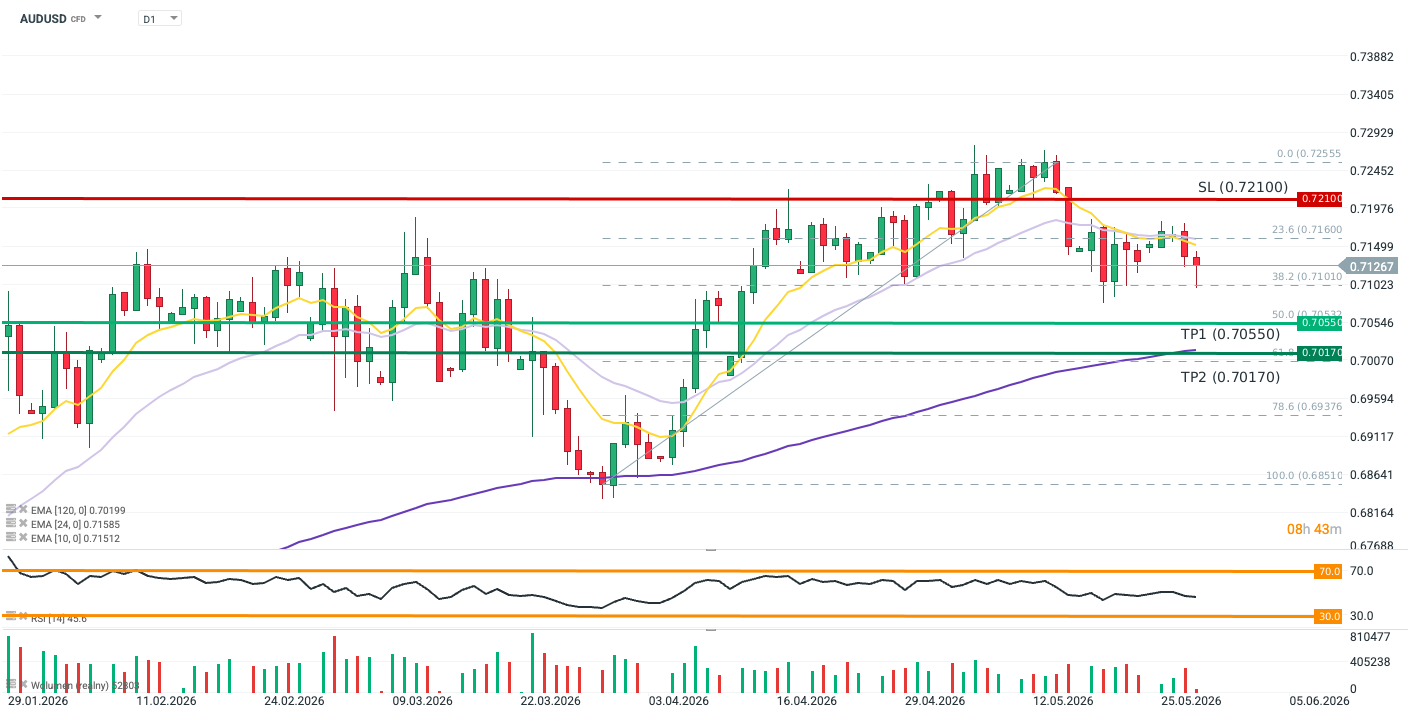
The AUDUSD pair erased some of its losses from today’s session following the release of the latest US inflation data, which turned out slightly softer than expected. Core PCE increased in line with expectations to 3.3% year-on-year, while on a month-on-month basis, prices rose by 0.2% (against a 0.3% forecast). However, the lack of a negative inflation surprise is not exactly “good news” for monetary policy, especially since inflation remains in an upward trend and is proving to be stickier than assumed. The Fed’s narrative is also becoming increasingly hawkish. Recent remarks from Cook, Goolsbee, Kashkari, and Jefferson unanimously emphasize the growing and materializing upside risks to inflation, along with a clear readiness to hike interest rates should this trend continue.
Furthermore, the AUDUSD’s reaction to the optimism generated by hopes of a truce between Iran and the US last week was quite moderate, and the gains were insufficient to push the price above the 10- and 30-day exponential moving averages. Therefore, risk-sensitive currencies (including the AUD) can be expected to remain under heavy pressure until real progress is made in the Middle East, and a potential rebound in reaction to the end of the war is unlikely to trigger a rapid return to an upward trend for the pair. The options market is also pointing to further declines for AUDUSD. The 1-week and 1-month risk reversal indicators sit below zero, showing that options betting on the depreciation of the AUD dominate the market. In other words, the market is systematically hedging against further declines in AUDUSD consistently across various time horizons.
Methodology
The recommendation was prepared based on the technical analysis of the AUDUSD chart and the fundamental analysis of the discussed economies (monetary policy in Australia and the US). The direction of the recommendation was determined using moving averages and market expectations regarding central bank policies. Take Profit and Stop Loss levels were set using the Fibonacci retracement of the last upward wave and price action (TP1 at the 50.0 Fibo level, TP2 between the D1 interval EMA100 and the 61.8 Fibo level, and SL at the support from which the price rebounded before breaking the last peak).
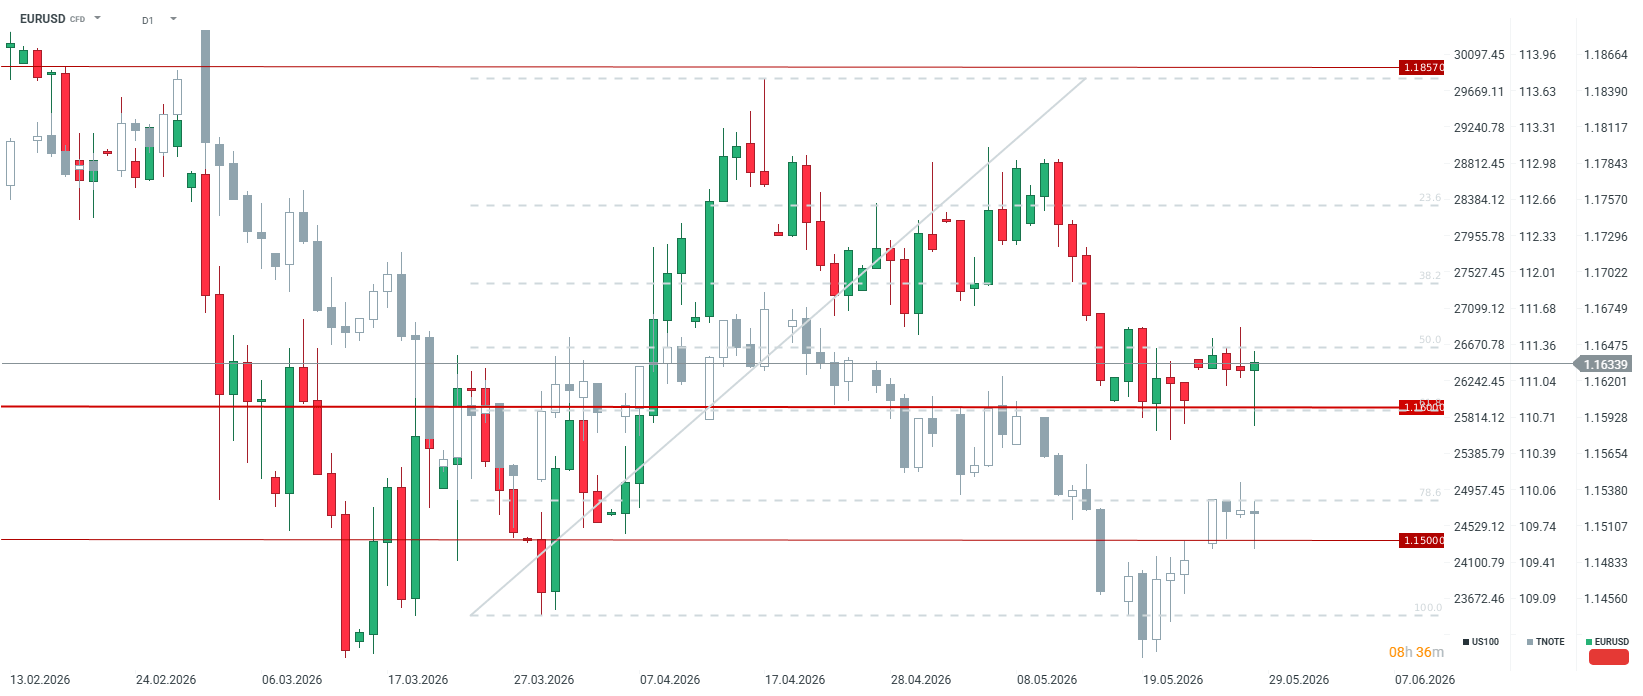
Weaker US data, in-line inflation, hawkish ECB minutes, and increased Iranian compliance trigger a sharp rebound in the EURUSD pair. A noticeable shift has taken place in the financial markets over the last few hours. The exchange rate of the major currency pair, EURUSD , recorded a sharp rebound after earlier, steeper declines briefly pushed it below the 1.16 level. The euro is currently gaining around 0.1% against the US dollar, trading around the 1.1630 mark. This move stems from a combination of disappointing macroeconomic data from the US, hawkish signals from the European Central Bank, and new developments on the geopolitical front.
Weaker US Macro Data and Inflation Relief
The main catalyst for the weakening of the greenback came from the latest macroeconomic releases from across the Atlantic, which cooled investors’ hawkish fears:
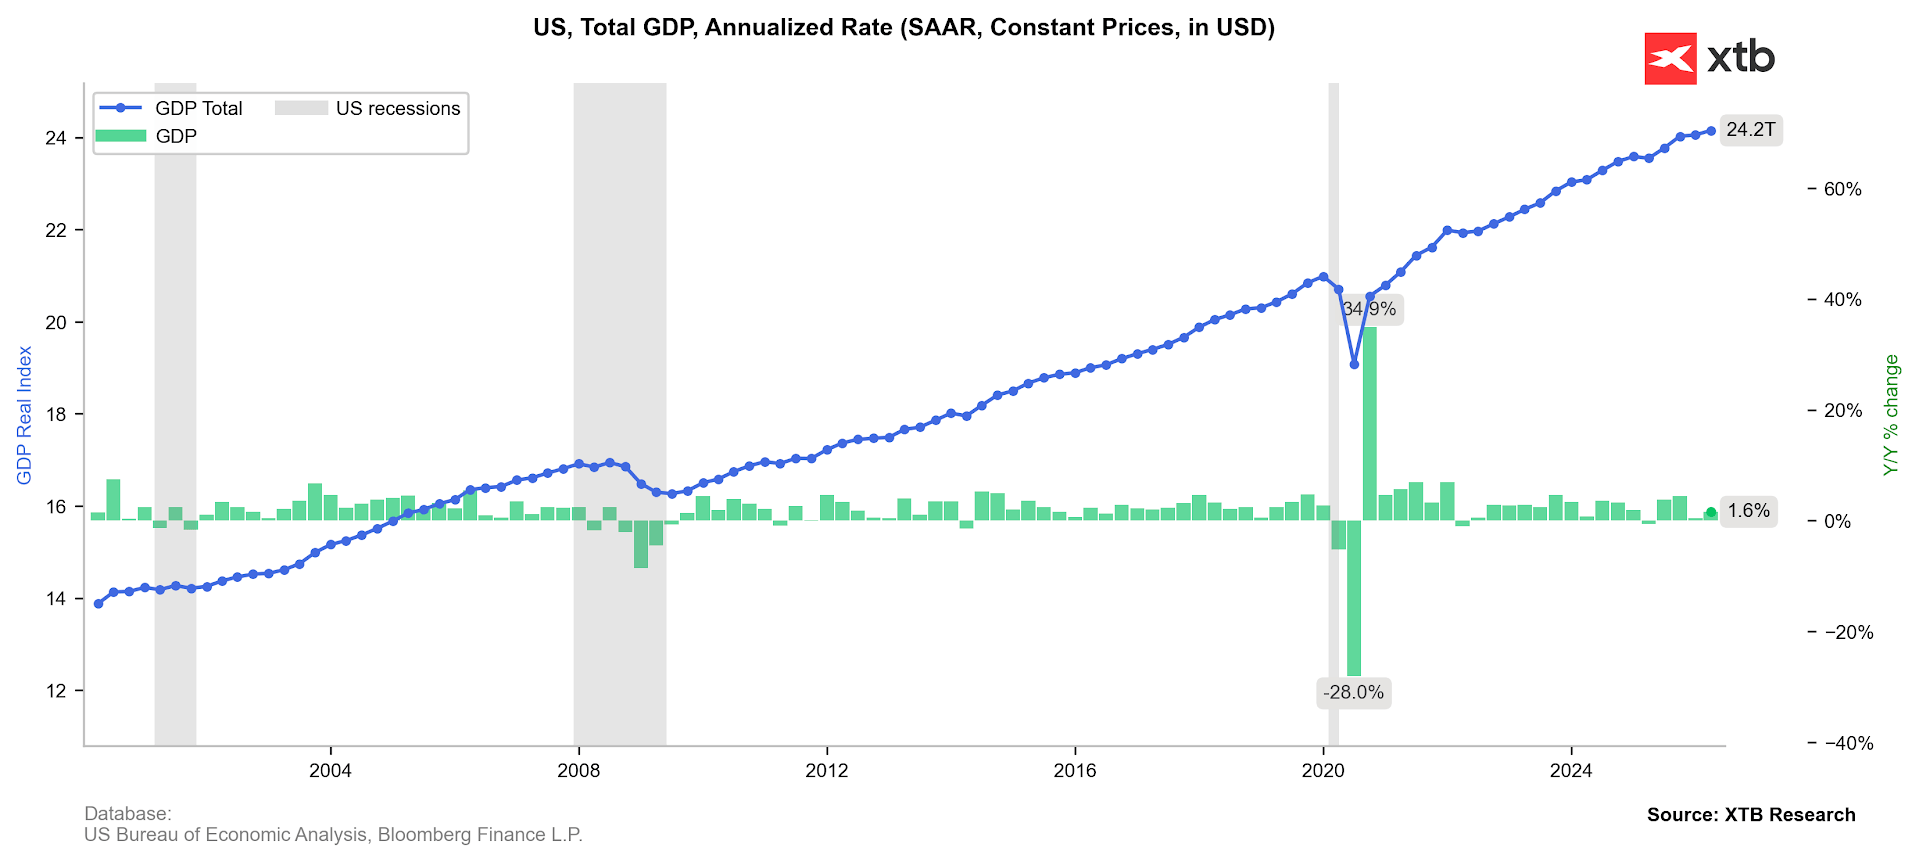
Disappointing GDP Growth: The US Bureau of Economic Analysis published its second revision of Q1 GDP, lowering the economic growth estimate to 1.6% from the previous 2.0%. The market widely expected the figure to hold steady at 2.0%.
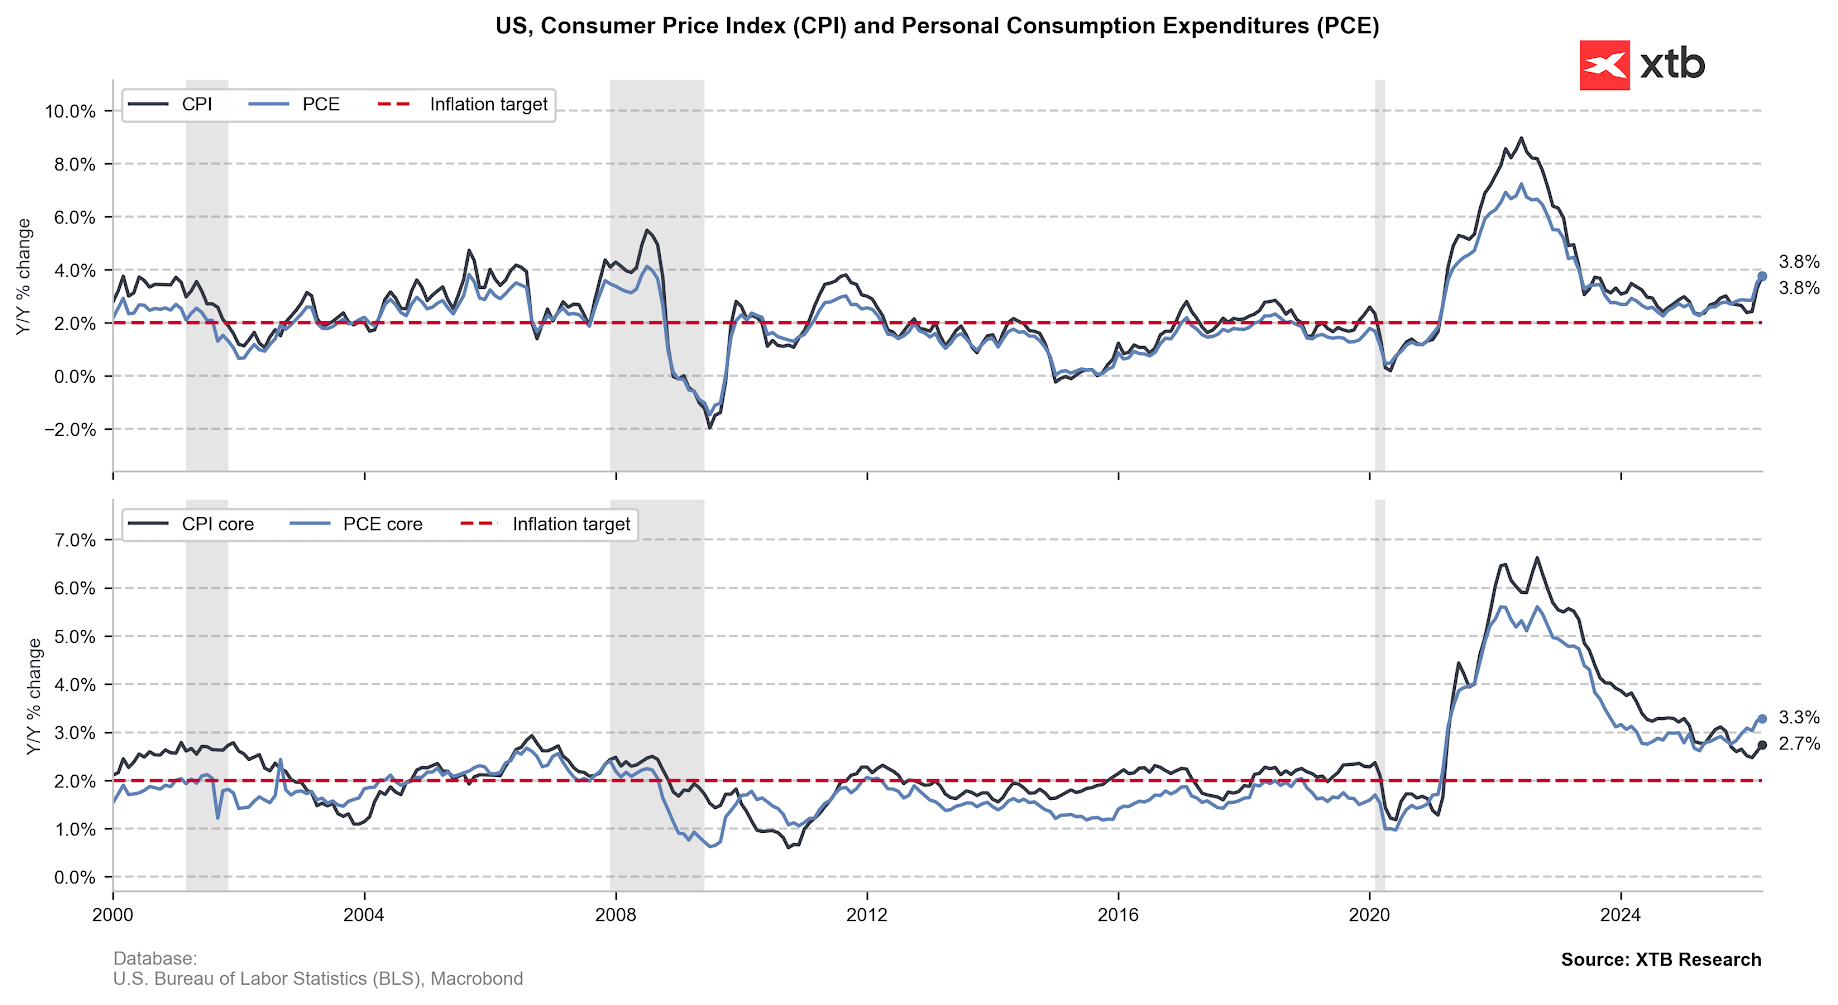
PCE Inflation In-Line with Expectations: The headline Personal Consumption Expenditures (PCE) price index, the Fed’s preferred inflation gauge, rose to 3.8% year-over-year in April (up from 3.5% in March), which was fully in line with market consensus.
Core PCE Stabilization: The Core PCE index (excluding food and energy prices) came in at 3.3% annually, also matching expectations. Furthermore, on a monthly basis, core inflation increased by 0.2%, coming in slightly below forecasts of 0.3%.
The Q1 GDP revision shows lower economic growth. The fact that the conflict with Iran was already underway in March may suggest that Q2 data will also face a substantial negative impact from this front. Source: Bloomberg Finance LP, XTB
PCE inflation rebounds in line with expectations. This stands in stark contrast to the CPI inflation release, which surprised investors with noticeably higher readings. Source: Bloomberg Finance LP The fact that inflation did not surprise to the upside, despite a massive surge in commodity prices, brought relief to investors. Combined with the clear slowdown in GDP momentum, this translated into a decline in the dollar index. In-line inflation and weaker growth could damp market expectations regarding swift rate hikes from the Fed.
Hawkish ECB and Pressure on the Eurozone
While the US economy sends signs of cooling, information supporting the common currency is flowing in from Europe. The published account of the European Central Bank’s April meeting (the so-called minutes) clearly indicates that pro-inflationary risk factors in the Eurozone have significantly intensified. ECB officials highlighted mounting price pressures, suggesting that the European regulator may be forced to keep interest rates at restrictive levels for a longer period. The divergence in monetary policy outlooks between a potentially softer Fed and an inflation-wary ECB provided a strong impetus for the strengthening of the EURUSD.
The market is currently pricing in a staggering 93% probability of an ECB hike in June . Geopolitics: Sanctions and a Potential Nuclear Breakthrough Concurrently, market attention remains focused on the Middle East. Energy commodity prices rose amid renewed clashes between US and Iranian forces in the Persian Gulf region. WTI crude oil surged by over 3% during the morning European session. The situation was further exacerbated by the decision of US Treasury Secretary Scott Bessent, who announced sanctions against a new Iranian institution that had unilaterally declared control over the Strait of Hormuz. However, market sentiment improved following reports from Saudi Arabia’s Al Hadath news channel. According to these reports, Islamabad is set to propose a compromise to Washington under which Iranian uranium would be transferred to Beijing under strict international supervision. Such a diplomatic move could significantly de-escalate the regional conflict, shaving some risk premium off the markets and dampening the safe-haven demand for assets like the dollar. On the other hand, Trump recently stated that he does not want to agree to Iranian uranium ending up in either Russia or China.
Technical Outlook on EURUSD
The combination of lower-than-expected US economic growth data, a hawkish tone from the ECB, and a potential diplomatic breakthrough regarding the Iranian nuclear program provided solid ground for a sharp EURUSD rebound. Investors gained arguments suggesting that the US central bank will not be forced into immediate policy tightening. The EURUSD closing with such a pronounced candlestick shadow could suggest that key support at the 1.16 level is holding, creating the potential to test resistance at the 50.0% retracement level .
Geoff Yu at BNY highlights that Canadian Dollar (CAD) dynamics differ from the U.S., with equity-based rebalancing pointing toward CAD support as growth and allocation trends move opposite to the US Dollar. Fixed income steepening and poor CAD performance are seen amplifying CAD buying signals, suggesting some relief for the Canadian Dollar into month-end.
Canadian Dollar supported by flows
“Mathematically, our figures suggest that the unwinding of USD/CAD hedges – the discontinuation of forward USD selling against CAD on U.S. positions – played a big role in the dollar’s performance and some reversion is needed.”
“The only other equity-based rebalancing signal is in the CAD, where growth and asset allocation trends are pointing in the opposite direction.”
“In contrast, CAD buying is being amplified by similar steepening in bond markets on top of poor currency performance.”
“USD and CAD have again generated the same net selling and buying signals, though the dollar’s signal is far weaker, as poor bond performance offset dollar purchases. In contrast, CAD buying is being amplified by similar steepening in bond markets on top of poor currency performance.”
The British Pound recovers almost half of its early losses against the US Dollar.
Middle East tensions re-escalate due to the exchange of attacks between the US and Iran.
10-year UK gilt yields have remained lower in the past few weeks due to easing hawkish BoE bets.
The British Pound claws back half of its early losses and rebounds to near 1.3400 against the US Dollar (USD) during the European trading session on Thursday from the intraday low of 1.3367. The recovery move in the GBP/USD pair appears to be short-lived as Middle East conflicts have re-escalated.
At press time, S&P 500 futures and Asian stock markets have also recovered significantly. The US Dollar Index (DXY), which tracks the Greenback’s value against six major currencies, retreats from its intraday high of 99.54, but is still 0.18% higher to near 99.40. A slight correction in the WTI Oil price has also been observed from the day’s high of $91.17 to near $90.14.
Geopolitical tensions in the Gulf region have been reignited due to the exchange of attacks between the United States (US) and Iran. Earlier in the day, Iran’s Islamic Revolutionary Guard Corps (IRGC) said that it attacked US military bases in retaliation against Washington’s strikes near Bandar Abbas airport.
This was the second attack by the US this week after the so-called “defensive strikes” on Iranian boats deploying mines and their missile launching sites.
Meanwhile, United Kingdom (UK) gilt yields have also recovered strongly after a weak opening due to Middle East concerns. 10-year UK gilt yields have rebounded to near 4.87% from the day’s low of 4.81%.
UK gilt yields have been declining in the past few weeks due to easing hopes of a near-term Bank of England (BoE) interest rate hike. Traders have pared hawkish BoE bets lately due to weakening job market conditions and lower household spending.
EUR/GBP struggles to extend gains beyond 0.8660 but remains steady above 0.8650.
Risk appetite has faltered on Thursday as the US and Iran exchange attacks.
ECB-BoE monetry policy divergence keeps the pair buoyed.
The Euro (EUR) is trading flat against the British Pound (GBP) on Thursday. EUR/GBP bulls are struggling to find acceptance above 0.8660 following a 0.4% rally over the previous two days, although downside attempts remain contained above 0.8655 so far.
Speculative demand for the common currency is faltering on Thursday as market sentiment sours and Oil prices jump with tensions between the US and Iran escalating again.
The US military launched fresh strikes on Iranian military sites in the province of Bandar Abbas that, according to the US Central Command (Centcom), “posed a threat around the Strait of Hormuz.” Iran’s Islamic Revolutionary Guard Corps (IRGC) affirmed that they targeted US bases in the Gulf region, and Kuwait authorities reported interceptions of hostile drone and missile attacks.
ECB-BoE monetary policy divergence
The Euro, however, remains fairly steady, favoured by monetary policy divergence between the European Central Bank (ECB) and the Bank of England (BoE). Futures markets are pricing a 91% chance that the ECB will hike interest rates at its June 11 meeting, according to data by the ECB Watch Tool. The BoE, on the contrary, is not expected to tighten its monetary policy anytime soon.
The ECB Chief Economist, Philip Lane, warned on Thursday that inflationary consequences from the US-Iran war will outlast the conflict and that the bank must prevent the general belief that inflation will remain high for a long time to take hold.
Later on Thursday, ECB President Christine Lagarde is expected to take part in a central bankers’ meeting, and her comments on monetary policy will be listened to with particular interest.
EUR/JPY weakens to around 185.10 in Thursday’s early European session.
The cross keeps the bullish vibe, but further consolidation cannot be ruled out in near term with neutral RSI momentum.
The immediate resistance to watch is 185.65; the initial support level is seen at 184.70.
The EUR/JPY cross loses momentum to near 185.10 during the early European session on Thursday. Escalations in the US-Iran conflict boost the safe-haven currency, such as the Japanese Yen (JPY) and act as a headwind for the cross.
CNN reported on Thursday that Iran’s Islamic Revolutionary Guard Corps (IRGC) launched an attack targeting an American air base, which they said was the source of US strikes on Iranian targets hours before. The US strikes targeted Iranian drones and a launch site near the Strait of Hormuz.
Traders will keep an eye on the Tokyo May Consumer Price Index (CPI) inflation report, which is due later on Friday. In case of a softer-than-expected Tokyo CPI print, this could drag the Japanese Yen lower against the Euro (EUR) in the near term.
Technical Analysis:
In the daily chart, EUR/JPY holds a mild bullish bias as it trades above the 100-day simple moving average and the Bollinger Bands middle line near 184.71, keeping the broader uptrend underpinned. The Relative Strength Index (RSI) hovers around 50, suggesting consolidative but still slightly constructive momentum while price drifts toward the upper Bollinger band.
On the topside, the immediate resistance is the Bollinger upper band around 185.65, and a clear break above this ceiling would open the way for a renewed extension of the advance. On the downside, initial support is seen at the Bollinger middle band near 184.70 and the 100-day SMA at 184.40, with the lower Bollinger band near 183.78 acting as a deeper cushion if a corrective pullback develops.
To provide the best experiences, we use technologies like cookies to store and/or access device information. Consenting to these technologies will allow us to process data such as browsing behavior or unique IDs on this site. Not consenting or withdrawing consent, may adversely affect certain features and functions.
Functional
Always active
The technical storage or access is strictly necessary for the legitimate purpose of enabling the use of a specific service explicitly requested by the subscriber or user, or for the sole purpose of carrying out the transmission of a communication over an electronic communications network.
Preferences
The technical storage or access is necessary for the legitimate purpose of storing preferences that are not requested by the subscriber or user.
Statistics
The technical storage or access that is used exclusively for statistical purposes.The technical storage or access that is used exclusively for anonymous statistical purposes. Without a subpoena, voluntary compliance on the part of your Internet Service Provider, or additional records from a third party, information stored or retrieved for this purpose alone cannot usually be used to identify you.
Marketing
The technical storage or access is required to create user profiles to send advertising, or to track the user on a website or across several websites for similar marketing purposes.