The Australian Dollar edges up against the US Dollar despite multiple headwinds.
Middle East war may last longer due to US attacks on Iranian infrastructure.
The FOMC minutes show that several policymakers see the need for monetary policy tightening.
The Australian Dollar (AUD) trades marginally higher at around 0.6935 against the US Dollar (USD) during the European trading session on Thursday. The Aussie pair edges up as the US Dollar ticks lower despite escalating Middle East risks and hawkish Federal Open Market Committee (FOMC) Minutes of the June policy meeting.
At press time, the US Dollar Index (DXY), which gauges the Greenback’s value against six major currencies, trades 0.13% lower to near 100.92.
The attacks on Iranian infrastructure by United States (US) military forces signal that the restart of the war would last long, a scenario that might keep oil prices higher and the appeal of safe-haven assets upbeat. According to Axios, the US Air Force bombed two railway bridges in Iran on Wednesday.
Meanwhile, the FOMC Minutes showed on Wednesday that policymakers are concerned about upside inflation risks and several of them see the need to tighten monetary conditions to ease price pressures.
In the Australian region, traders might consider raising hawkish Reserve Bank of Australia (RBA) bets again as Assistant Governor Sarah Hunter has reiterated that the central bank would act, if needed, for inflation to return to target and maintain sustainable full employment.
Lately, traders pared hawkish RBA bets as the Australian monthly Consumer Price Index (CPI) has cooled down in the last two months.
AUD/USD technical analysis
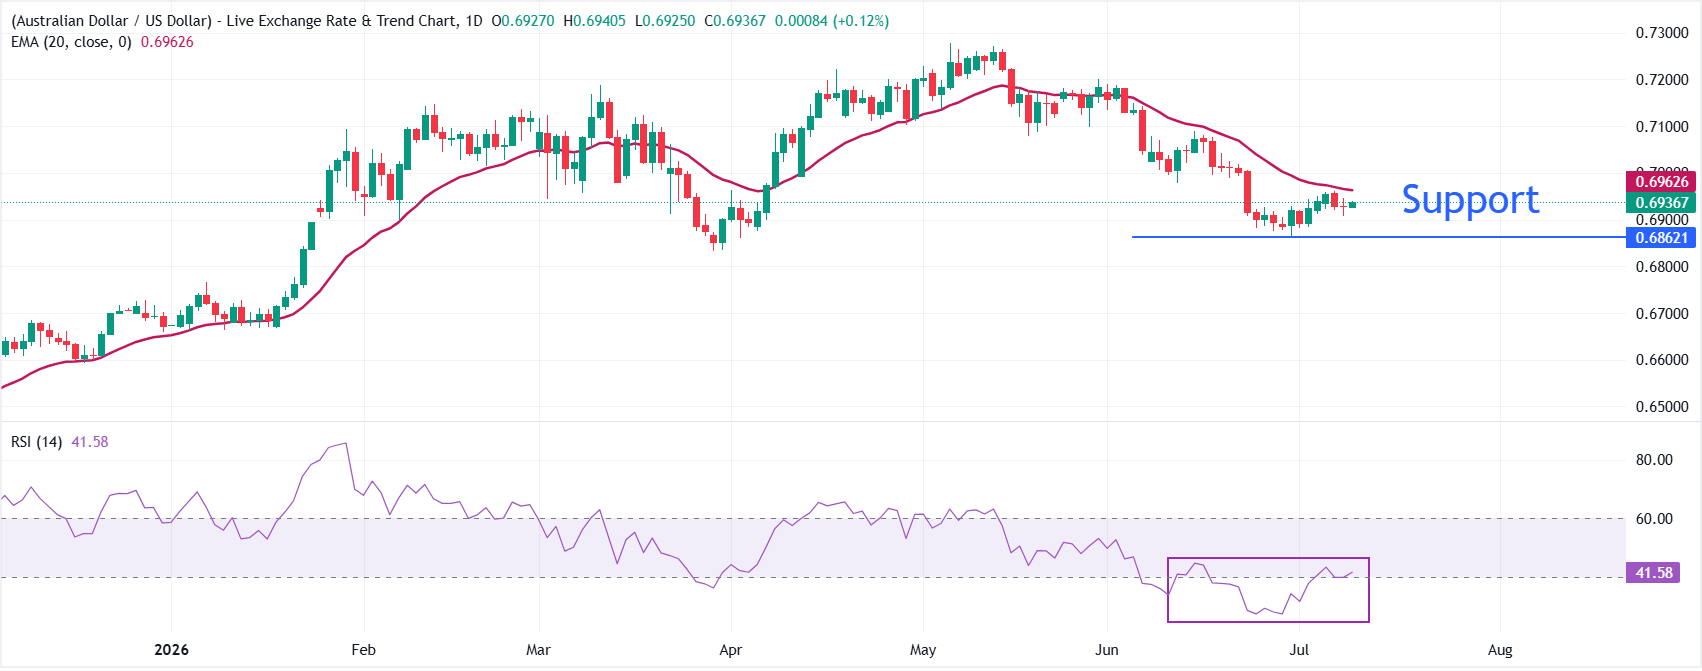
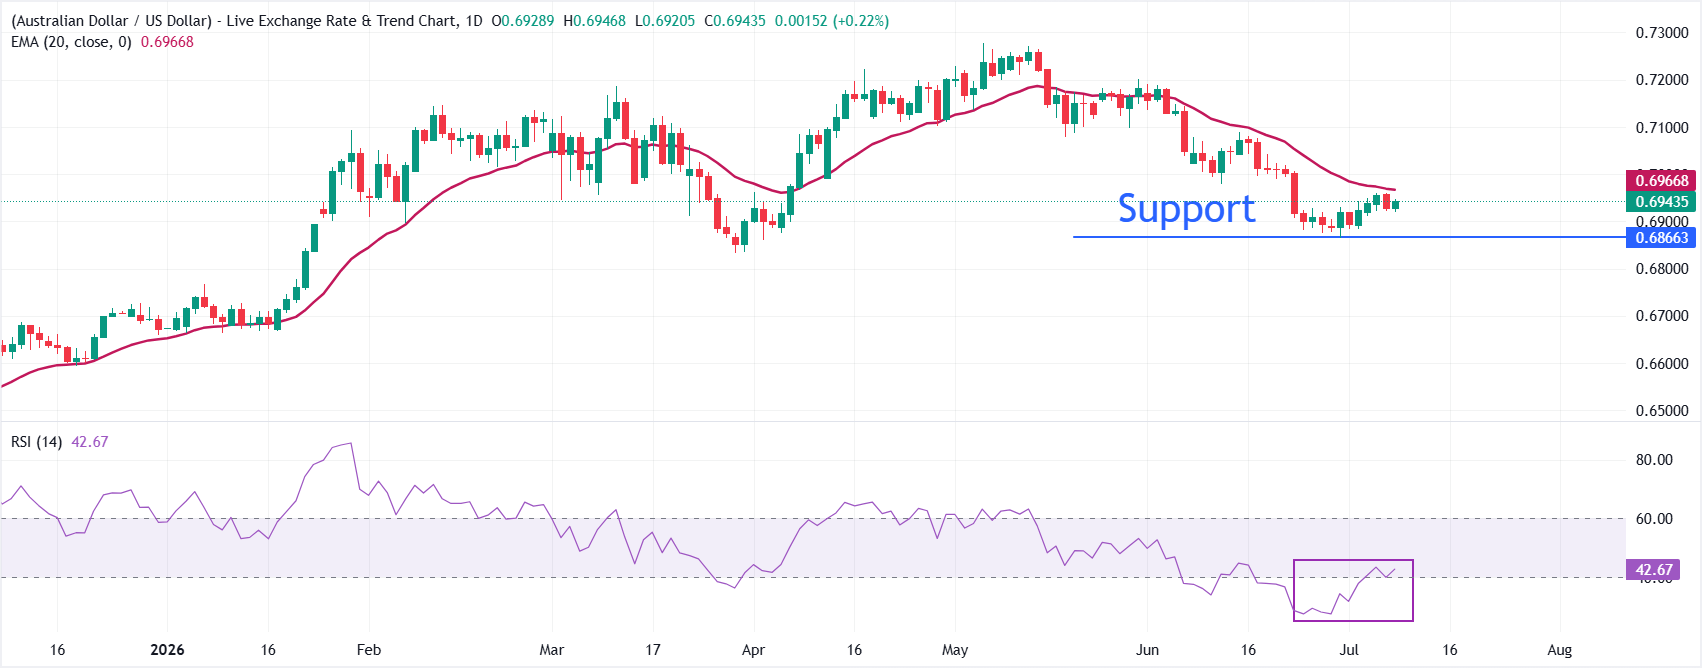
AUD/USD trades slightly higher at around 0.6936, but maintains a bearish near-term tone as it remains below the 20-period exponential moving average (EMA) at 0.6963.
The pair has been unable to reclaim this short-term trend proxy, suggesting that rallies are likely to be capped while price holds under the EMA. The Relative Strength Index (RSI) at 41.46 stays below the midline, hinting at persistent, though not extreme, selling pressure.
On the topside, initial resistance is defined by the 20-period EMA at 0.6963, which is the first level bulls would need to overcome to ease the current downside bias. Above the moving average, the next resistance for the pair will be the psychological level of 0.7000. Looking down, the June low at 0.6865 is the key support level; a break below that would expose the pair to the March low at 0.6833.
The Indian rupee hovered around 95.5 per dollar, pausing losses as traders pointed to likely intervention by the Reserve Bank of India through dollar sales to temper volatility. The currency remained under pressure, however, amid renewed geopolitical tensions after fresh US military strikes on Iran and retaliatory attacks on Kuwait and Bahrain fueled concerns over oil supplies. Brent crude remained on the rise, gaining more than 8% over the previous two sessions. Broader market caution also weighed on domestic assets, sending the benchmark 10-year government bond yield up 7 basis points on Wednesday, its biggest one-day rise in over three months, while Indian equities fell 2%, their steepest drop over the same period. Meanwhile, Fed meeting minutes reinforced expectations of tighter US monetary policy, with futures implying a one-in-three chance of a rate hike this month and a two-in-three probability by September.
The offshore yuan rose to around 6.79 per dollar on Thursday, snapping a three-session losing streak, as stronger producer-price growth reinforced expectations that deflationary pressures are easing despite still-muted consumer demand. Annual producer inflation rose to 4.1% in June from 3.9% in May, marking the fastest pace since July 2022, supported by higher commodity and energy costs amid the Middle East tensions. Meanwhile, annual consumer inflation eased to a three-month low of 1% from 1.2% in May. While rising global prices for oil, semiconductors, and industrial metals have lifted factory-gate prices, weak domestic demand has limited cost pass-through to consumers, keeping pressure on profit margins. On the monetary policy front, the central bank reiterated its commitment to maintaining an appropriately accommodative stance and strengthening financial support for domestic consumption, while acknowledging the persistent imbalance between robust supply and relatively weak demand.
The Japanese yen traded around 162.5 per dollar on Thursday, hovering near 40-year lows as renewed conflict between the US and Iran drove oil prices higher, adding pressure to Japan’s oil-dependent economy and weighing on the currency. The US military confirmed it had carried out strikes on Iran for a second straight day, while Tehran threatened a large-scale retaliatory operation against US military bases across the region. Meanwhile, traders continued to maintain bearish positions on the yen amid the absence of intervention from Japanese authorities despite repeated warnings from Tokyo. Investors are now awaiting official intervention data later this month to determine whether the government was behind the yen’s sharp but short-lived rally on July 2. Separately, Japan’s government revised its latest draft of the annual policy agenda, calling for appropriate monetary policy that supports stable price growth.
ge market has turned defensive following a sudden escalation in the conflict between Iran and the United States. Iran’s attack on commercial vessels in the Strait of Hormuz brought an end to the month-long ceasefire that had been in place. As a result, the geopolitical risk premium has returned to the FX market, draining capital from most currencies and redirecting it toward the U.S. dollar.Timeline of the escalation: How did the memorandum collapse?
The renewed escalation followed the sequence of events below:
Signing of the memorandum: Last month, the United States and Iran reached a temporary 60-day agreement. The deal guaranteed safe, toll-free passage for ships through the Strait of Hormuz in exchange for the temporary suspension of U.S. sanctions on Iranian oil exports and the launch of negotiations over Tehran’s nuclear program.
Iran attacks commercial vessels (beginning of the escalation): Iran violated the agreement by targeting three commercial ships transiting the Strait of Hormuz, including an LNG tanker carrying liquefied natural gas.
U.S. retaliation: In response to the attacks on commercial shipping, U.S. forces launched a large-scale retaliatory strike against more than 80 targets across Iran. Washington also immediately reinstated sanctions on Iranian oil trade.
Iranian counterattack: Tehran responded with another wave of strikes, this time targeting sites in Bahrain and Kuwait.
Official end of the ceasefire: Speaking to reporters during the NATO summit in Ankara, Donald Trump ended any speculation by declaring that the ceasefire was over (“as far as I’m concerned, it’s over”). The President sharply criticized the Iranian leadership, calling them “scum” and “liars,” effectively ruling out any near-term return to diplomacy.
FX market reversal: Risk aversion weighs on emerging-market currencies
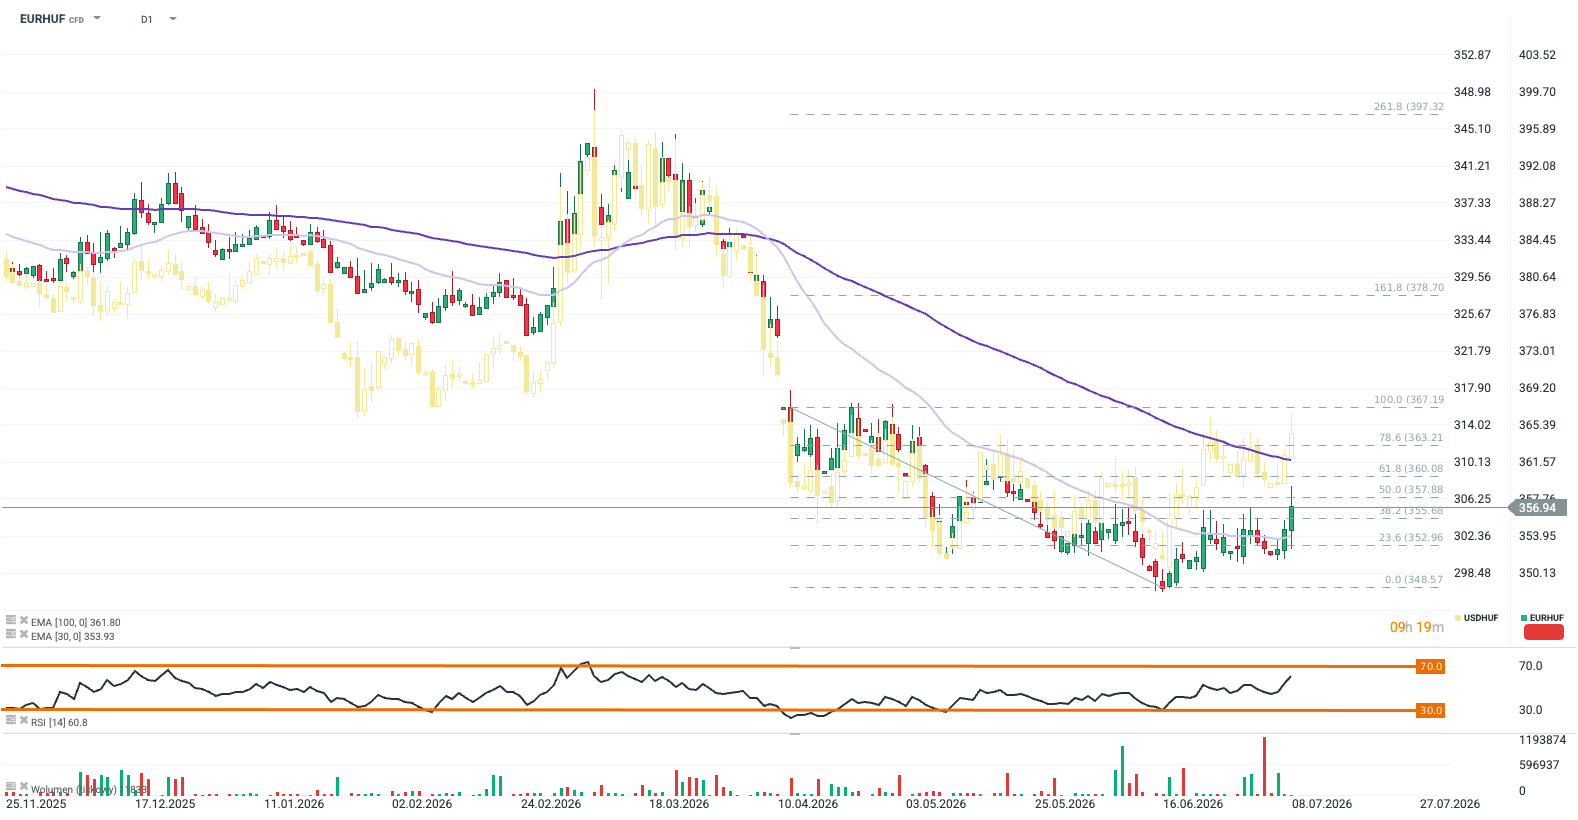
Smaller emerging-market currencies are the biggest losers of today’s session, rapidly surrendering the gains accumulated during the past several weeks of relative geopolitical calm. The Hungarian forint is the weakest performer today ( EUR/HUF: +0.85%, USD/HUF: +1.0% ), falling to a two-month low against the euro and a three-month low against the U.S. dollar. However, the forint entered this new phase of the Middle East conflict from a position of considerable strength, retreating from multi-year highs reached on the back of investor optimism following Peter Magyar’s party’s victory in the parliamentary elections. For the HUF, the current move may represent a justified correction after most positive developments had already been priced in. Any further appreciation will likely depend on more structural improvements in the Hungarian economy, particularly stronger foreign direct investment. Alongside the forint, the South African rand (USD/ZAR: +0.6%, EUR/ZAR: +0.4%) and the Indian rupee (USD/INR: +0.5%) are also posting broad losses. India remains directly dependent on crude oil shipments passing through the Strait of Hormuz, while South Africa relies heavily on refined petroleum products. Meanwhile, the Polish zloty is down around 0.3% against both the euro and the U.S. dollar.
Chart 1: EUR/HUF and USD/HUF exchange rates (yellow)
Source: xStation5
EUR/USD: Bears regain the upper hand
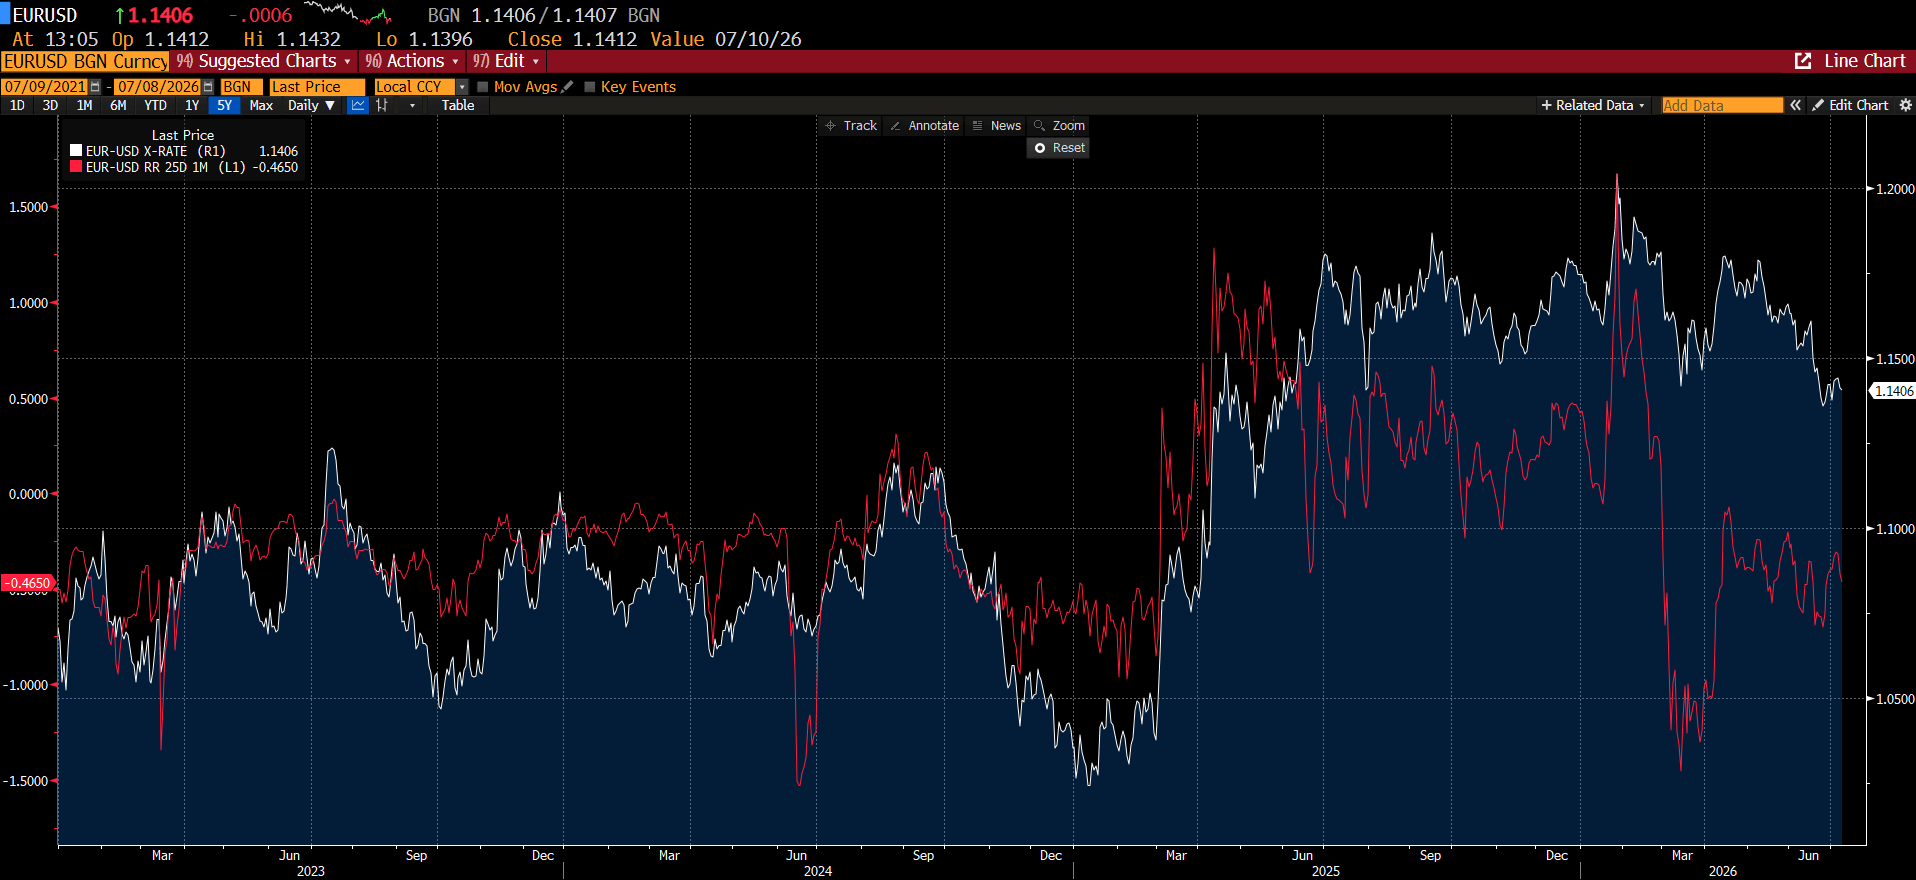
The increase in risk aversion is also weighing on the broader G10 currency complex. The only notable exceptions are the New Zealand dollar , supported by the Reserve Bank of New Zealand’s recent rate hike to 2.50% and hawkish remarks from the RBNZ Governor, and the Norwegian krone , which continues to benefit from renewed upward pressure on oil prices. The resumption of hostilities in the Middle East has effectively erased a week’s worth of gains on EUR/USD. The world’s most traded currency pair has declined by roughly 0.4% since yesterday and, despite relatively flat trading today, remains vulnerable to further downside. This is especially true given that the European Central Bank is unlikely to respond with the kind of reactive hawkish rhetoric that would provide meaningful support for the euro. Options market participants are also increasingly hedging against further EUR/USD declines. The one-month Risk Reversal indicator has remained below zero almost continuously since March 2026, indicating that demand for EUR/USD put options exceeds demand for call options. In other words, investors are showing a greater preference for contracts that protect against further euro weakness.
Chart 2: One-month EUR/USD Risk Reversal and EUR/USD spot
Source: Bloomberg Finance LP
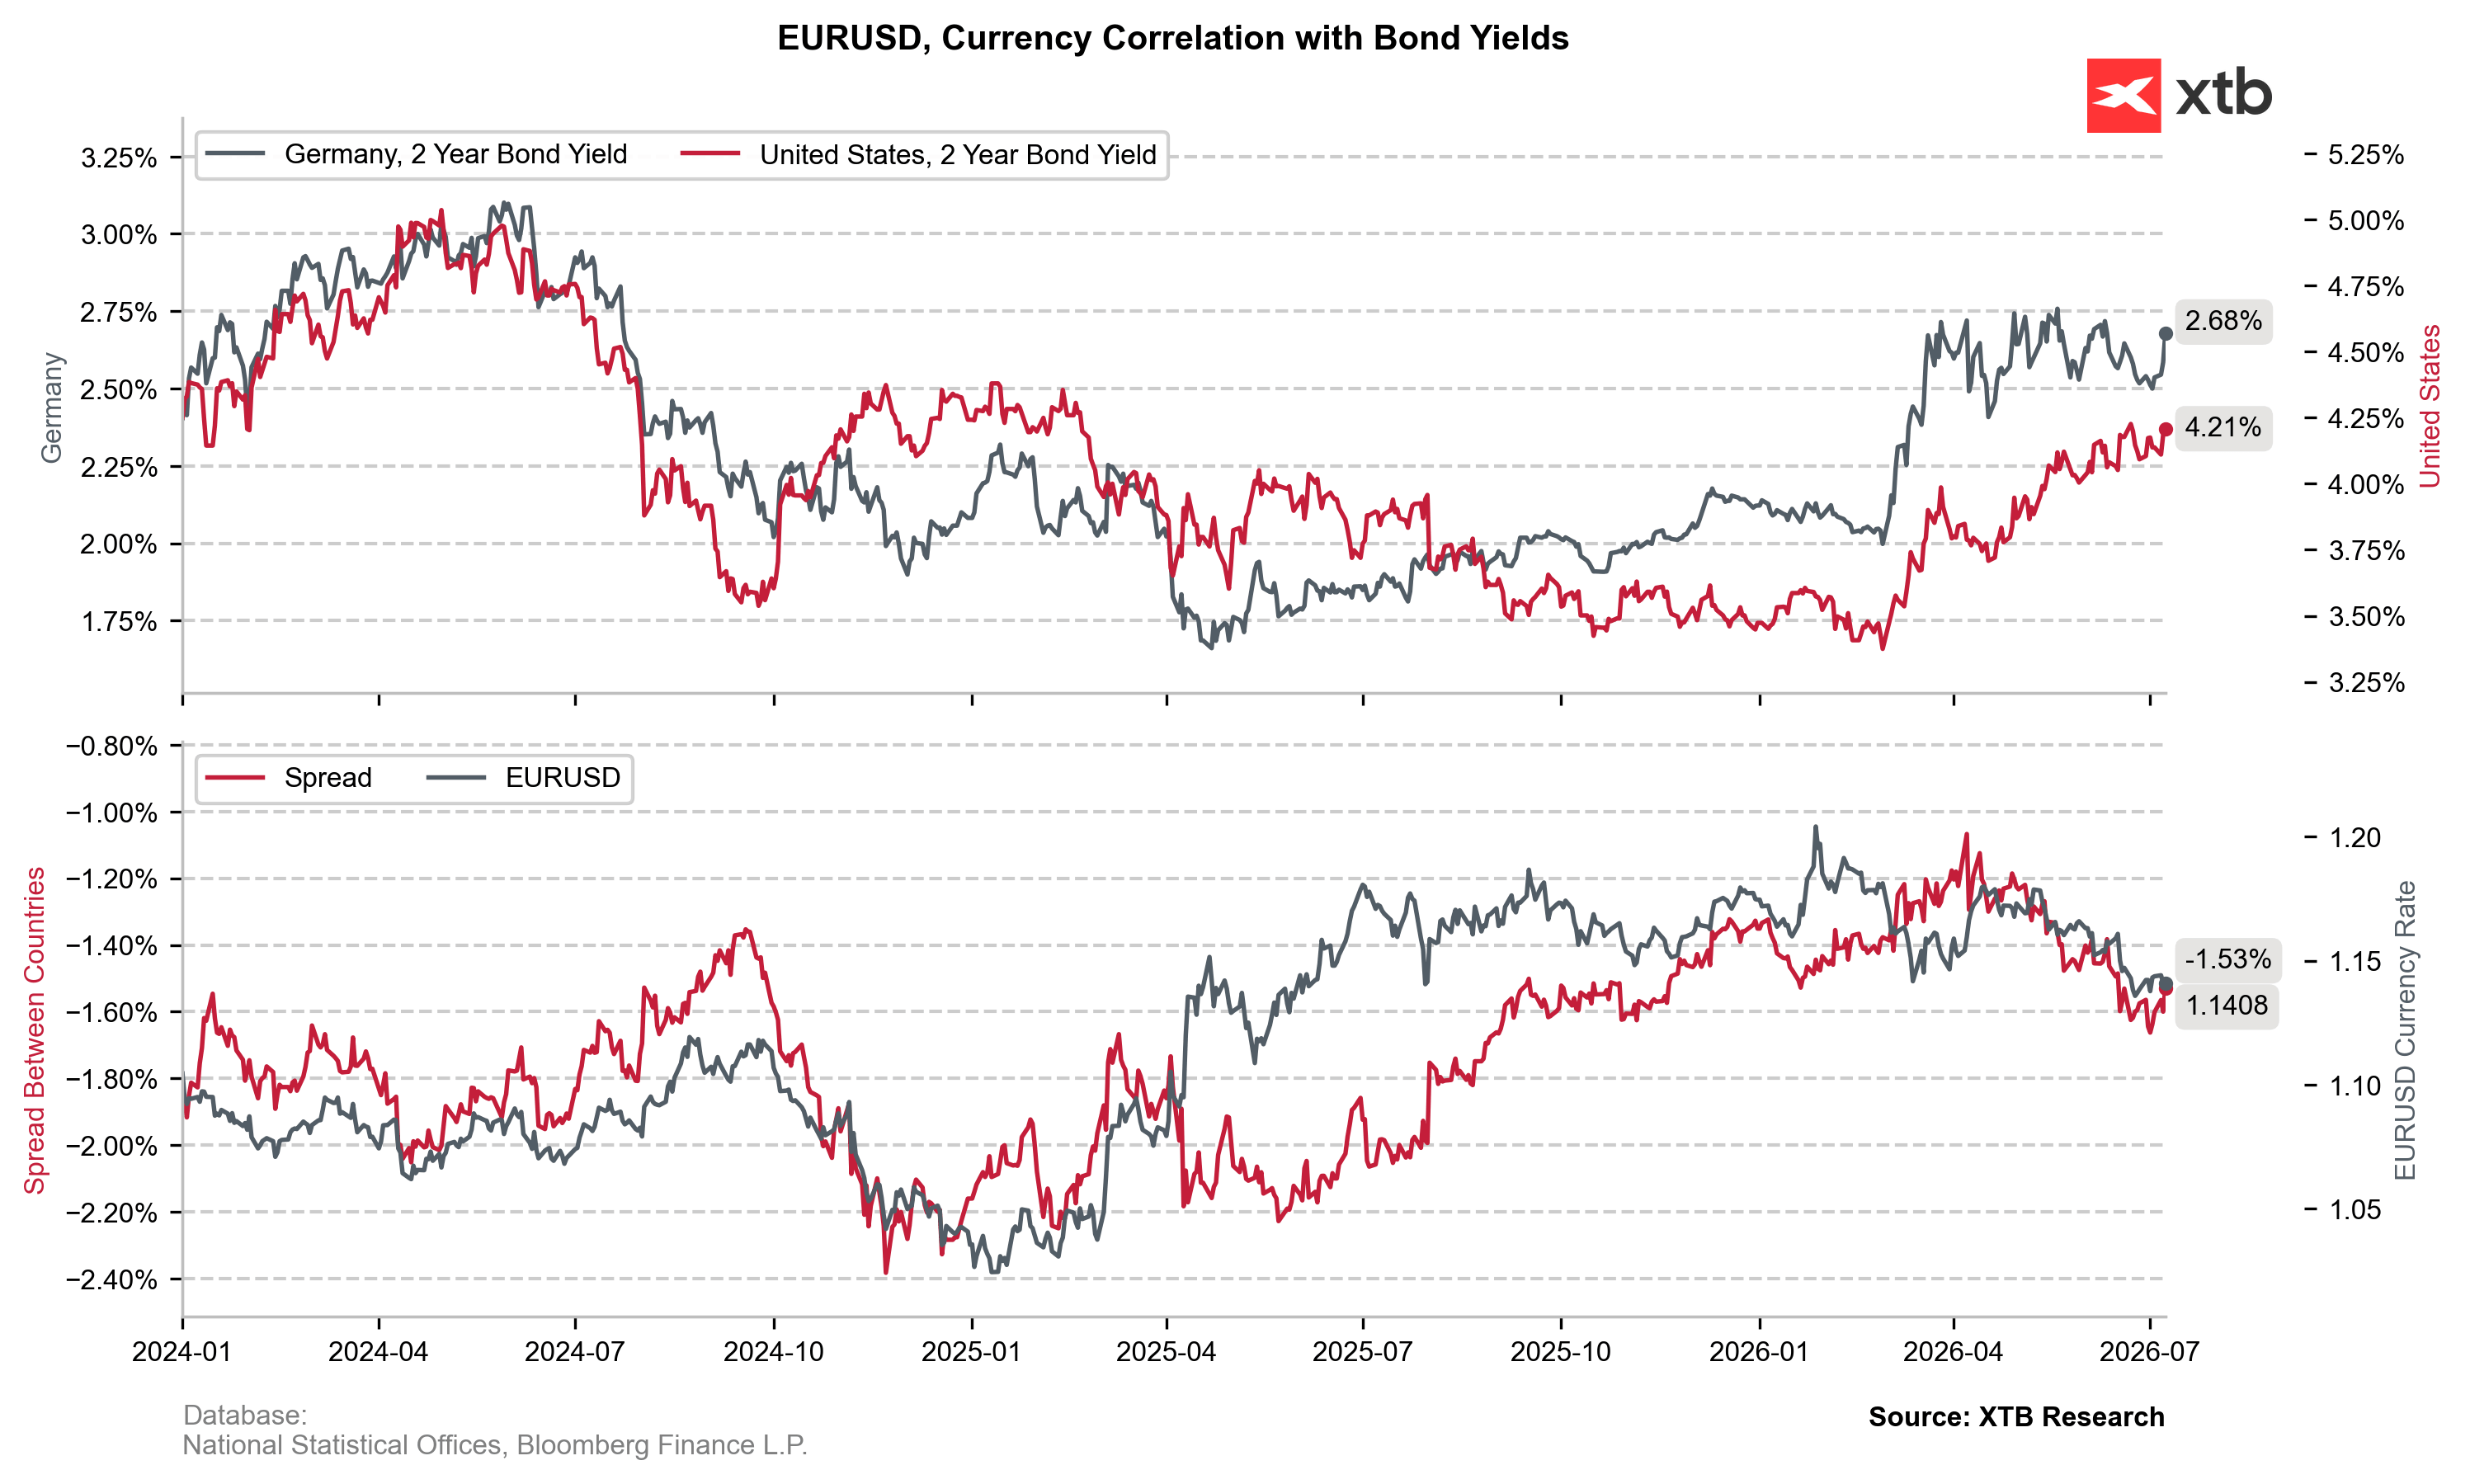
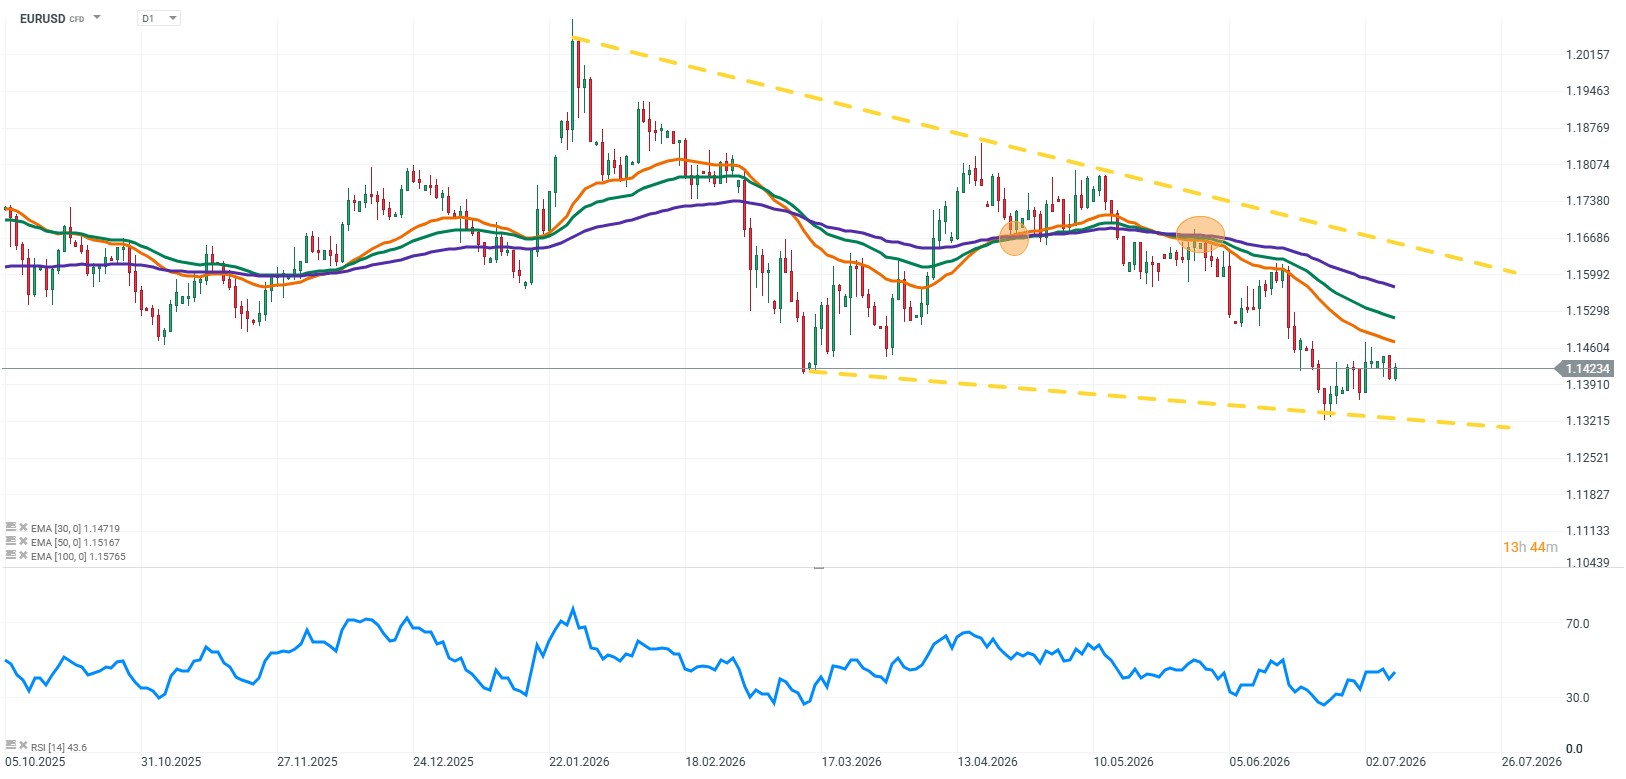
On the other hand, developments in the bond market may provide fundamental support for EUR/USD. Yields on two-year German government bonds have rebounded much more sharply (around +10 bps) than their U.S. counterparts, reflecting the euro area’s significantly greater sensitivity to a prolonged energy shock. If military tensions persist over the longer term, the ECB may be forced to adopt a more hawkish, inflation-focused stance. Even without additional rate hikes, such a shift in communication could help EUR/USD defend support around 1.1400.Chart 3: EUR/USD and the yield spread between two-year German and U.S. government bonds
Wednesday’s session on the EURUSD market is being shaped by a clash of three key forces: expectations regarding the future path of Federal Reserve policy, the increasingly firm stance of the European Central Bank, and the renewed risk premium linked to geopolitical developments in the Middle East. The market is currently at an unusual point, as investors are no longer focused solely on which central bank will maintain the more restrictive stance.
The key question now is how long the Fed will keep rates at current levels and whether the ECB will indeed be forced to deliver further rate hikes. Today’s release of the FOMC meeting minutes could provide important clues about the future direction of US monetary policy. At the same time, markets must also factor in geopolitical developments and rising oil prices, which could once again complicate the inflation outlook on both sides of the Atlantic.
Source: xStation5
Three factors currently shaping EURUSD
1. FOMC Minutes: Markets are looking for clues on future Fed rate cuts
The main event of the day remains the release of the latest Federal Open Market Committee meeting minutes. This time, markets are not focusing solely on whether the Fed will remain restrictive. The more important question is when and under what conditions the Federal Reserve will be ready to shift the direction of monetary policy.
Markets have been increasingly assessing the possibility of future rate cuts in the United States, but the Fed must remain extremely cautious in its communication. Signalling readiness to ease policy too quickly could be interpreted as declaring victory over inflation prematurely and could undermine the central bank’s credibility. The fact that markets are analysing the first signals of Fed communication under Kevin Warsh’s leadership adds further importance to today’s release. The new Fed Chair faces a difficult balancing act: acknowledging market expectations for lower interest rates while avoiding any suggestion that the fight against inflation has already been won. Today’s minutes may provide insight into how FOMC members assess:
the persistence of inflationary pressures,
the resilience of the US economy,
the timing of a potential rate-cut cycle.
If the document shows greater caution towards rate cuts, the dollar could receive additional support. However, if markets interpret the minutes as signalling greater willingness to ease policy, the US currency could come under renewed pressure.
2. ECB remains hawkish and continues to support the euro
The situation across the Atlantic currently looks different. Following its 25 basis point rate hike in June, the European Central Bank remains focused on risks related to persistent inflationary pressures. Markets are increasingly pricing in a scenario where the ECB could deliver another rate increase later this year. This marks a significant shift compared with the previous period, when the main concern for the euro was slowing economic growth and the possibility of monetary easing. Currently, markets must consider that persistent inflation, particularly in the services sector, combined with the potential for higher energy prices, could force the ECB to maintain a restrictive policy stance for longer. For EURUSD, this provides an important source of support. Even if the dollar remains strong due to the relative strength of the US economy and its safe-haven status, the euro continues to benefit from the prospect of higher interest rates in the euro area.
3. Rising US-Iran tensions and the renewed importance of oil markets
One of the most important new drivers for global markets remains the situation in the Middle East. Rising tensions between the United States and Iran, along with concerns over restrictions on Iranian oil exports, have increased the risk of supply disruptions in energy markets. The market response has been a rise in Brent and WTI crude prices, with investors once again considering the possibility that inflationary pressures could remain elevated for longer. The impact of this factor on EURUSD is not straightforward. On one hand, geopolitical uncertainty traditionally supports the US dollar as a safe-haven asset. During periods of increased risk aversion, investors often turn towards the American currency. On the other hand, higher energy prices increase inflationary pressure and complicate central bank decisions. The euro area economy remains particularly vulnerable to rising import costs due to its dependence on energy supplies. If oil prices move significantly higher again, markets may begin pricing in the risk of both the Fed and the ECB maintaining tighter monetary policy for longer.
EURUSD: Markets await the next move in the Fed-ECB policy divergence
The current situation in the major currency pair reflects the clash of three different narratives:
Fed – markets are trying to determine the timing of potential interest rate cuts,
ECB – investors are pricing in the possibility of further monetary tightening,
Middle East tensions and oil prices – a factor increasing inflation uncertainty and market volatility.
In this environment, EURUSD remains highly vulnerable to sharp moves, as every new development can quickly change expectations regarding the policy gap between the two central banks. US bond yields will remain a key transmission channel. Rising yields could support the dollar by increasing the market pricing of higher financing costs, while falling yields could increase pressure on the US currency.
Key takeaways
Today’s FOMC minutes could become the most important event for the dollar market.
The Fed is now at a stage where investors are analysing not the possibility of further rate hikes, but the timing of potential rate cuts.
Kevin Warsh must balance market expectations for easier policy with the need to preserve credibility in the fight against inflation.
The ECB remains an important source of support for the euro due to expectations of another rate hike this year.
Escalating tensions in the Middle East and rising oil prices could once again increase inflationary pressures.
EURUSD therefore remains at a point where the next major move may be determined by one key question: will Fed policy
AUD/USD rises to near 0.6943 as the Australian Dollar outperforms.
RBA’s Hunter signals that the central bank is committed to bringing inflation back to the target.
Investors await the FOMC Minutes and China’s CPI data for June.
The Australian Dollar (AUD) trades 0.23% higher to near 0.6943 against the US Dollar (USD) during the Asian trading session on Wednesday. The Aussie pair gains as the Australian Dollar outperforms its major currency peers, except the New Zealand Dollar (NZD), with the Reserve Bank of Australia (RBA) keeping the door open for further monetary policy tightening, if needed, to bring inflation back to the central bank’s target.
Australian Dollar Price Today
The table below shows the percentage change of Australian Dollar (AUD) against listed major currencies today. Australian Dollar was the strongest against the Japanese Yen.
USD
EUR
GBP
JPY
CAD
AUD
NZD
CHF
USD
-0.03%
0.03%
0.15%
-0.02%
-0.21%
-0.50%
0.03%
EUR
0.03%
0.05%
0.17%
-0.00%
-0.18%
-0.49%
0.05%
GBP
-0.03%
-0.05%
0.13%
-0.03%
-0.25%
-0.52%
-0.03%
JPY
-0.15%
-0.17%
-0.13%
-0.18%
-0.34%
-0.65%
-0.15%
CAD
0.02%
0.00%
0.03%
0.18%
-0.18%
-0.48%
0.02%
AUD
0.21%
0.18%
0.25%
0.34%
0.18%
-0.30%
0.18%
NZD
0.50%
0.49%
0.52%
0.65%
0.48%
0.30%
0.49%
CHF
-0.03%
-0.05%
0.03%
0.15%
-0.02%
-0.18%
-0.49%
The heat map shows percentage changes of major currencies against each other. The base currency is picked from the left column, while the quote currency is picked from the top row. For example, if you pick the Australian Dollar from the left column and move along the horizontal line to the US Dollar, the percentage change displayed in the box will represent AUD (base)/USD (quote).
Earlier in the day, RBA Assistant Governor Sarah Hunter said that the central bank will act as needed to bring inflation back to target, even as the recent oil shock has yet to produce a marked slowdown in economic activity.
This year, the RBA has already delivered three interest rate hikes of 25 basis points (bps) and has pushed the Official Cash Rate (OCR) to 4.35%.
Going forward, investors will focus on China’s Consumer Price Index (CPI) data for June, which will be released on Thursday.
Meanwhile, the US Dollar trades marginally lower ahead of the Federal Open Market Committee (FOMC) minutes of the June policy meeting, which will be published at 18:00 GMT. Investors will pay close attention to FOMC minutes to get fresh cues regarding the Federal Reserve’s (Fed) monetary policy outlook.
AUD/USD technical analysis
AUD/USD trades higher at around 0.6944 at press time. However, the near-term tone is mildly bearish as it holds below the 20-period exponential moving average (EMA), which is at 0.6967. The pair’s inability to reclaim this nearby EMA resistance suggests topside attempts remain capped, while the Relative Strength Index (RSI) at 42.75 stays below the midline, hinting at subdued but not extreme selling pressure.
On the topside, immediate resistance is clustered at the 20-period EMA at 0.6967, which needs to be overcome to shift the near-term bias toward recovery and open the way for a more sustained rebound. Looking down, the June 30 low at 0.6865 is the key support zone; a break below that would open further downside towards the March 30 low at 0.6833.
EUR/JPY eyes the primary barrier at the upper boundary of the symmetrical triangle around 185.80.
The 14-day Relative Strength Index is at 52.81, hinting at neutral-to-firm momentum.
The currency cross could find the initial support at the VWAP of 185.20.
EUR/JPY pares its recent losses from the previous day, trading around 185.30 during the Asian hours on Wednesday. The currency cross is retaining a mildly bullish bias as it holds above the Volume-weighted Average Price (VWAP) and a cluster of Exponential Moving Averages (EMAs), with the 50-day EMA acting as nearby trend support.
The 14-day Relative Strength Index (RSI) at 52.81 sits just above its midline, hinting at steady, rather than aggressive, upside momentum while price remains supported by these underlying levels.
Daily chart technical analysis shows the EUR/JPY cross consolidating within a symmetrical triangle pattern, signaling that both buyers and sellers are growing increasingly aggressive as they compress the price into a narrowing range. This tight consolidation reflects a temporary balance of power, with neither side establishing clear control over the market’s direction just yet.
The initial barrier lies at the upper boundary of the symmetrical triangle around 185.80. A break above the triangle would cause the bullish emergence and expose the all-time high of 187.95, which was recorded on April 17.
On the downside, primary support lies at the VWAP at 185.20, followed by the 50-day EMA at 184.95 and the nine-day EMA at 184.93. Further declines would put downward pressure on the EUR/JPY cross to test the symmetrical triangle’s lower boundary around 183.70. A break below the triangle would expose the four-month low of 181.87, recorded on March 16, and the six-month low of 180.81.
EUR/JPY: Daily Chart
Euro Price Today
The table below shows the percentage change of Euro (EUR) against listed major currencies today. Euro was the strongest against the Japanese Yen.
USD
EUR
GBP
JPY
CAD
AUD
NZD
CHF
USD
-0.02%
0.02%
0.15%
-0.03%
-0.22%
-0.49%
0.01%
EUR
0.02%
0.05%
0.19%
-0.01%
-0.19%
-0.47%
0.04%
GBP
-0.02%
-0.05%
0.13%
-0.05%
-0.25%
-0.51%
-0.03%
JPY
-0.15%
-0.19%
-0.13%
-0.18%
-0.35%
-0.64%
-0.15%
CAD
0.03%
0.00%
0.05%
0.18%
-0.18%
-0.47%
0.03%
AUD
0.22%
0.19%
0.25%
0.35%
0.18%
-0.28%
0.19%
NZD
0.49%
0.47%
0.51%
0.64%
0.47%
0.28%
0.49%
CHF
-0.01%
-0.04%
0.03%
0.15%
-0.03%
-0.19%
-0.49%
The heat map shows percentage changes of major currencies against each other. The base currency is picked from the left column, while the quote currency is picked from the top row. For example, if you pick the Euro from the left column and move along the horizontal line to the US Dollar, the percentage change displayed in the box will represent EUR (base)/USD (quote).
To provide the best experiences, we use technologies like cookies to store and/or access device information. Consenting to these technologies will allow us to process data such as browsing behavior or unique IDs on this site. Not consenting or withdrawing consent, may adversely affect certain features and functions.
Functional
Always active
The technical storage or access is strictly necessary for the legitimate purpose of enabling the use of a specific service explicitly requested by the subscriber or user, or for the sole purpose of carrying out the transmission of a communication over an electronic communications network.
Preferences
The technical storage or access is necessary for the legitimate purpose of storing preferences that are not requested by the subscriber or user.
Statistics
The technical storage or access that is used exclusively for statistical purposes.The technical storage or access that is used exclusively for anonymous statistical purposes. Without a subpoena, voluntary compliance on the part of your Internet Service Provider, or additional records from a third party, information stored or retrieved for this purpose alone cannot usually be used to identify you.
Marketing
The technical storage or access is required to create user profiles to send advertising, or to track the user on a website or across several websites for similar marketing purposes.