AUD/JPY attracts heavy selling following the release of soft Australian consumer inflation figures.
Intervention fears prompt some JPY unwinding and further contribute to the steep intraday slide.
The wide interest rate gap between Japan and Australia holds back bears from placing fresh bets.
The AUD/JPY cross extends this week’s retracement slide from the 114.65 zone, or its highest level since June 3, and attracts some follow-through selling for the second straight day. The intraday decline picks up pace following the release of soft Australian consumer inflation figures and drags spot prices to an over one-week low, around the 113.60 region, in the last hour.
Data published by the Australian Bureau of Statistics (ABS) showed the Consumer Price Index (CPI) increased by 3.8% year-over-year (YoY) in June, compared to a 4% growth reported in May and consensus estimates. Adding to this, the monthly print missed forecasts and fell for the second straight month, by 0.1% in June. The softer CPI report prompted traders to unwind expectations for a near-term Reserve Bank of Australia (RBA) rate hike and weighs heavily on the Australian Dollar (AUD).
The Japanese Yen (JPY), on the other hand, draws support from growing speculations that authorities will step in to prop up the domestic currency. This turns out to be another factor that exerts downward pressure on the AUD/JPY cross and contributes to the steep intraday decline. However, the persistently wide interest rate gap between Japan and other major economies, including Australia, holds back JPY bulls from placing aggressive bets and helps limit further losses for the currency pair.
Furthermore, economic risks stemming from the Middle East crisis warrant some caution before confirming that the AUD/JPY cross has topped out in the near-term and positioning for further losses. Investors might also opt to wait for the crucial Bank of Japan (BoJ) policy decision on Friday before placing fresh directional bets. This, in turn, suggests that any subsequent slide might still be seen as a buying opportunity and is more likely to remain limited amid mixed fundamental cues.
The South Korean won strengthened to around 1,451 per dollar in late July, reaching its highest level since early May, supported by expectations for tighter monetary policy and improved domestic fundamentals. The Bank of Korea reiterated that maintaining a tightening stance remains necessary amid persistent inflation pressures, following its recent rate hike to 2.75%, while highlighting stronger exports and investment as factors supporting continued economic growth. The currency also received support from SK hynix converting proceeds from its US listing into won, boosting demand for the local currency despite foreign investors selling South Korean equities. Meanwhile, gains were limited by uncertainty surrounding the Federal Reserve’s policy outlook, with markets still weighing the possibility of higher US interest rates. Volatility in the global semiconductor market also continued to influence broader risk sentiment.
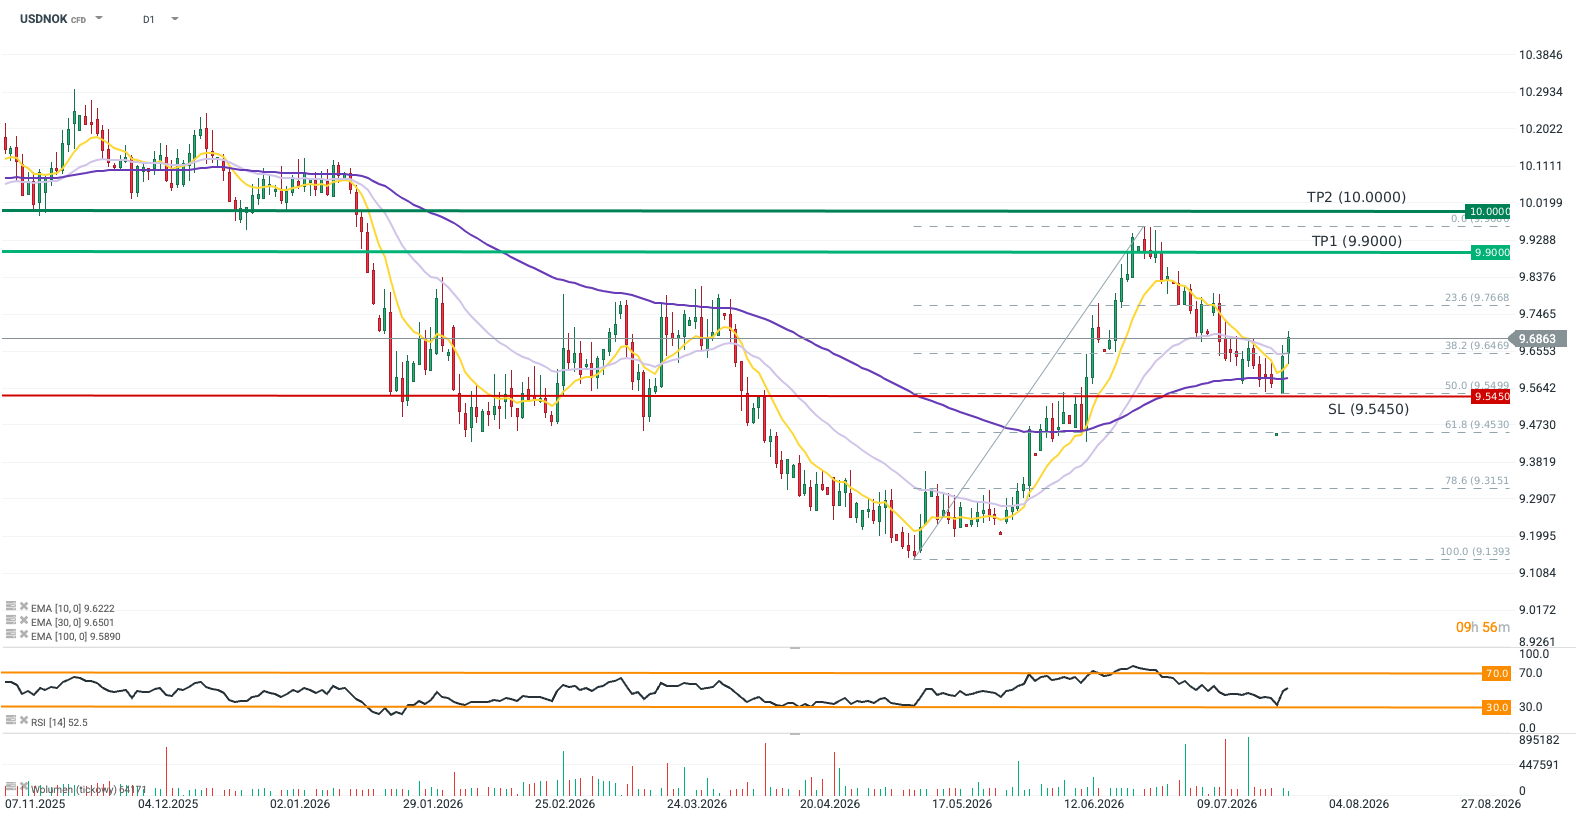
USDNOK returned today above the 10- and 30-day exponential moving averages (EMA10 and EMA30).
The yield spread between US and Norwegian 10-year government bonds (US-NOR) has widened by approximately 8 basis points over the past month (today vs. June 26).
The swap market is fully pricing in a September interest rate hike in the US.
After breaking out to a 5-month high in late June, USDNOK entered a local downtrend driven by the resurgence of military actions in the Persian Gulf and rising oil prices. The ~4% correction ended on Monday, and the exchange rate is currently attempting to break out of this downtrend, aided by falling oil prices that are weakening the Norwegian krone. A rebound in USDNOK should be supported by the Federal Reserve’s increasingly hawkish stance. During the central banking forum in Sintra, Kevin Warsh explicitly identified inflation as enemy number one, emphasizing that the Fed will not tolerate inflation above target and suggesting it will not take AI-driven productivity gains for granted. A hawkish Fed is also backed by the recent series of US economic data (jobless claims at their lowest since 1969, a stable unemployment rate, and better-than-expected PMI readings indicating expansion in the private sector). The gathering economic momentum, accompanied by sticky inflation above 3%, is driving interest rate expectations across all time horizons (e.g., the year-end rate implied by the swap market rose from 4.00% to 4.05% over the past month). Expectations for Norges Bank are also hawkish (the swap market is pricing in a 25 bps hike by the end of the year), but they are gaining momentum more slowly than those for the US, as evidenced by the upward trend in the 10-year yield spread between the two economies. A renewal of upward pressure on oil prices could naturally strengthen the NOK; however, geopolitical risk simultaneously supports the dollar, which should limit any non-monetary-policy-driven declines in USDNOK.
Methodology
This recommendation was prepared based on a technical analysis of the USDNOK chart and a fundamental analysis of the respective economies (monetary policy in Norway and the United States). The directional bias was determined using moving averages and market expectations regarding central bank policies. Take Profit and Stop Loss levels were established using Fibonacci retracements and price action:
TP1 is set at the recent peak.
TP2 is set at the next key resistance level.
SL is placed at the 61.8% Fibonacci retracement level of the April–May 2026 downward wave.
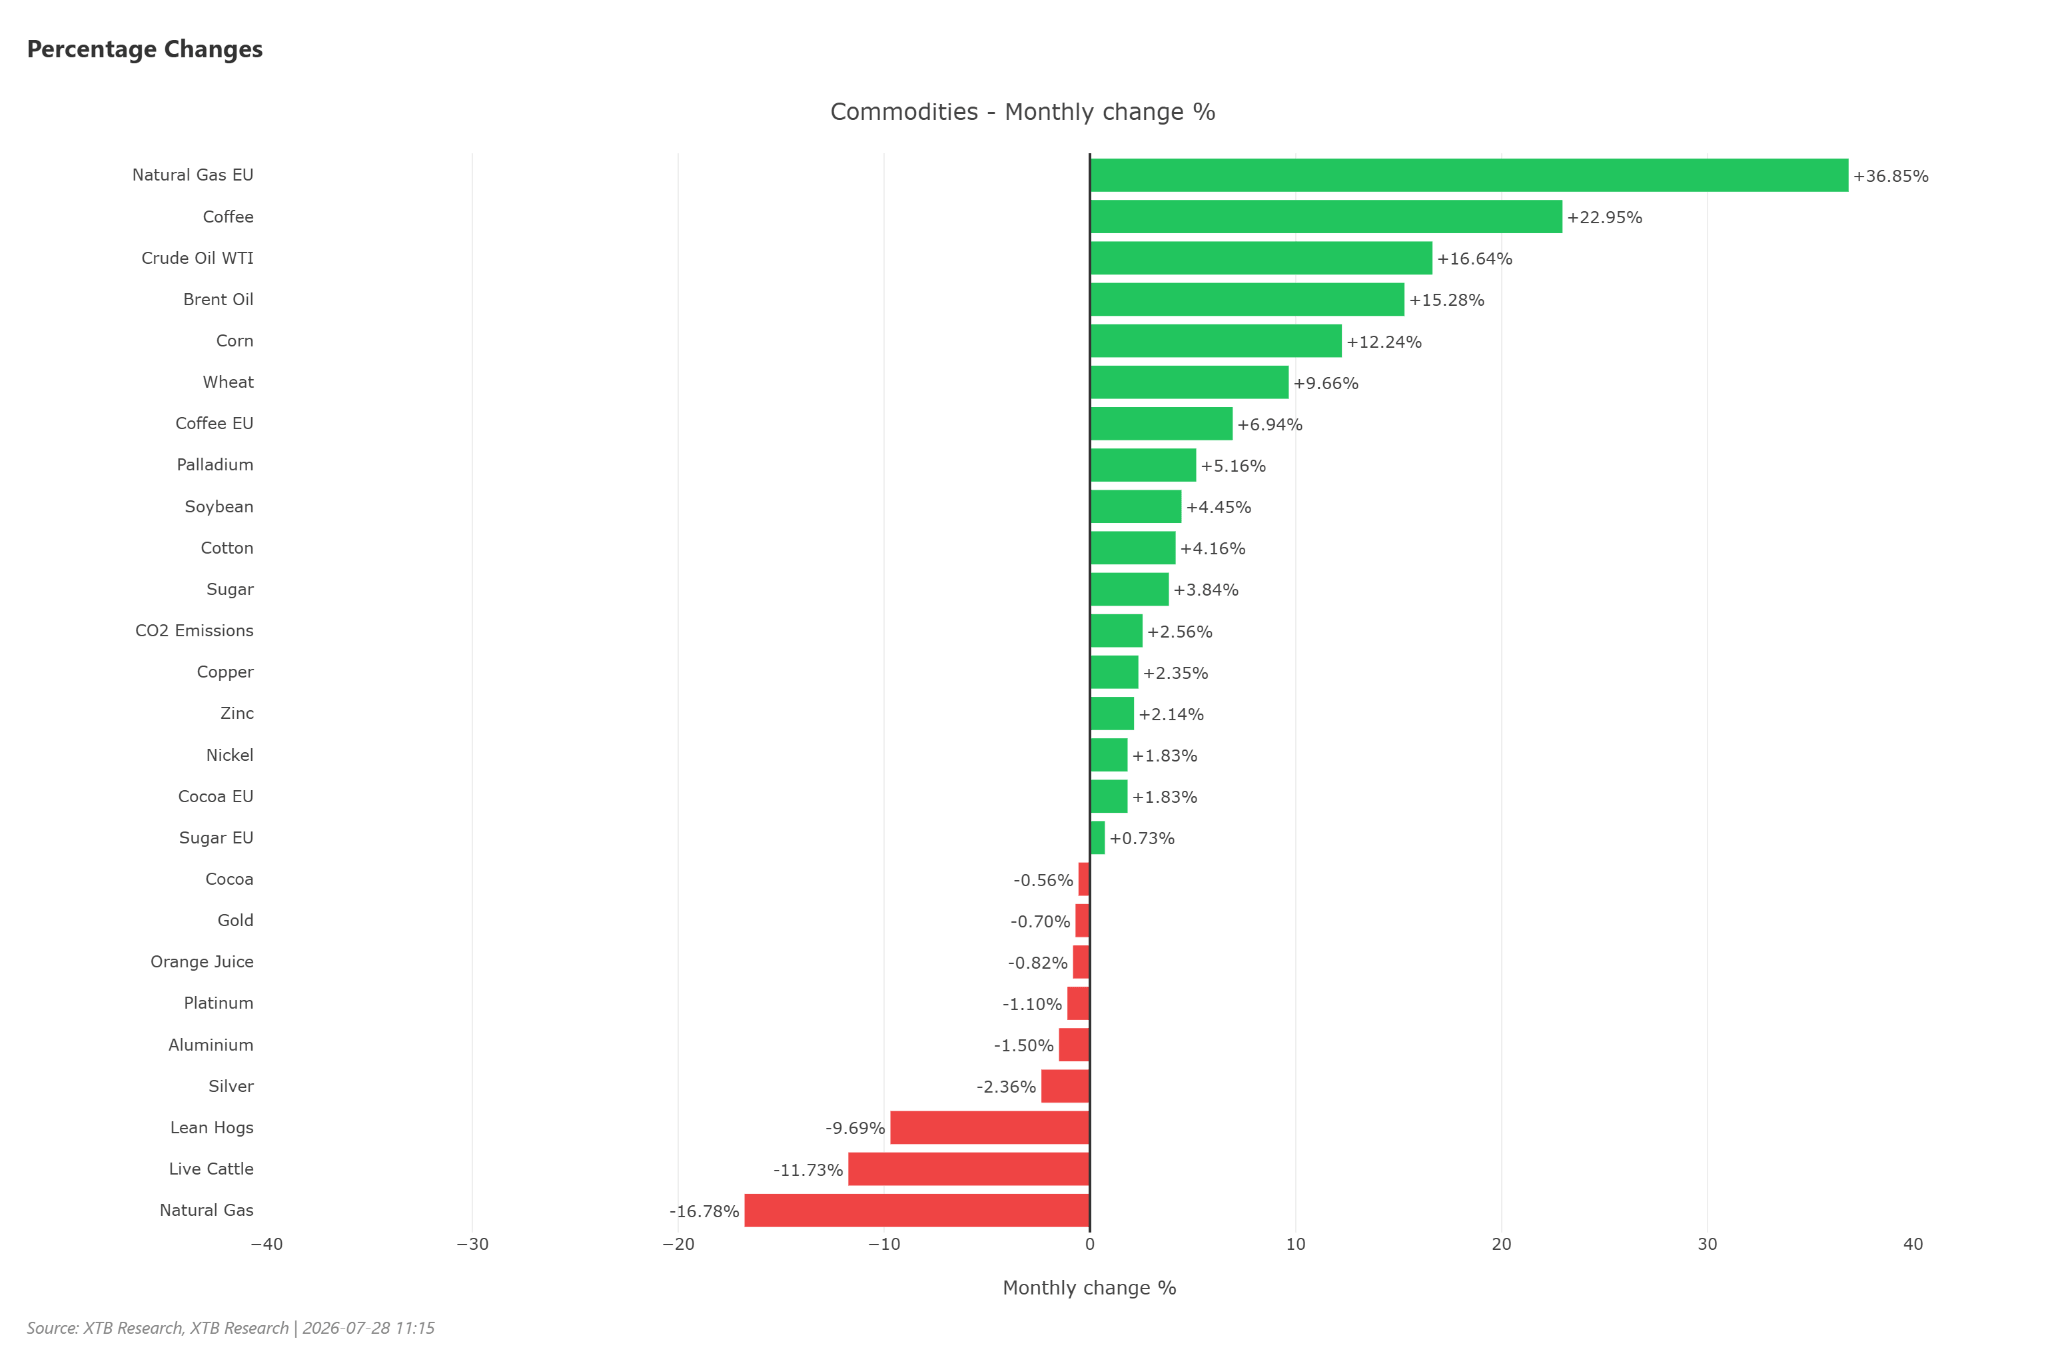
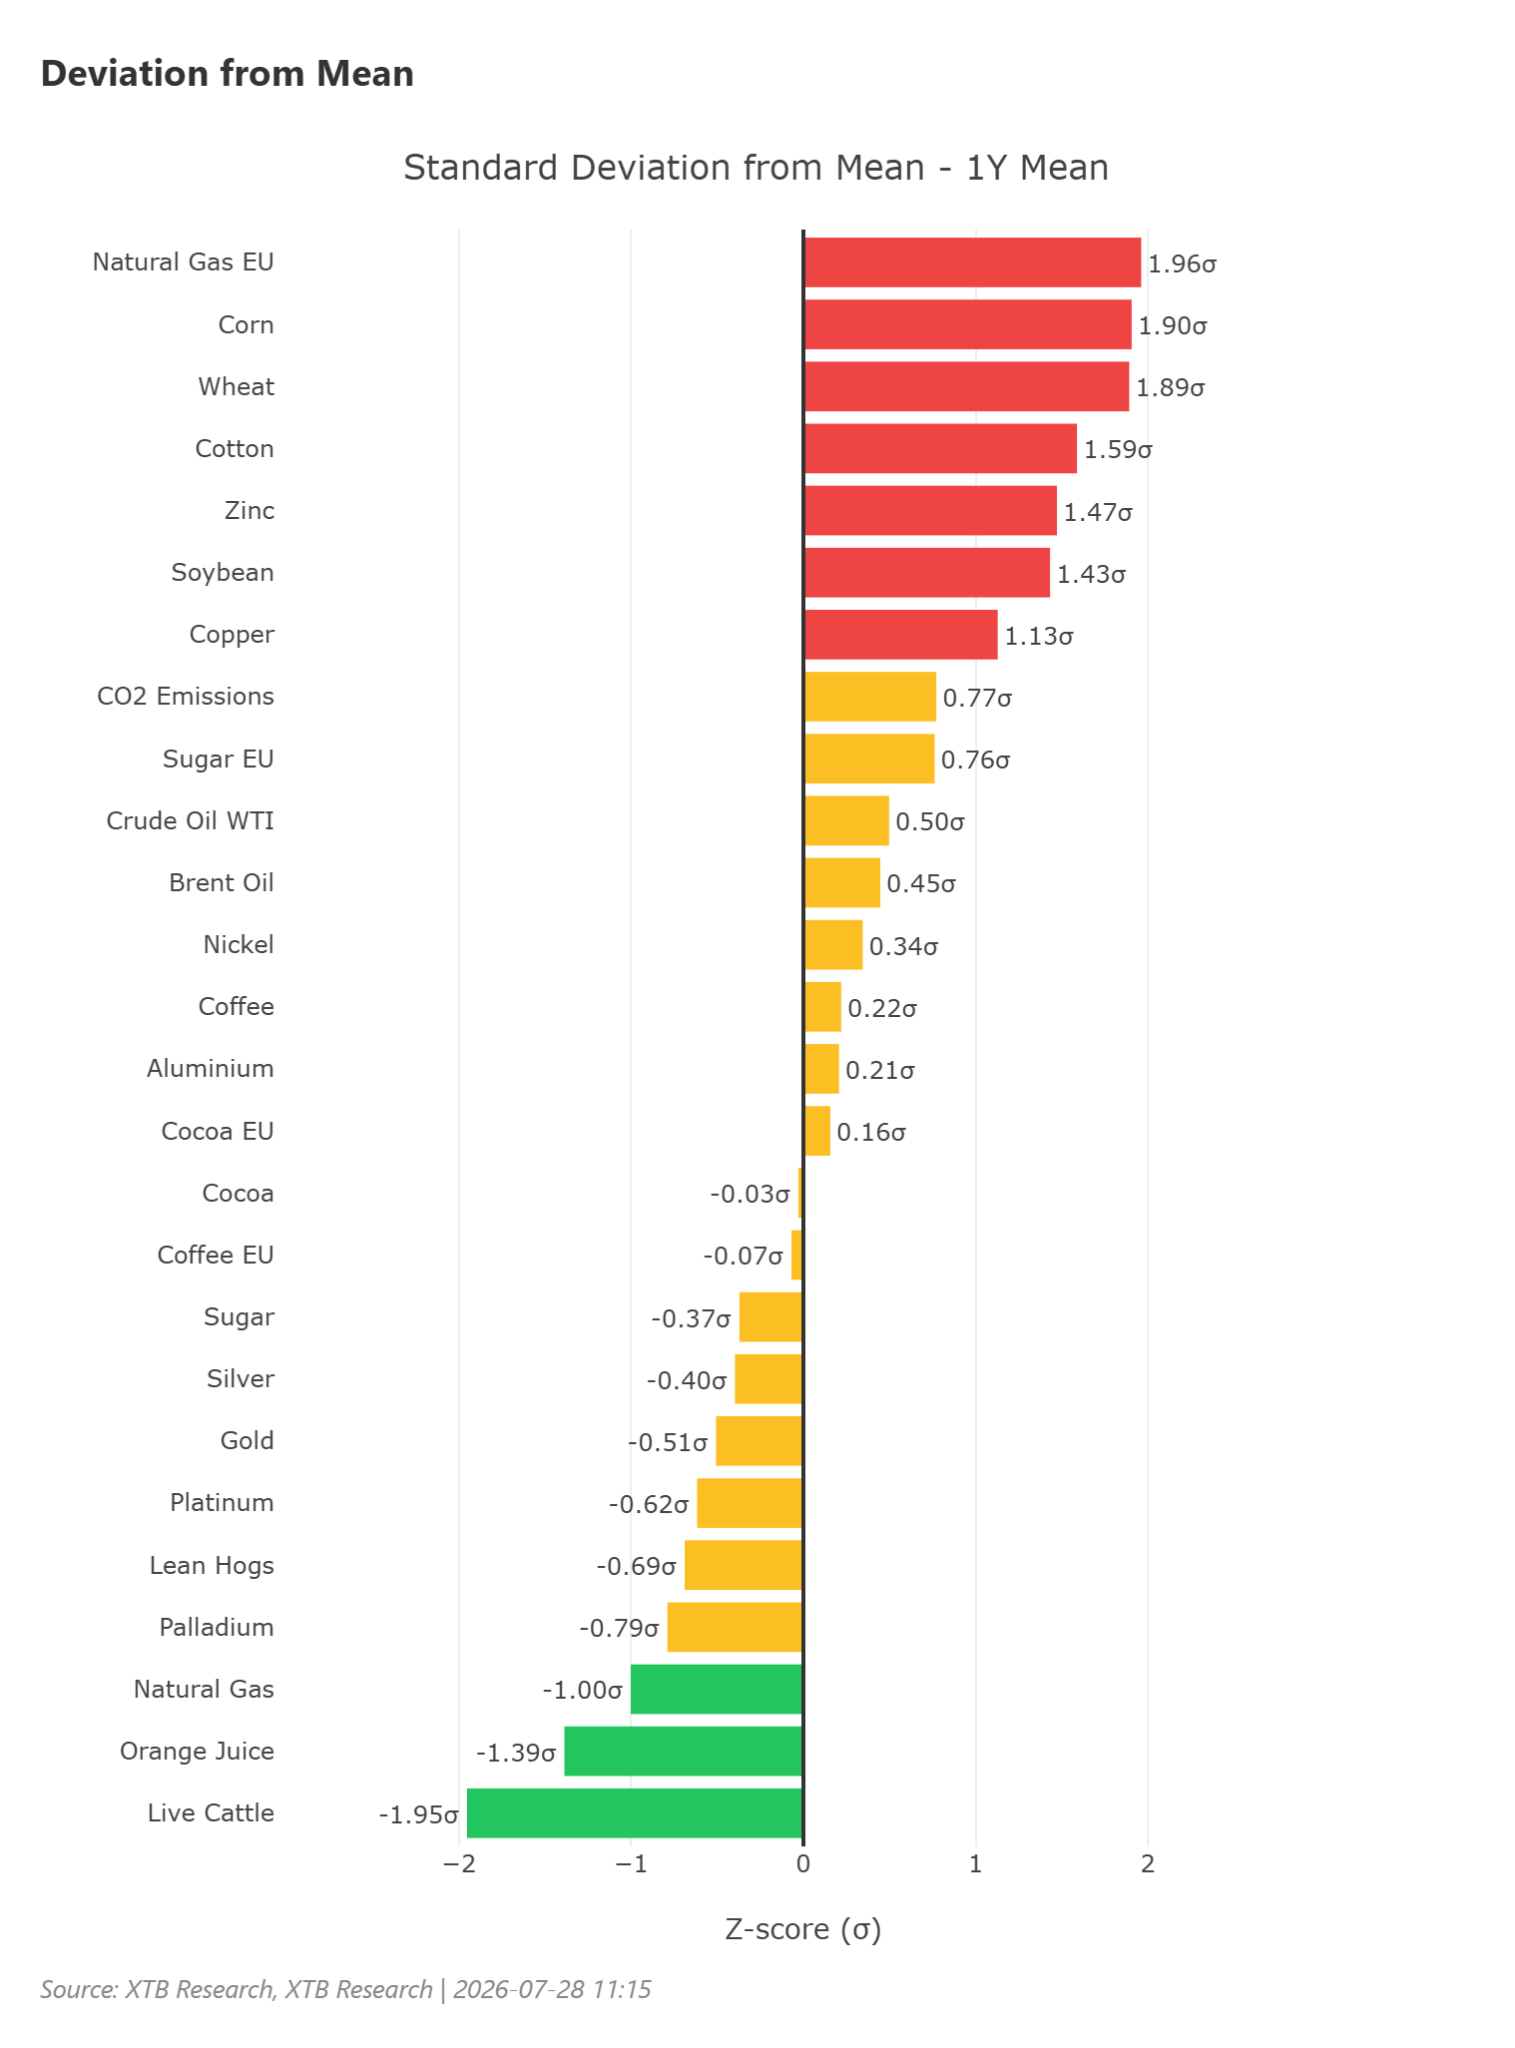
Bearish sentiment dominates the commodity market today, reflected by a negative average daily change of -0.41% with only six assets rising. The energy sector is seeing the sharpest decline—Brent crude is down 2.24% today (over 8.4% weekly), and WTI has fallen by 1.96%, driven by increasing hopes for a US-Iran diplomatic agreement. On the opposite pole are agricultural commodities, where coffee is the leader of growth, appreciating by 5.73%, which pushes its valuation to an extreme level of +2.18 standard deviations (Z-score) above the 5-year average. Despite current corrections, industrial and precious metals still maintain historically high valuations, indicated by extreme deviations for copper (+3.06σ), gold (+2.76σ), and aluminum (+2.12σ). In the global context, it is worth noting reports of an expected economic slowdown in India due to the oil shock and stock market turmoil in Asia, which may affect future industrial demand. In the coming days, investor attention should focus on the upcoming Fed meeting and central bank decisions, which will define the further direction of the market. Commodity Price Changes in the Last Month
Over the last month, TTF natural gas, coffee, and crude oil gained the most. On the other hand, we have American natural gas and livestock. Source: XTB Oversold and Overbought Commodities
From a short-term perspective, cattle is very strongly oversold, reaching nearly 2 standard deviations from the 1-year average. In contrast, TTF natural gas, corn, wheat, and cotton can be treated as slightly overbought. Source: XTB
🛢️ Crude Oil
Crude oil prices continue strong declines in response to reports of a halt in mutual attacks and attempts to engage in diplomatic talks between the US and Iran.
Iran is set to discuss with Oman the resumption of ship traffic in the Strait of Hormuz. During the last session, only one tanker passed through Hormuz, while through Bab el-Mandab, there is a rebound to 7 tankers (compared to an average of 10 tankers in recent months).
The price of Brent crude fell to around $87 for the September contract, while the October contract is trading below $84. WTI crude, in turn, dropped below $81 per barrel.
If an agreement with Iran is reached, a significant oversupply, estimated at up to 2 million barrels per day in Q4 2026, will quickly appear on the oil market. Nevertheless, it is worth remembering that earlier IEA forecasts changed virtually from report to report, so everything will depend on the navigability of key straits in the Middle East.
Reloading is resuming at the CPC terminal in Kazakhstan after disruptions caused by drone attacks. It is worth noting that the oil and fuel market is also disrupted by Ukrainian attacks on Russian oil infrastructure. It is estimated that up to 50% of fuel production capacity in Russia is shut down due to the attacks, leading to domestic supply problems.
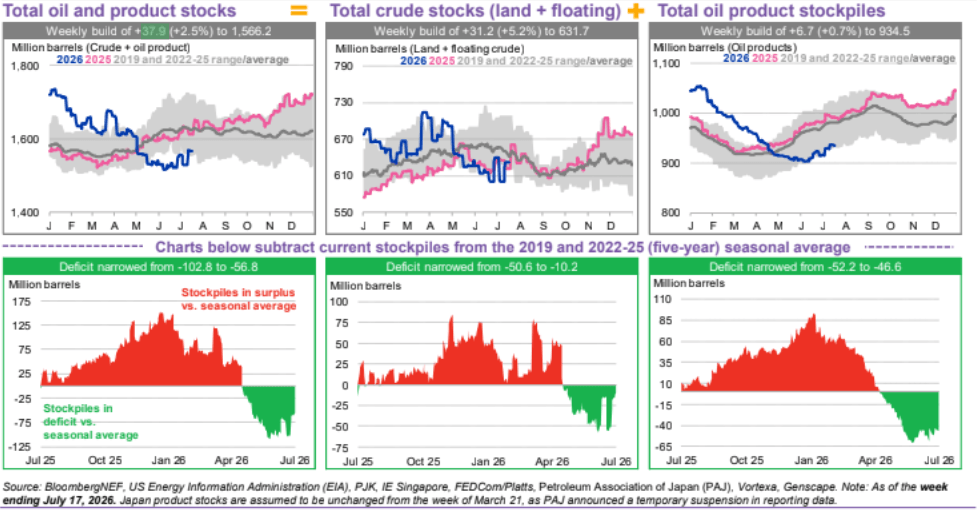
Global stocks of crude oil and petroleum products increased by 2.5% (by 37.9 million barrels) in the week ended July 17, narrowing the deficit relative to the 5-year average.
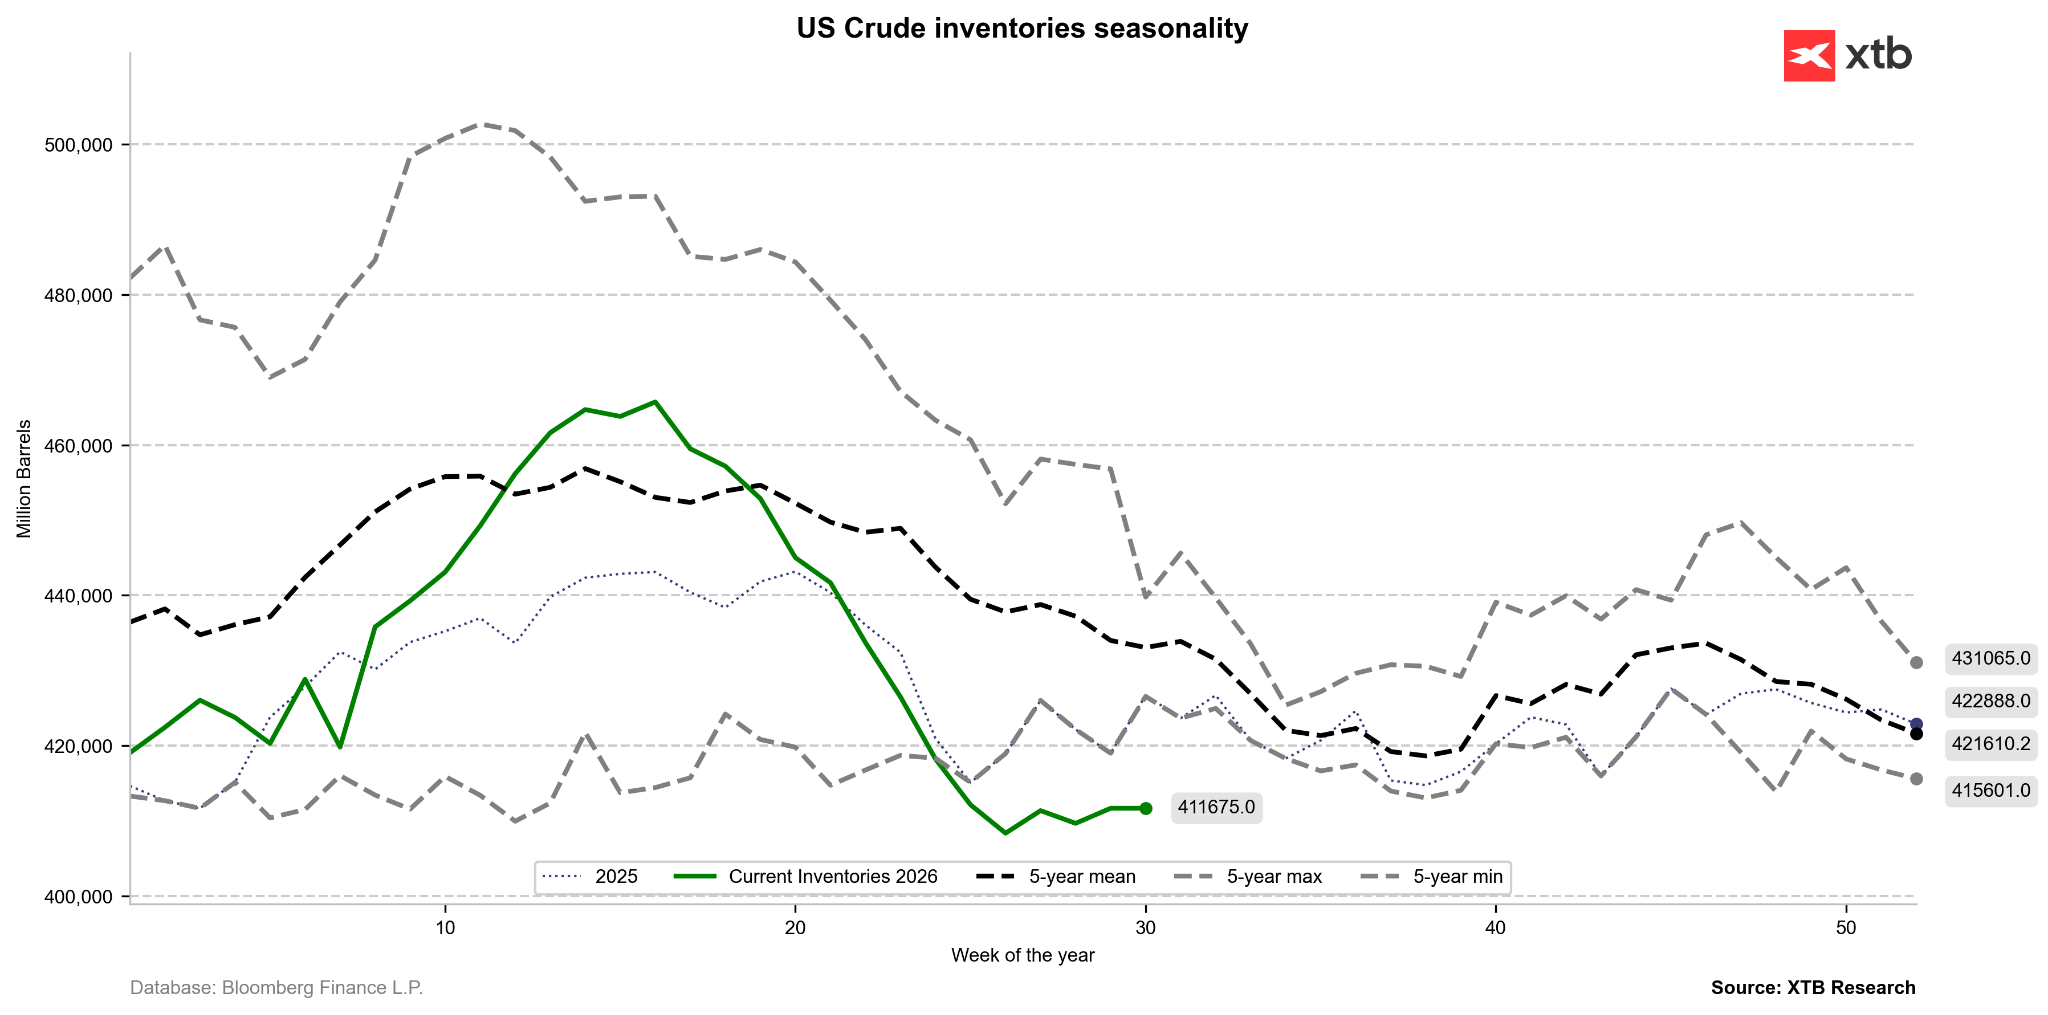
US crude oil stocks also rose, although the latest reports indicate a further decline in reserves, close to 300 million barrels.
According to Citi, the IEA may coordinate further releases of reserves and stocks if the situation does not normalize in the near future. The previous program of releasing 400 million barrels is expected to be completed within 1-2 months.
A noticeable acceleration in fuel processing in China is observed, which may be related to the normalization of the situation or the desire to sell fuels (e.g., to Russia) due to high margins. Utilized processing capacities at state refineries increased from approx. 67% at the beginning of July to 75% currently. In private refineries, the increase is from approx. 43% to 48%.
Maritime Routes via Iran and JMIC
Proposed maritime routes via Iran and JMIC. It is worth remembering that using the Iranian route carries the probability of Iran collecting fees. Source: Bloomberg Finance LP Global Oil and Products Stocks
Global oil and products stocks have increased recently. Source: BloombergNEF Oil Production and Export in Iran
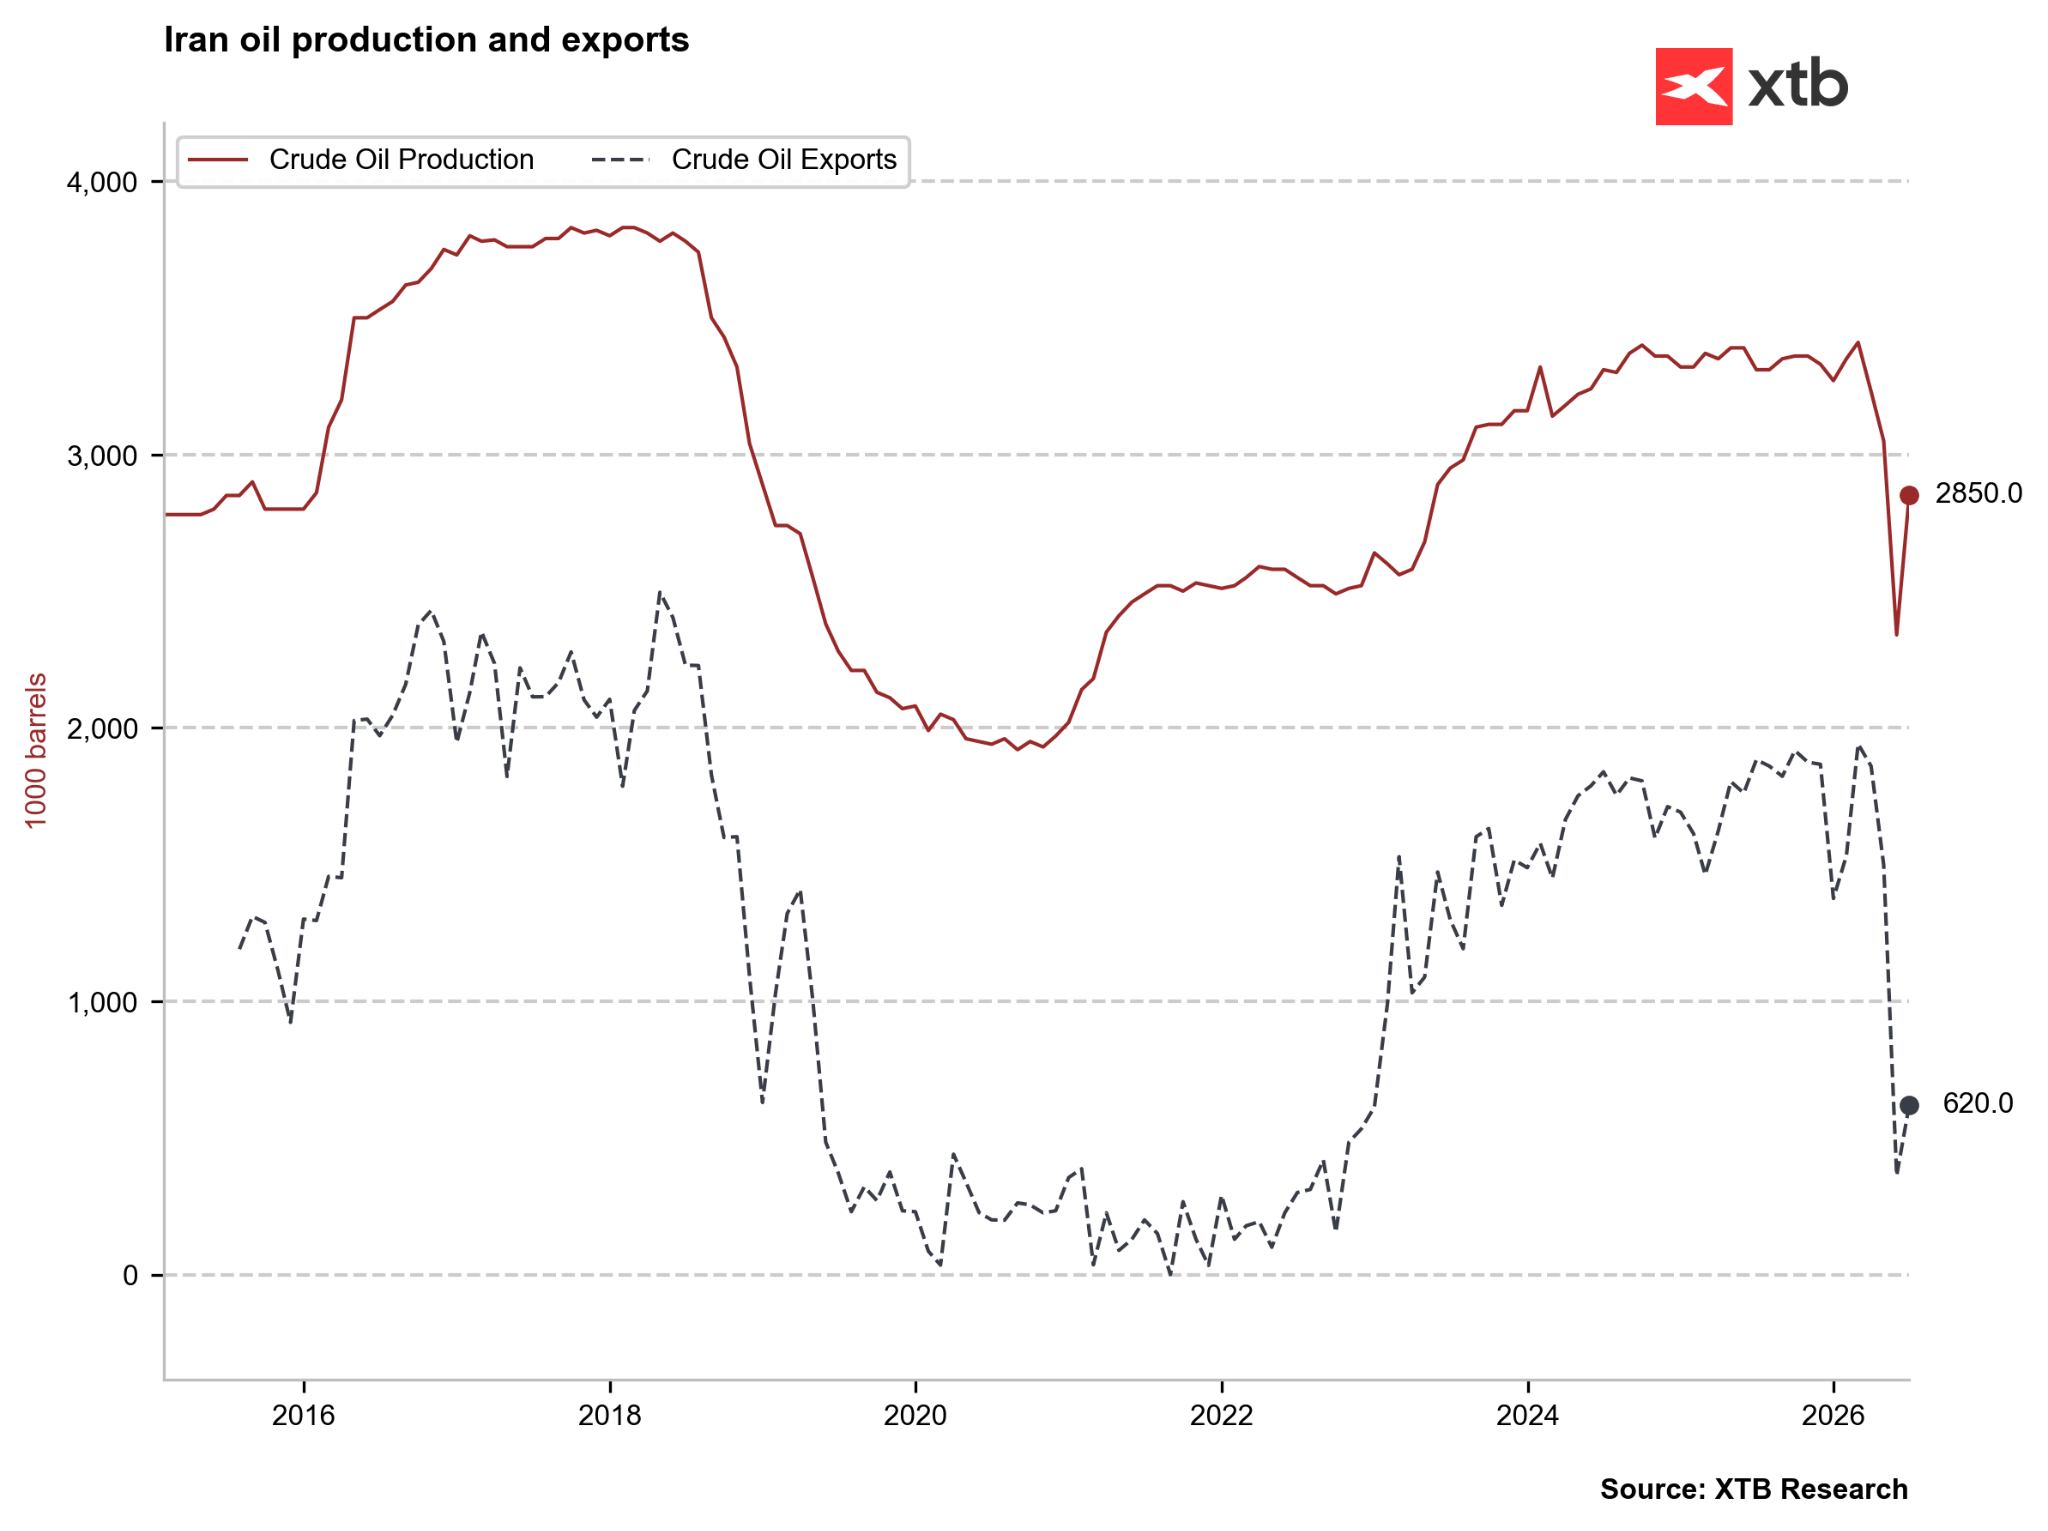
Iran’s production has clearly rebounded, but exports remain approximately 3 times lower than pre-war levels. Source: Bloomberg Finance LP, XTB Oil Price vs. Crack Spread
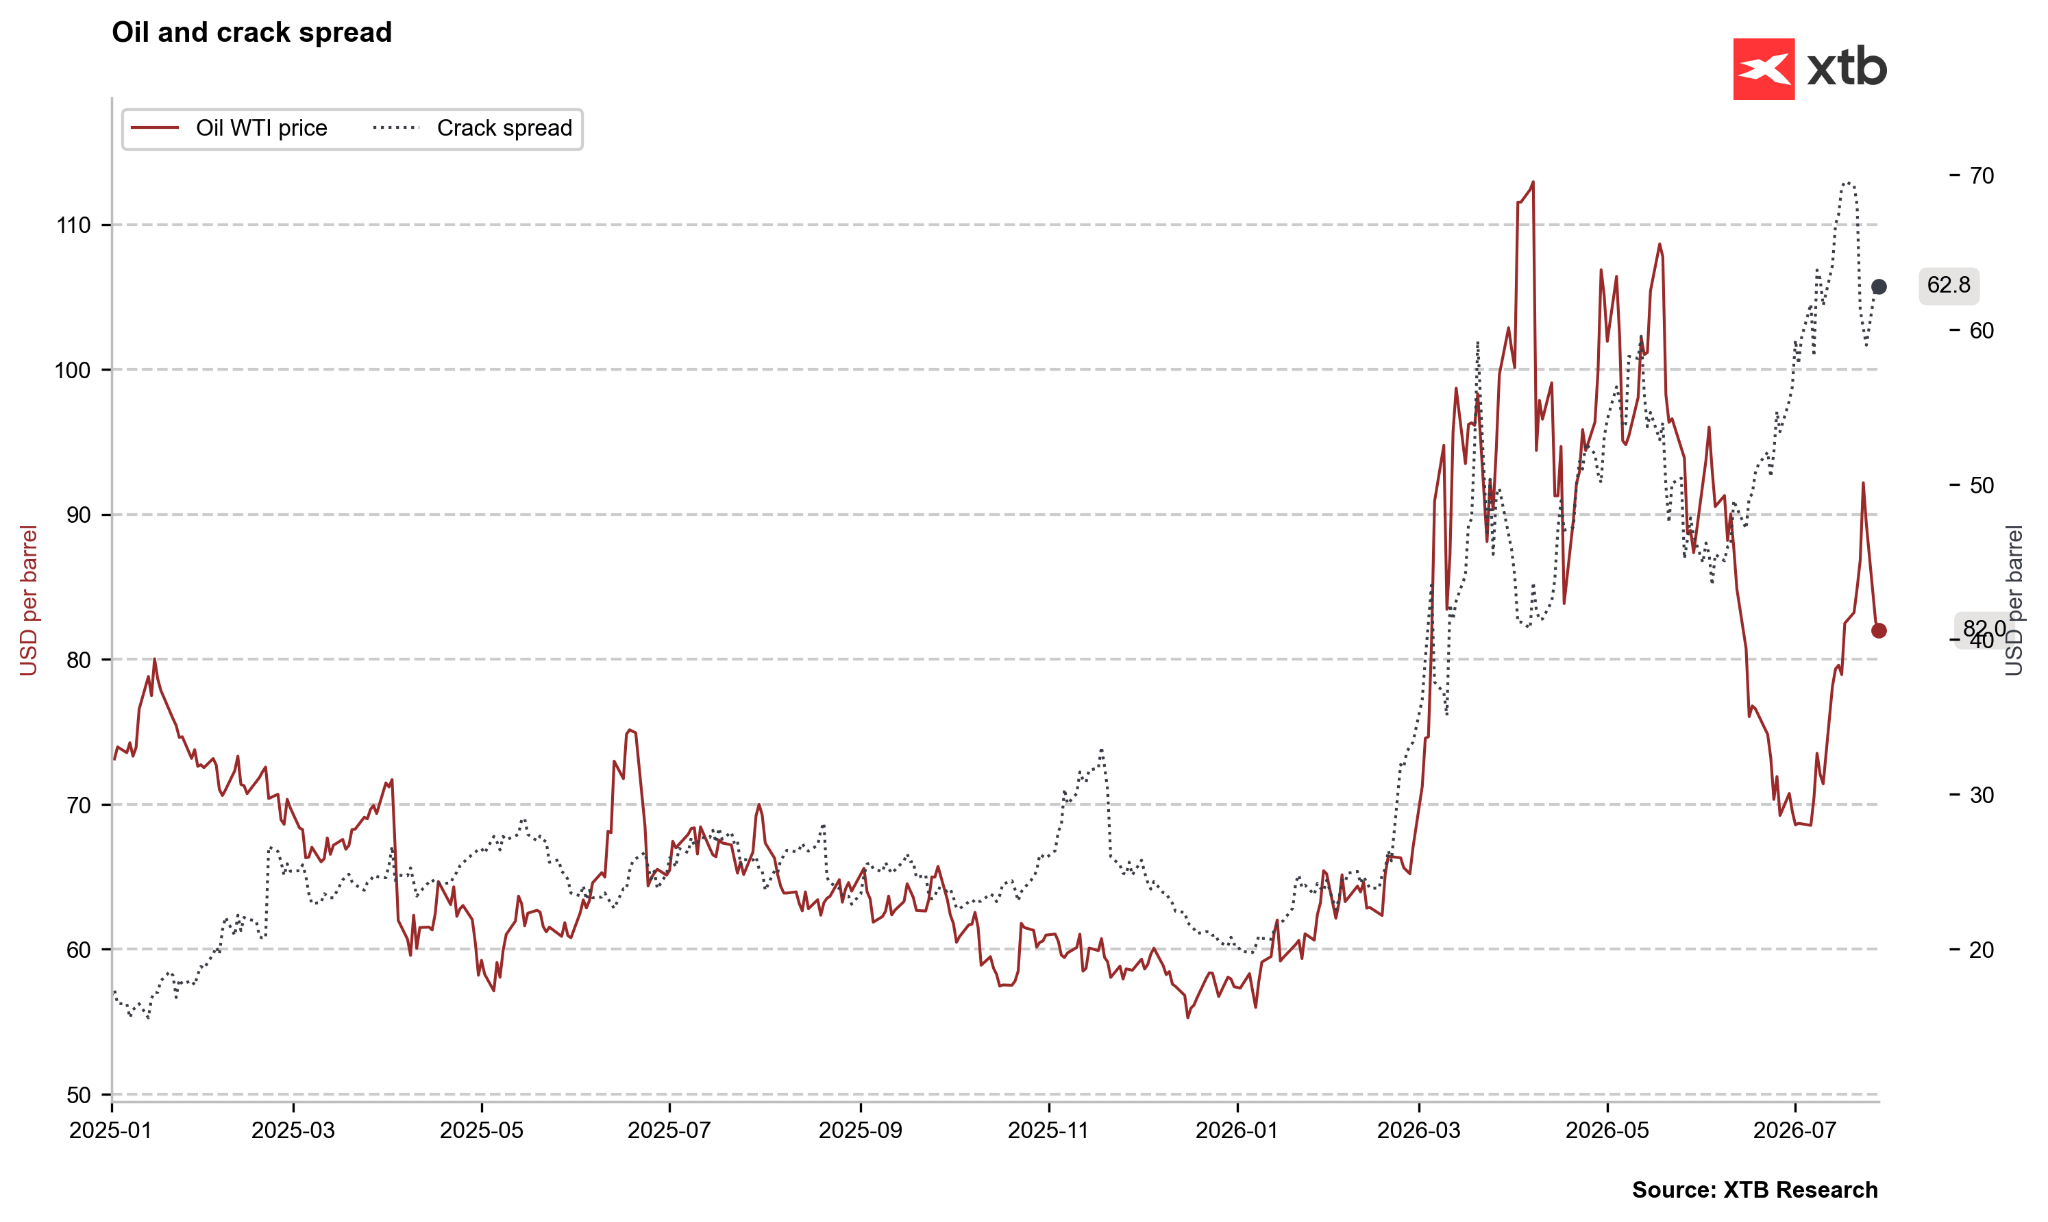
Crude oil is falling, while the crack spread is showing a small rebound and remains near historical highs. Source: Bloomberg Finance LP, XTB US Crude Oil Inventories
US crude oil inventories are stabilizing. Source: Bloomberg Finance LP, XTB
💨 Natural Gas (TTF + Henry Hub)
Prices for gas contracts in Europe (TTF) continue to fall, declining by another 3.1% to 56.46 EUR/MWh (64.21 USD/MWh) after an earlier drop at the beginning of the week reaching up to 10% due to optimism surrounding de-escalation in the Middle East.
Although gas prices in Europe are falling, an increase in demand in Asia is observed, which may divert supplies from the US to the eastern market, potentially leading to issues with replenishing storage before the winter season.
Currently, storage fill is about 55%, compared to a 5-year average of 71%, with a goal of 90% before November 1.
Natural gas prices in the US are also falling sharply, which may be a symptom of sentiment regarding the potential opening of the Strait of Hormuz. However, it is worth remembering that Qatar will not resume LNG supplies at a normal level until at least mid-September, which is why LNG exports from the US will remain high for many weeks to come.
A slight cooling in the Midwest region has caused US gas consumption forecasts to decrease.
Additionally, strong El Niño suggests that gas consumption during the winter may be lower, indicating that current inventories will be sufficient.
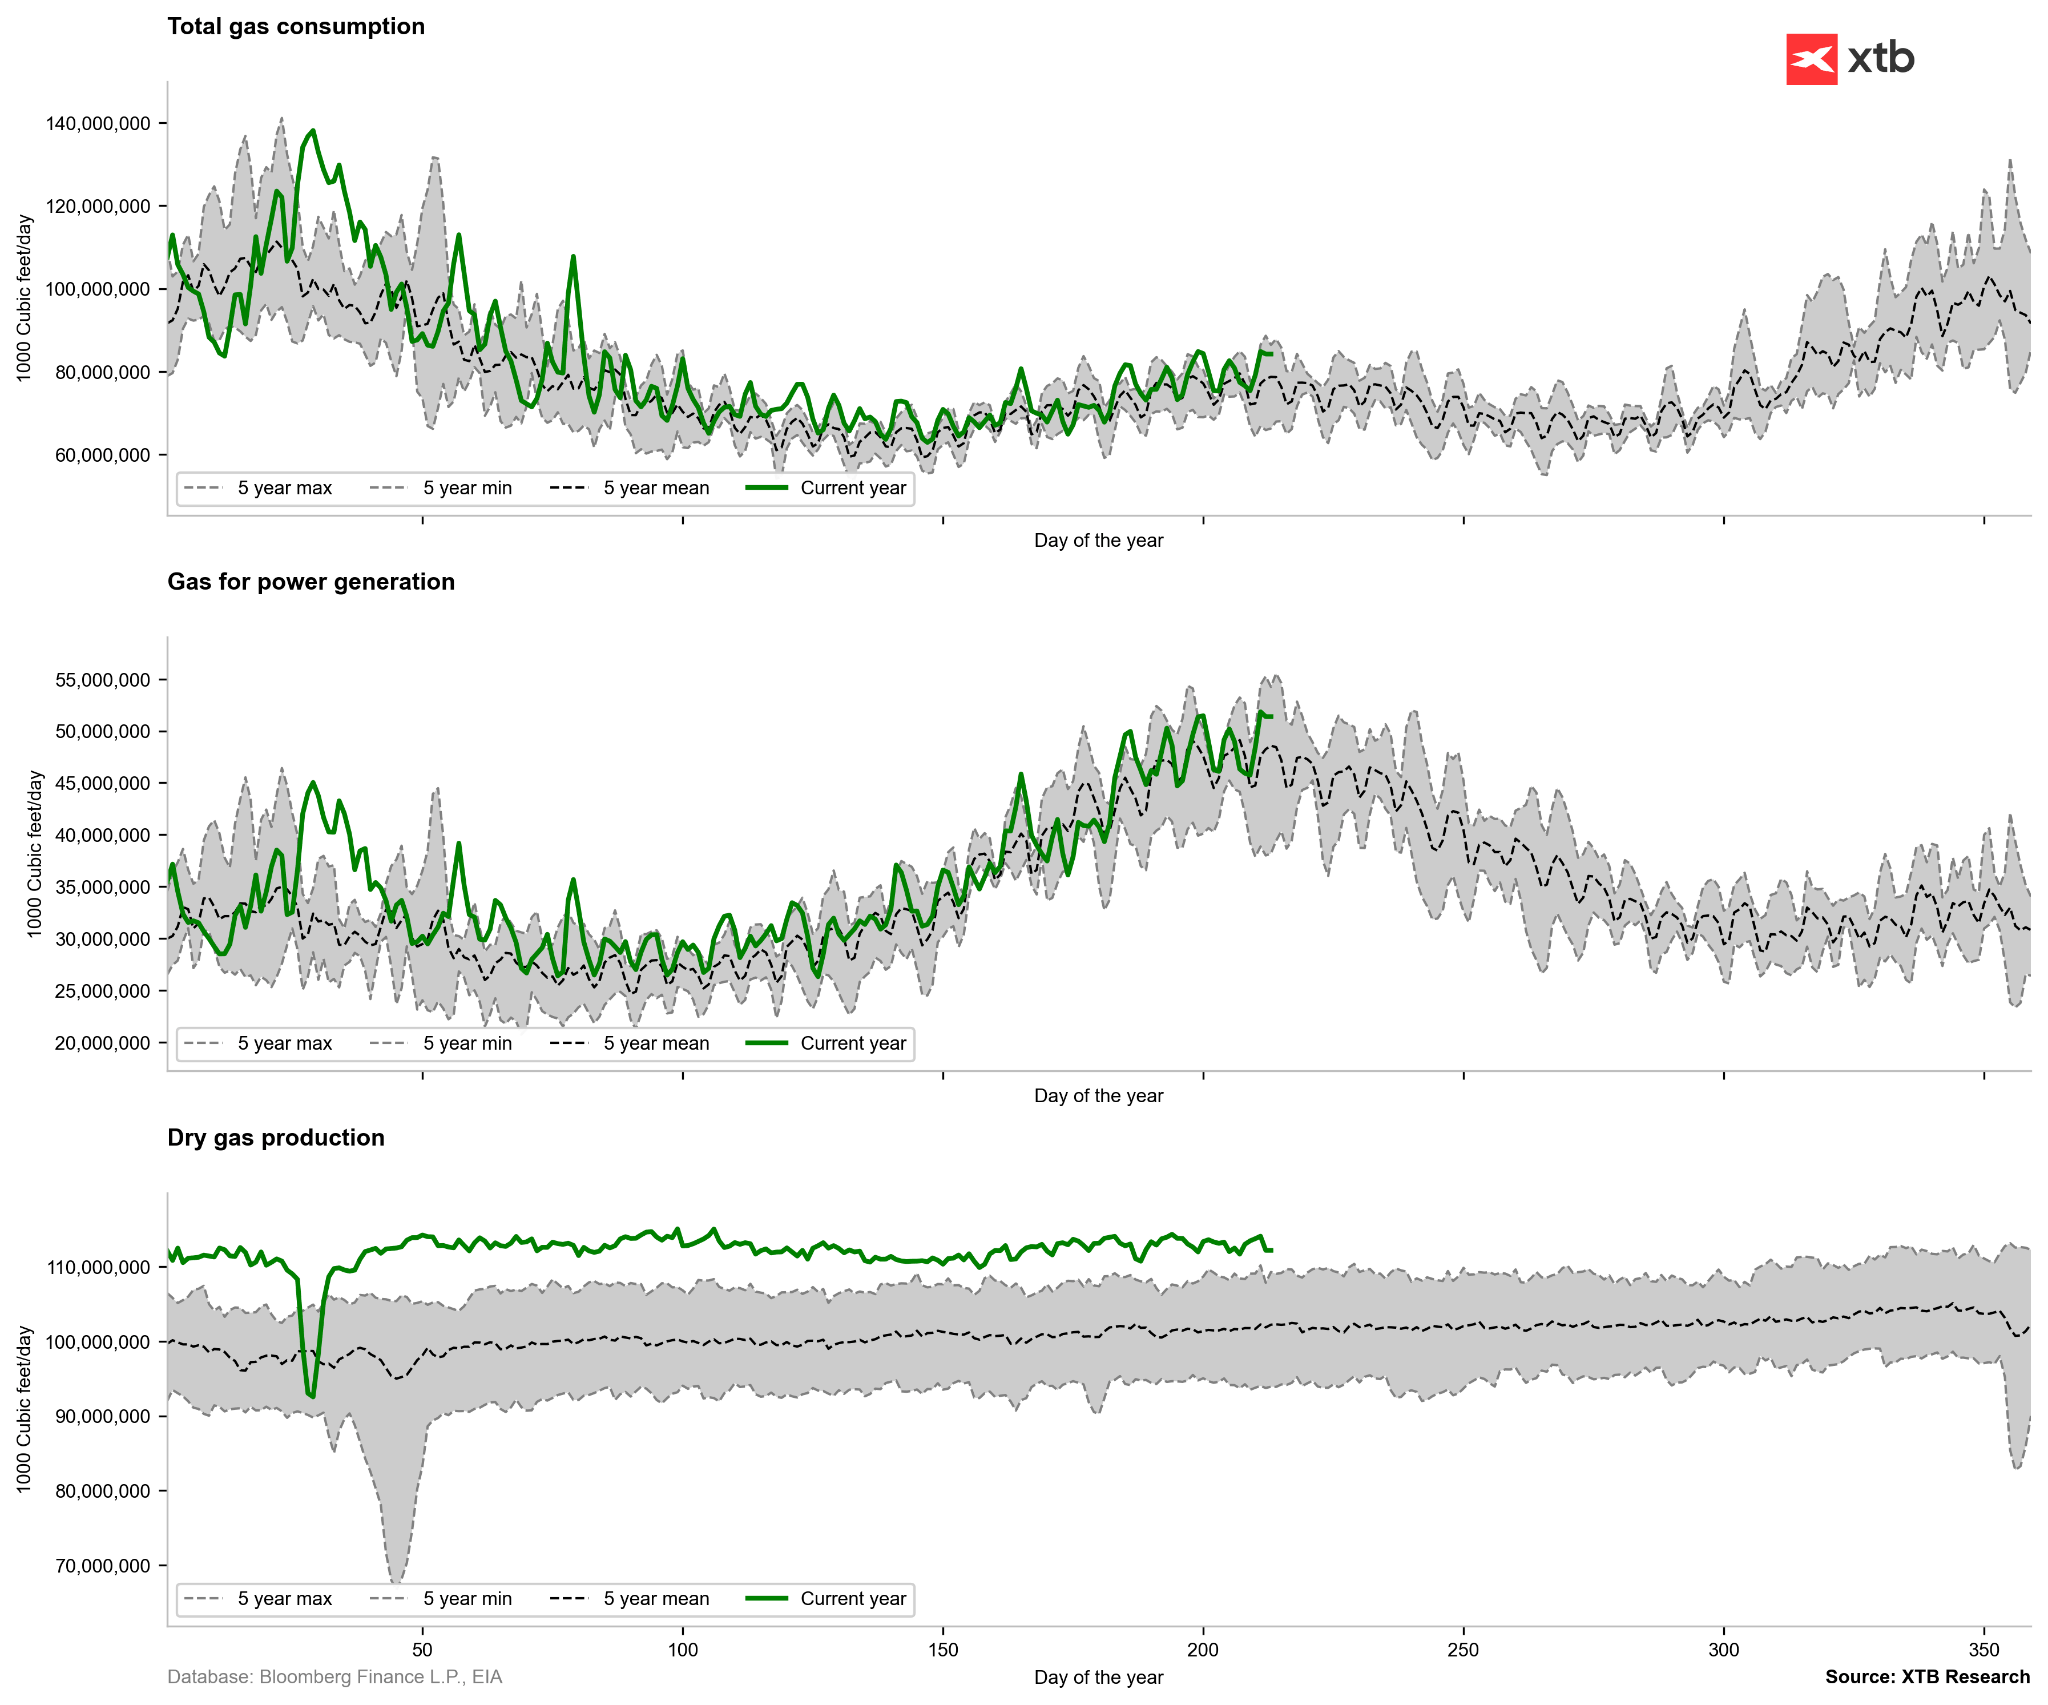
Gas production on Monday was 113.1 bcfd, an increase of 3.7% y/y, while demand was 81.4 bcfd, an increase of 2.7%. LNG exports were 18.1 bcfd.
EIA raised the forecast for average gas production to 111.2 bcfd at the beginning of July.
Natural Gas Demand
Gas demand remains above the 5-year average during the seasonal peak consumption period. Gas consumption for electricity production should fall in the coming weeks. Source: Bloomberg Finance LP, XTB Comparative Gas Stocks
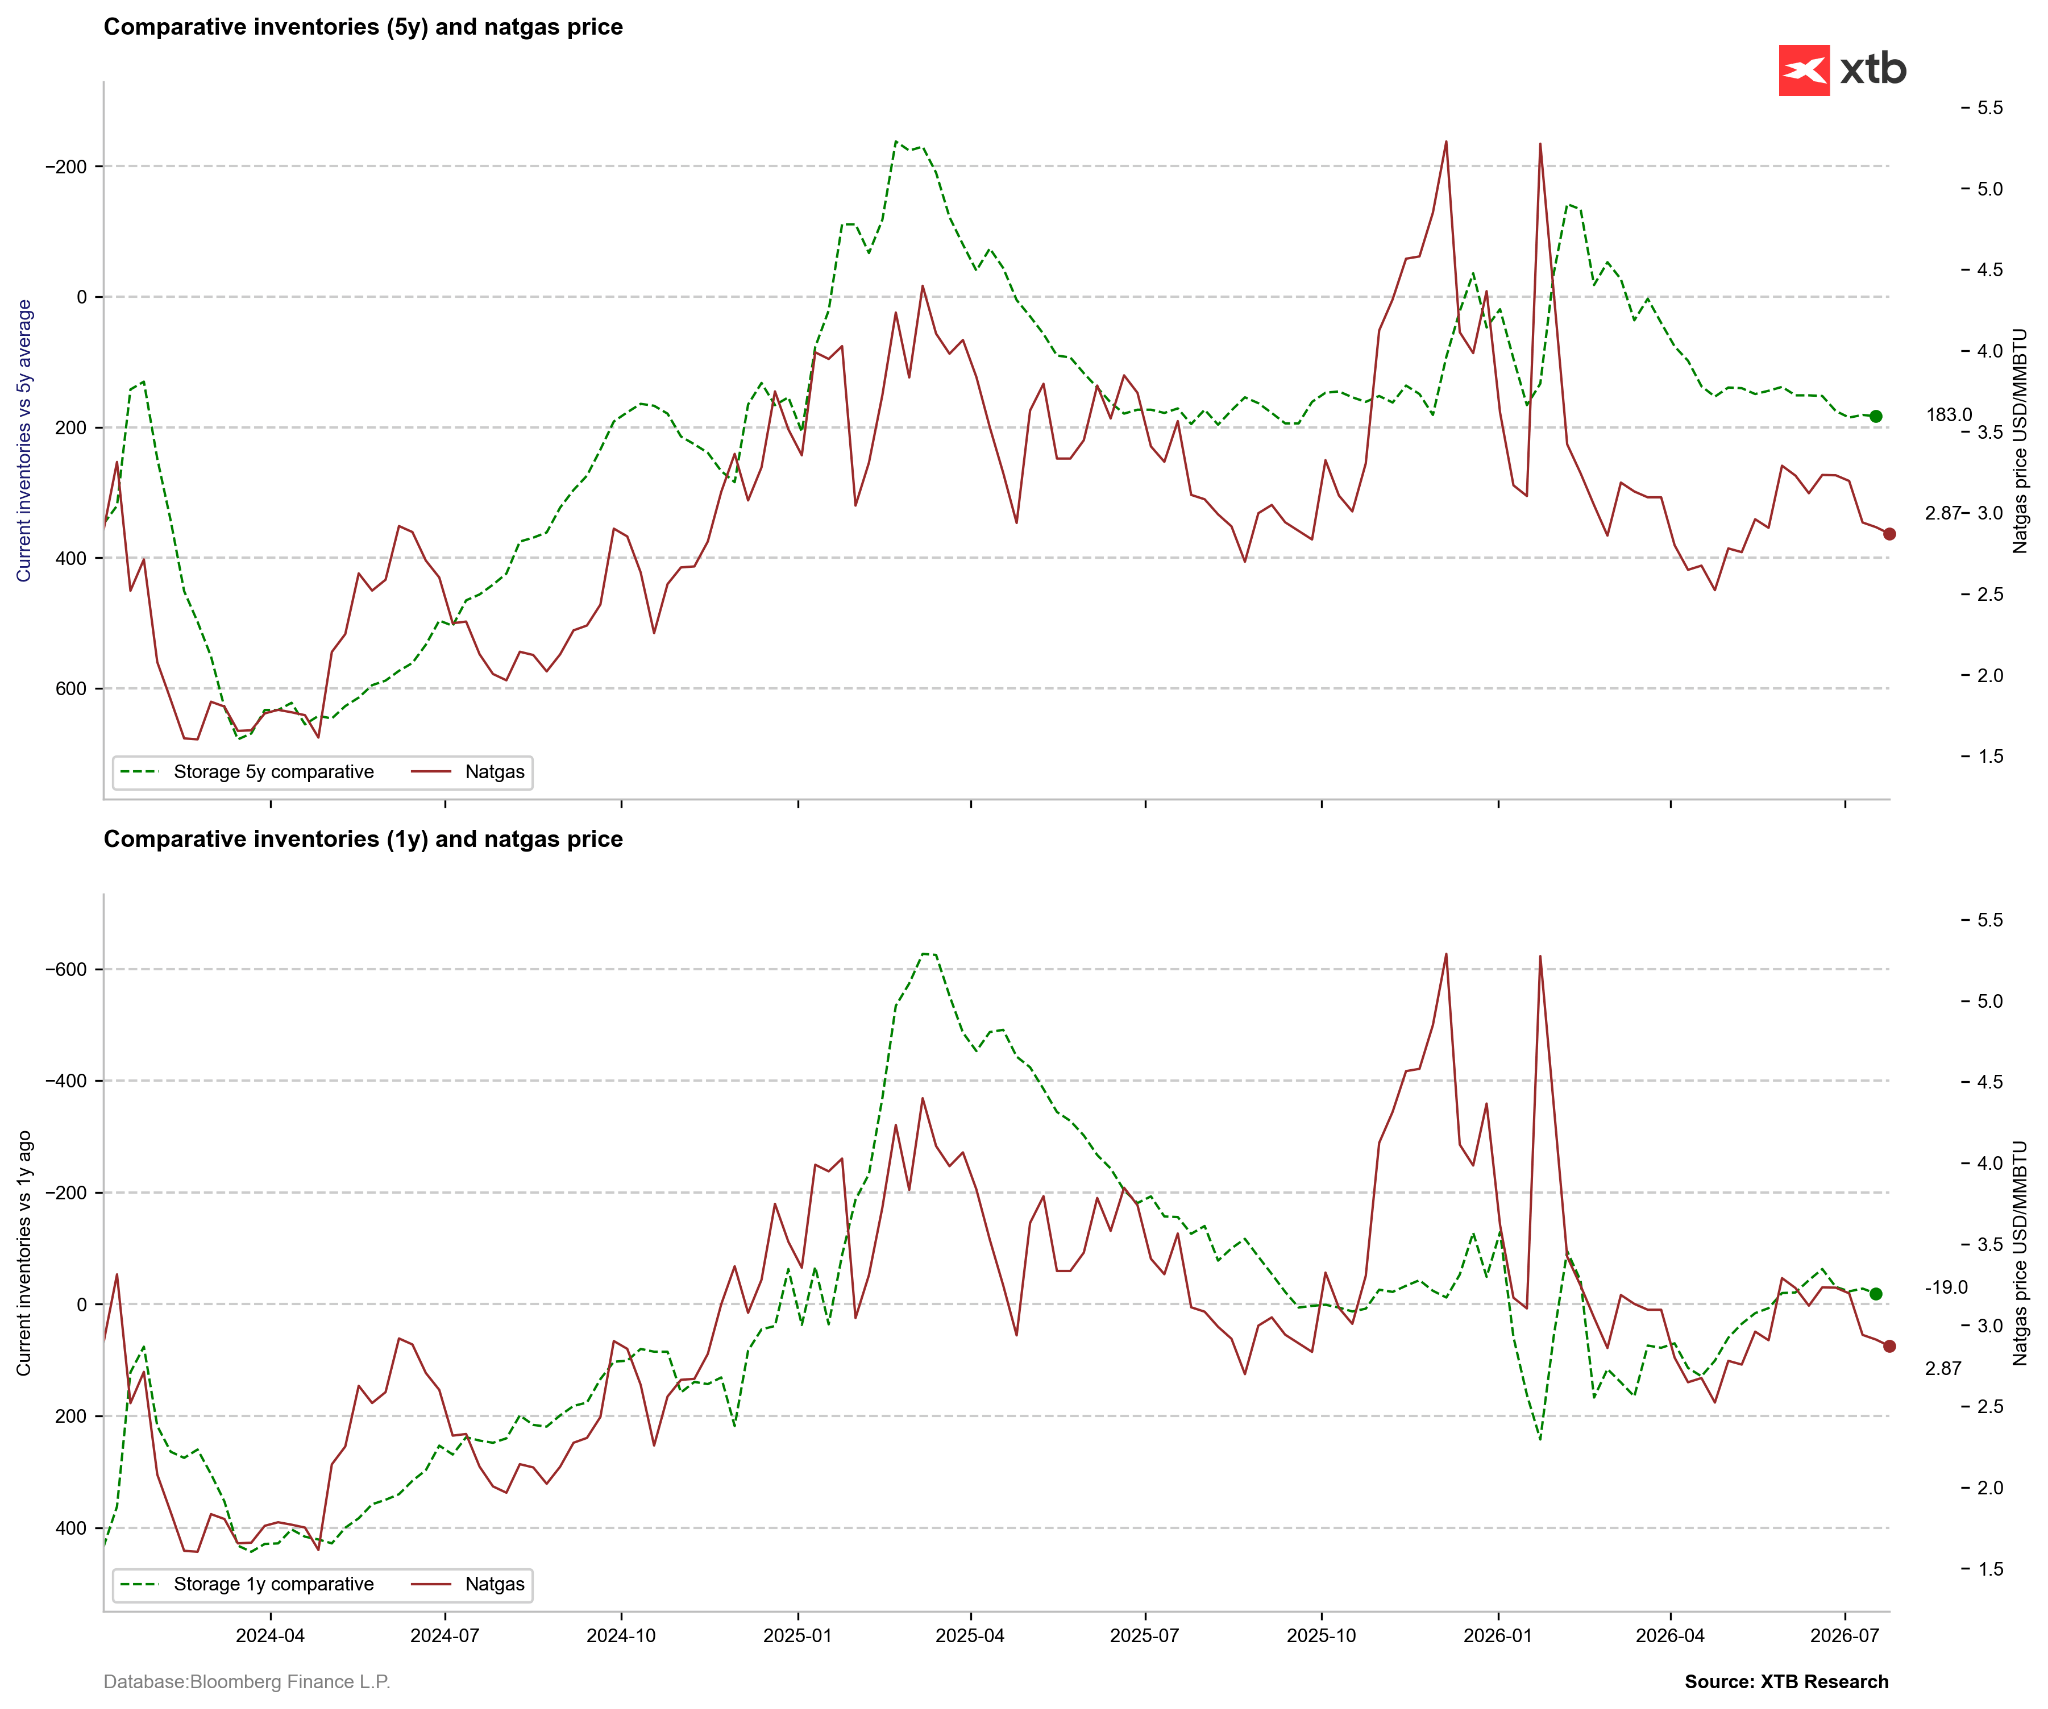
Comparative stocks have stopped increasing but remain at relatively high levels. Nevertheless, this potentially indicates an undervaluation of gas prices. Source: Bloomberg Finance LP, XTB Natural Gas Price Seasonality
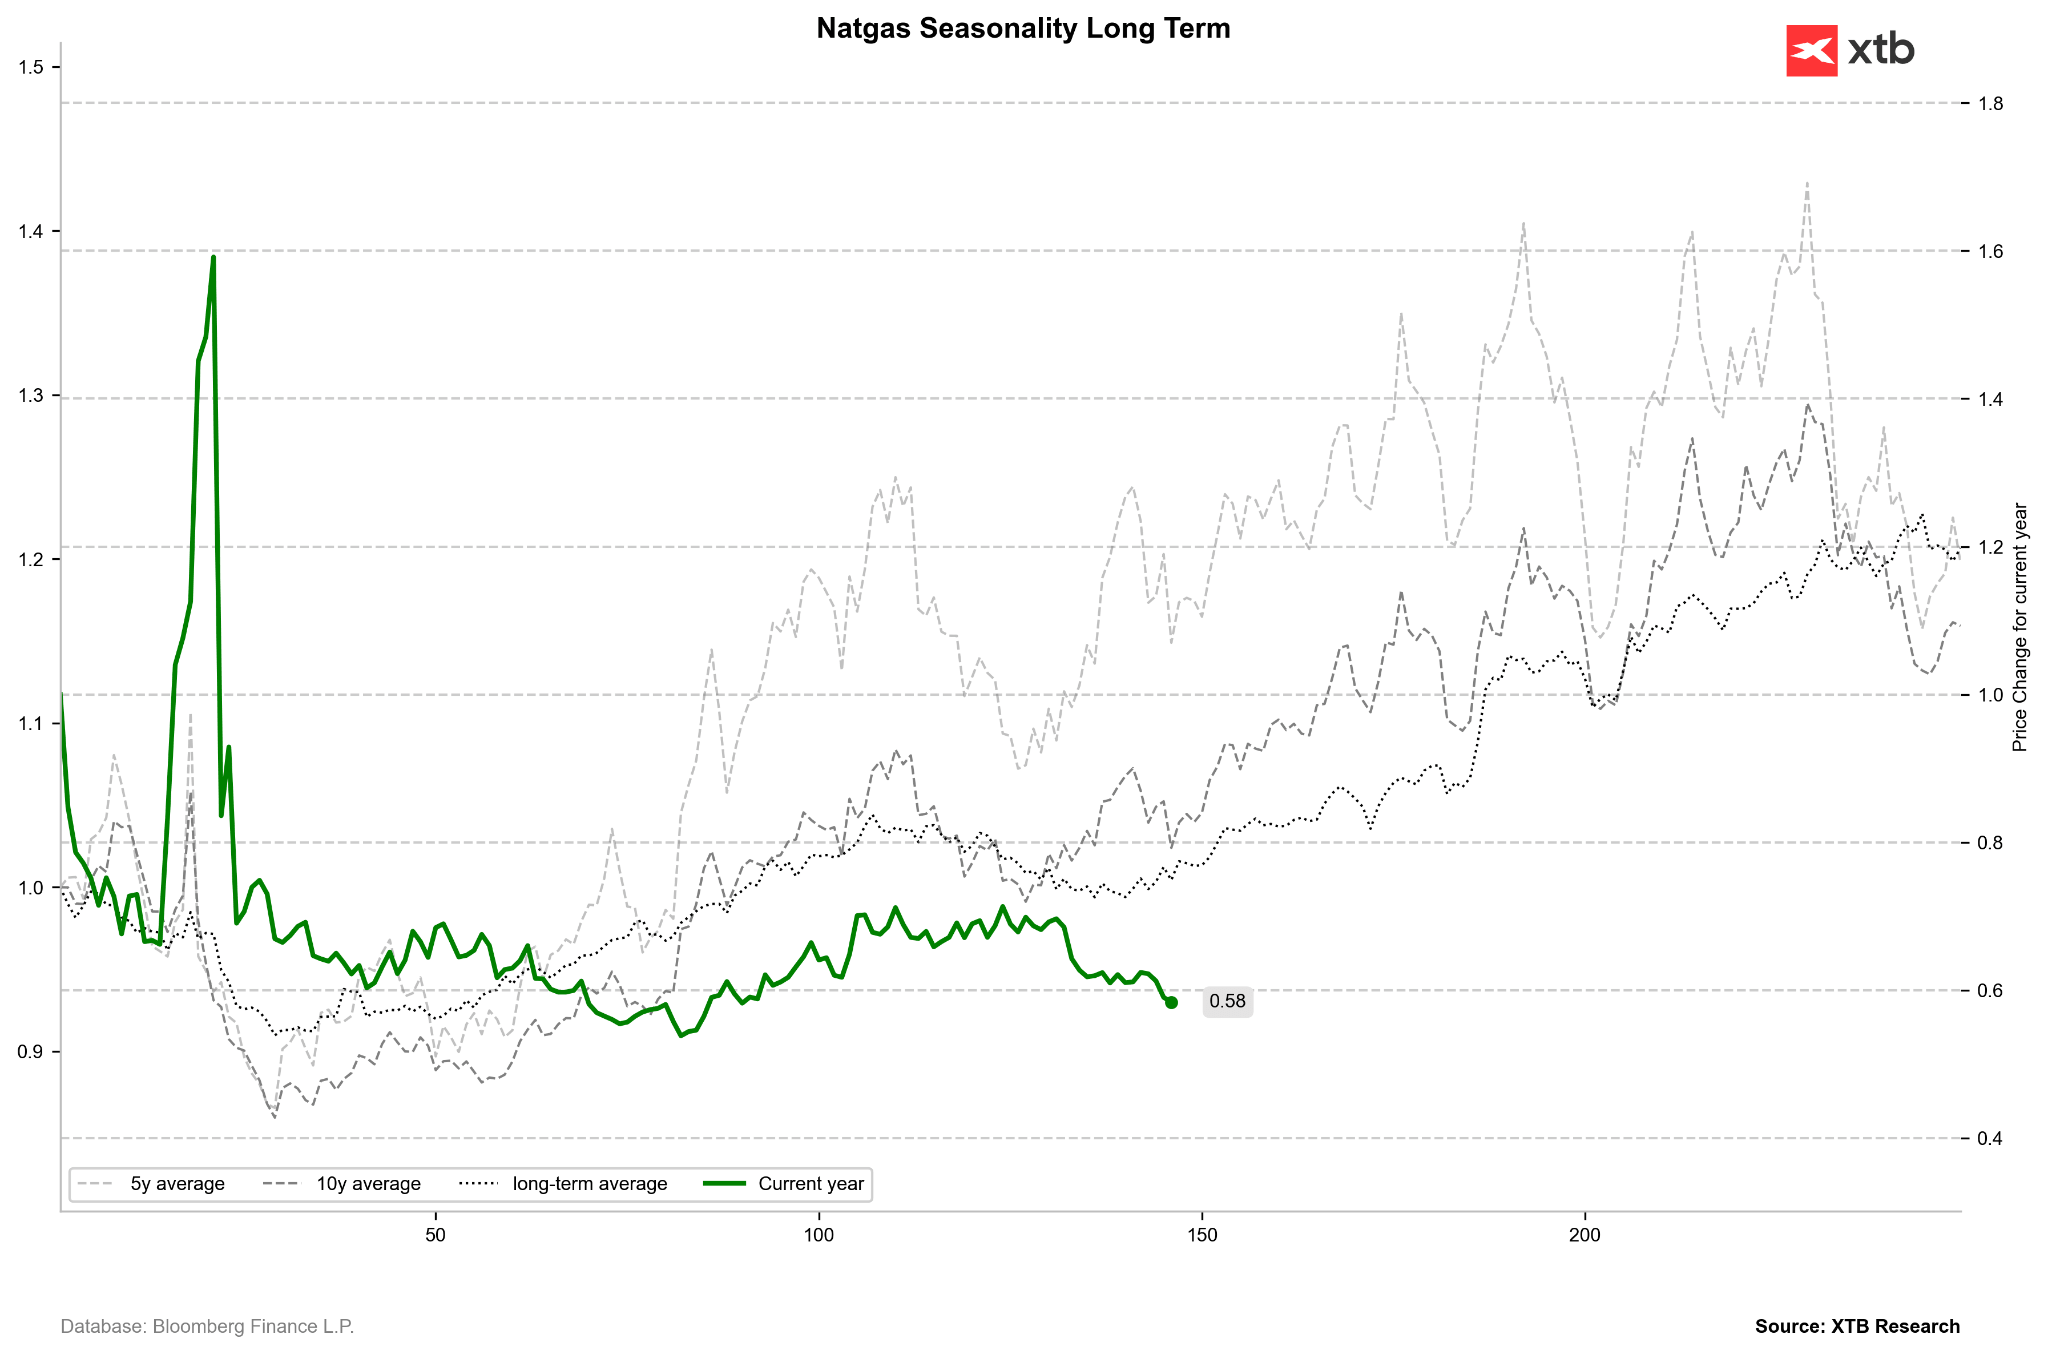
The current price behavior is completely contrary to short-term and long-term seasonality. It is worth remembering that the next two roll-overs will be relatively flat. Source: Bloomberg Finance LP, XTB Temperature Forecasts
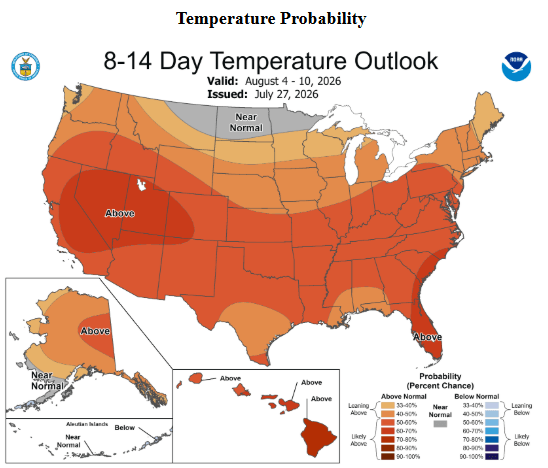
Although temperatures have been slightly lower than previously forecasted recently, a return to higher temperatures is expected at the beginning of August. Source: NOAA Technical Analysis of Gas Prices
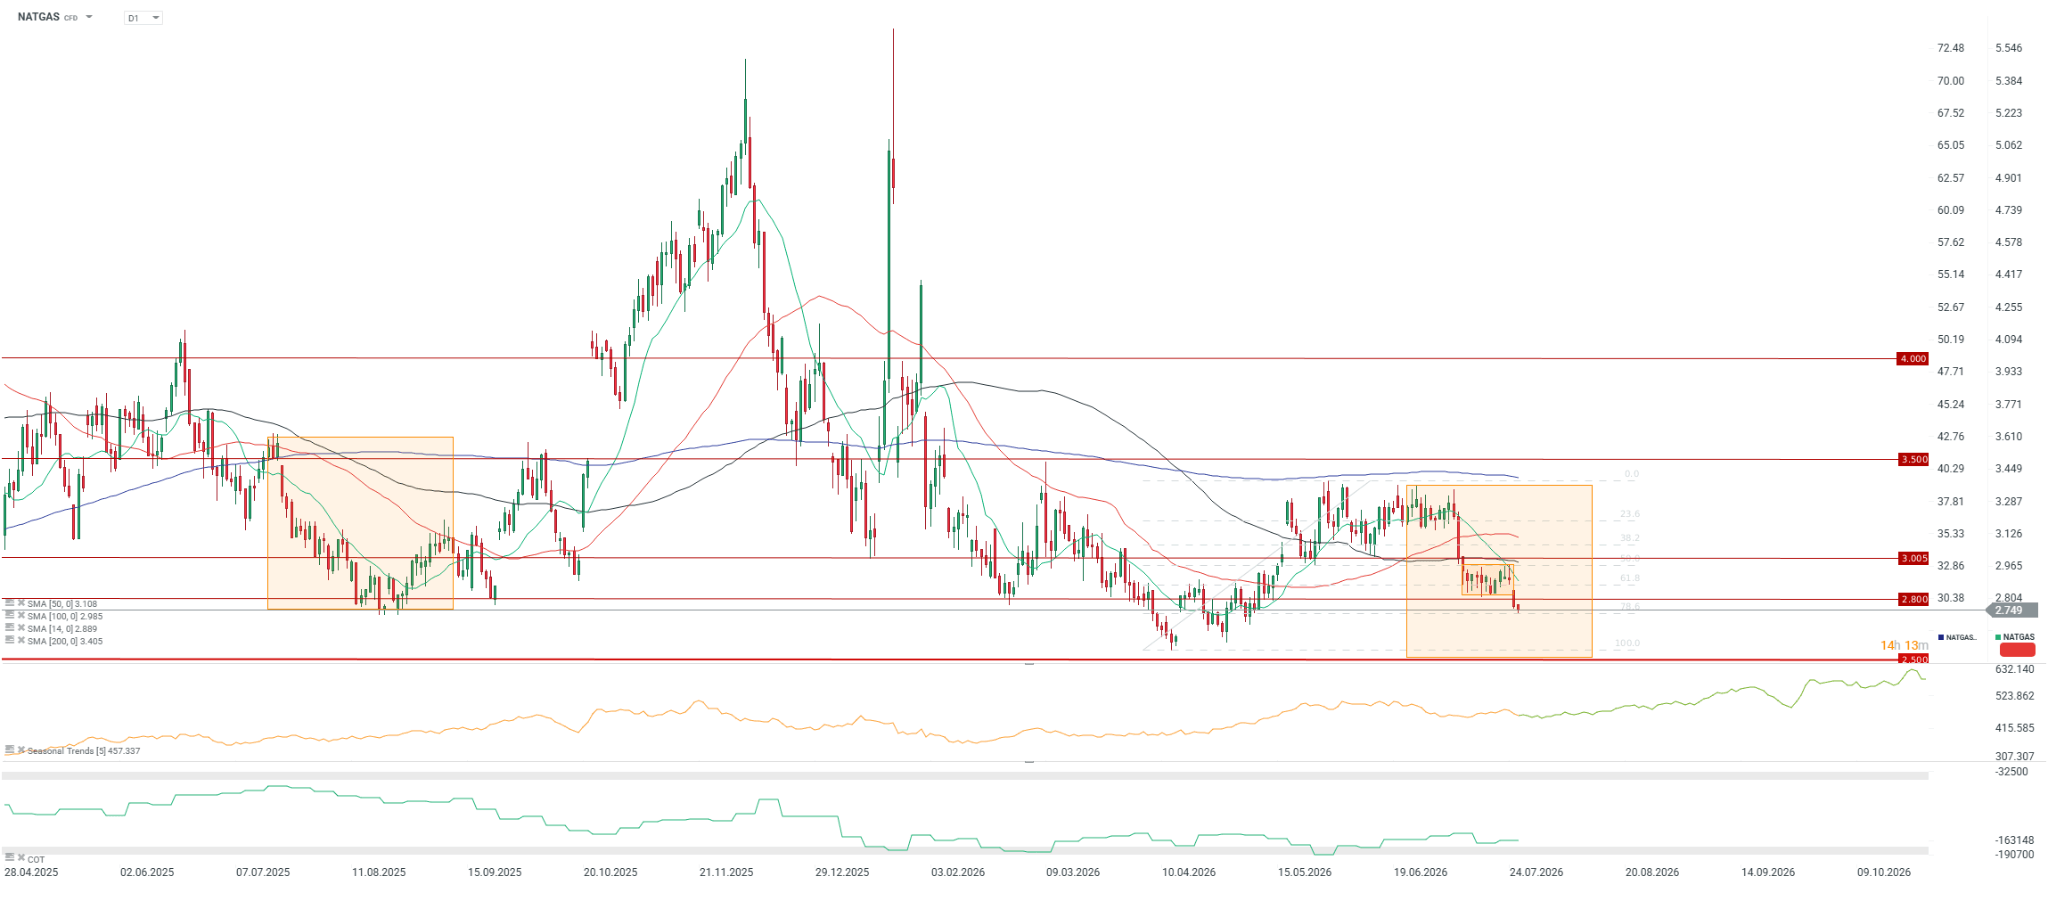
The price finally breaks out of the consolidation downwards and tests the last support at the 78.6 retracement. Last year, the downward wave in the summer period ended only in the second half of August. A similar range would currently indicate 2.5 USD/MMBTU. Source: xStation5
🟡 Gold
Gold prices fell below $4050 per ounce ahead of the upcoming Federal Reserve meeting.
Markets are pricing in slightly over 33% chance of a 25 basis point Fed rate hike. At the same time, a full rate hike is priced in for September.
A potential rate increase or hawkish rhetoric from the Fed could strengthen bond yields and the dollar’s exchange rate, posing a risk of breaking the support at $4,000 per ounce and capital outflow from ETF funds.
Gold has remained above $4,000 per ounce since the end of June thanks to dip buying and steady demand from central banks.
A temporary pause in the fighting in the Middle East has eased concerns about further inflation growth.
Gold Seasonality
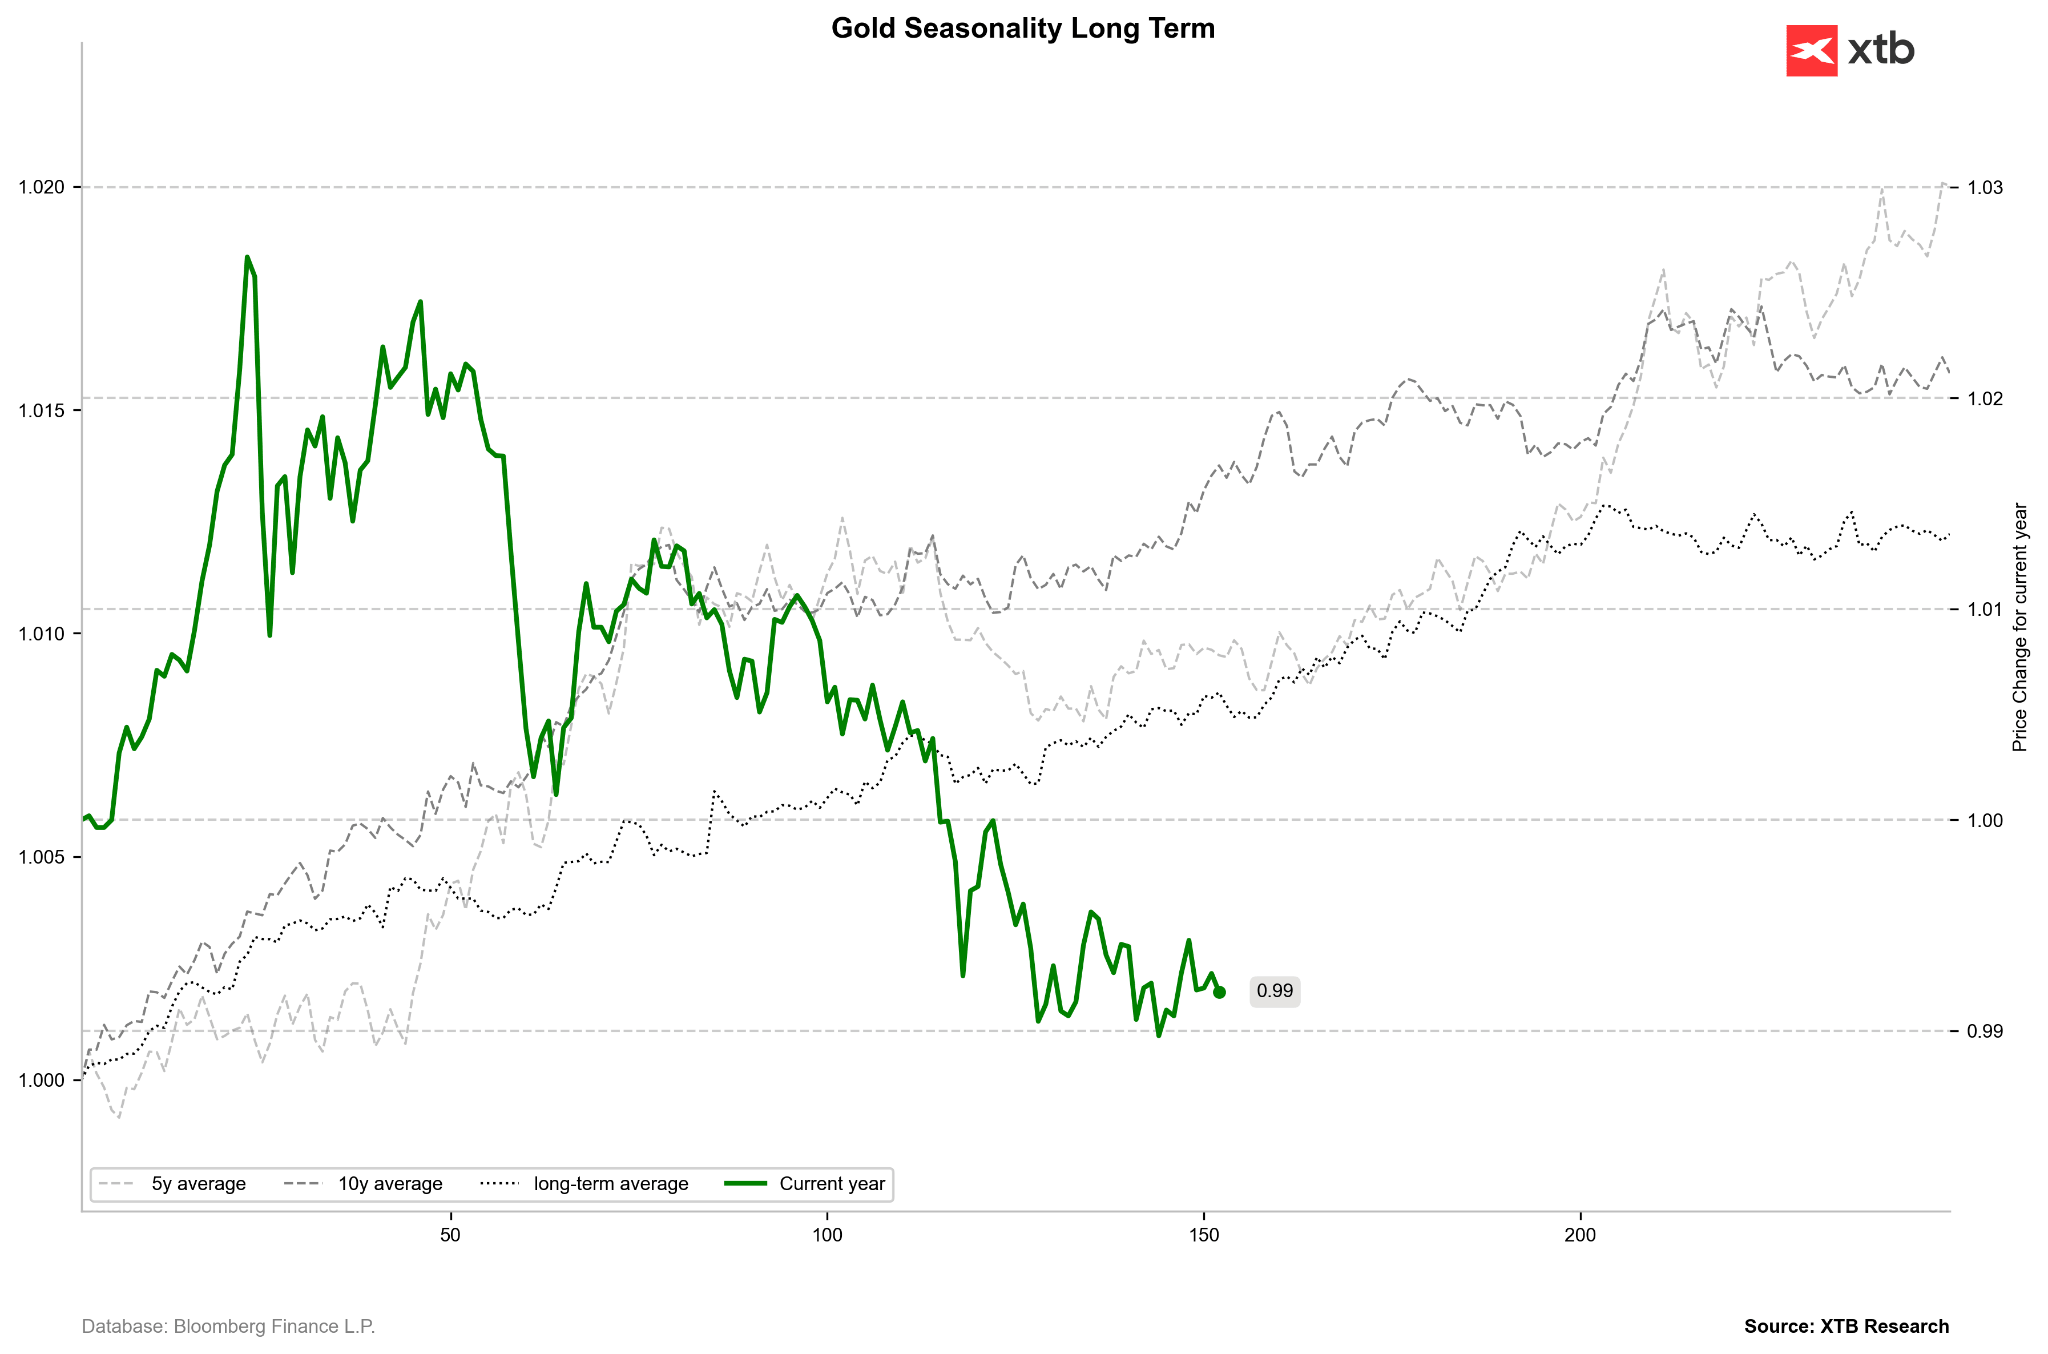
Gold should currently be in the phase of a seasonal rebound start. Nevertheless, we have been observing consolidation for about a month after sharp declines. Source: Bloomberg Finance LP, XTB Fed Interest Rate Expectations
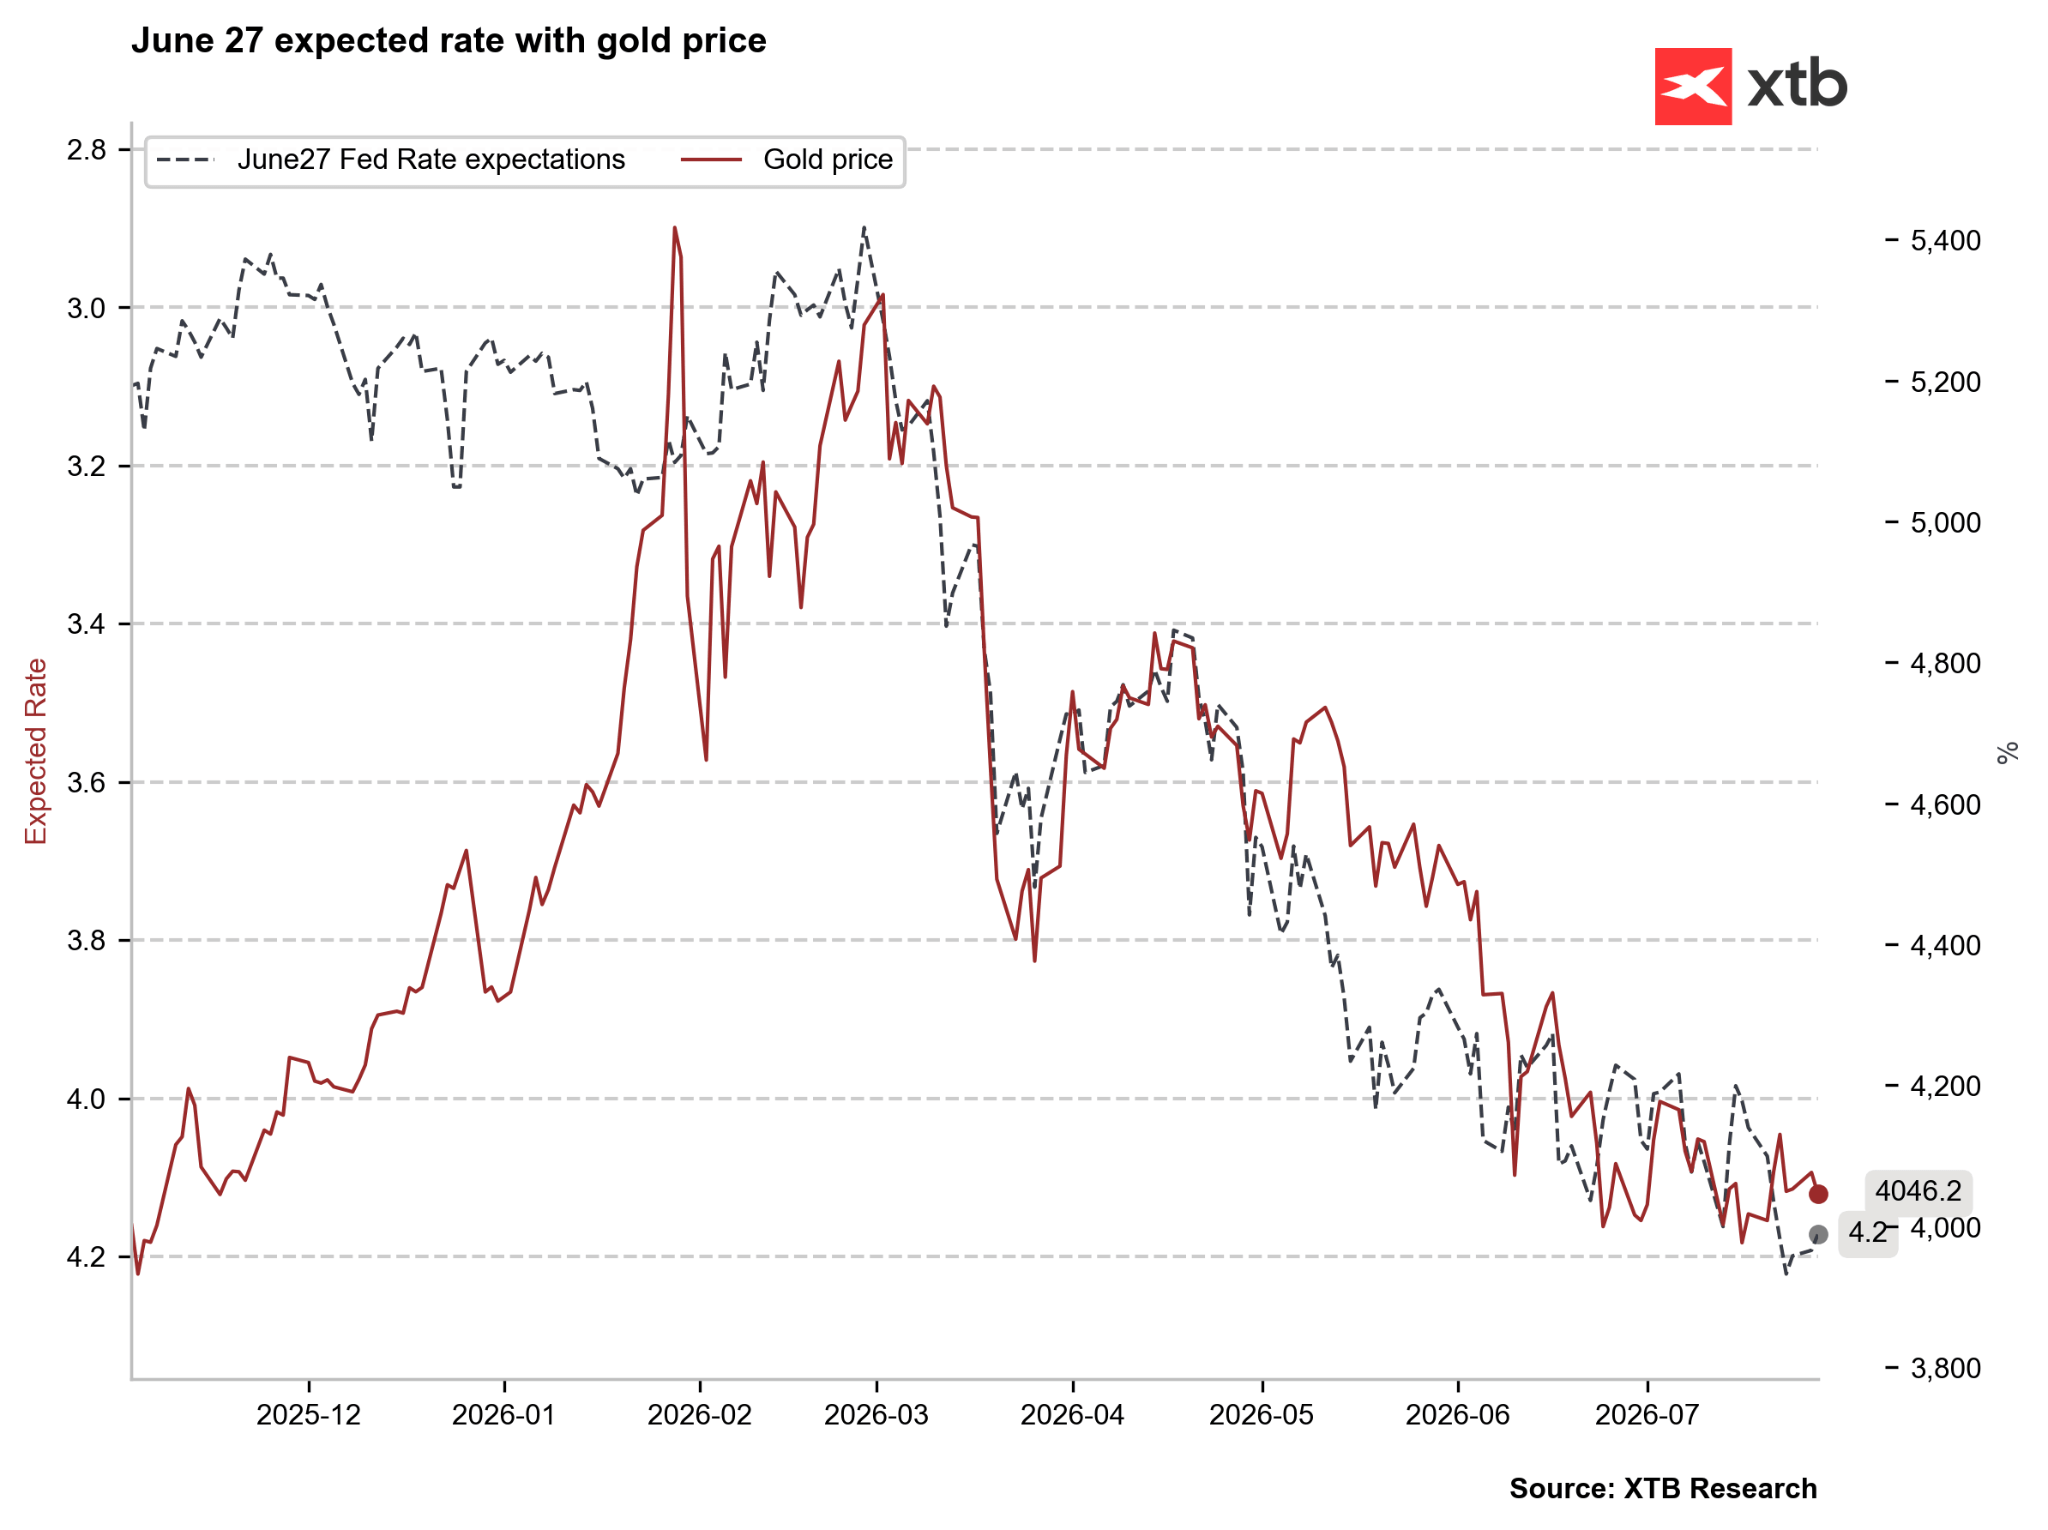
The effective rate is expected to be 4.2% by June next year, which would mean two full rate hikes from the current level. Gold is well priced relative to these expectations. Source: Bloomberg Finance LP, XTB Gold Purchases by ETFs
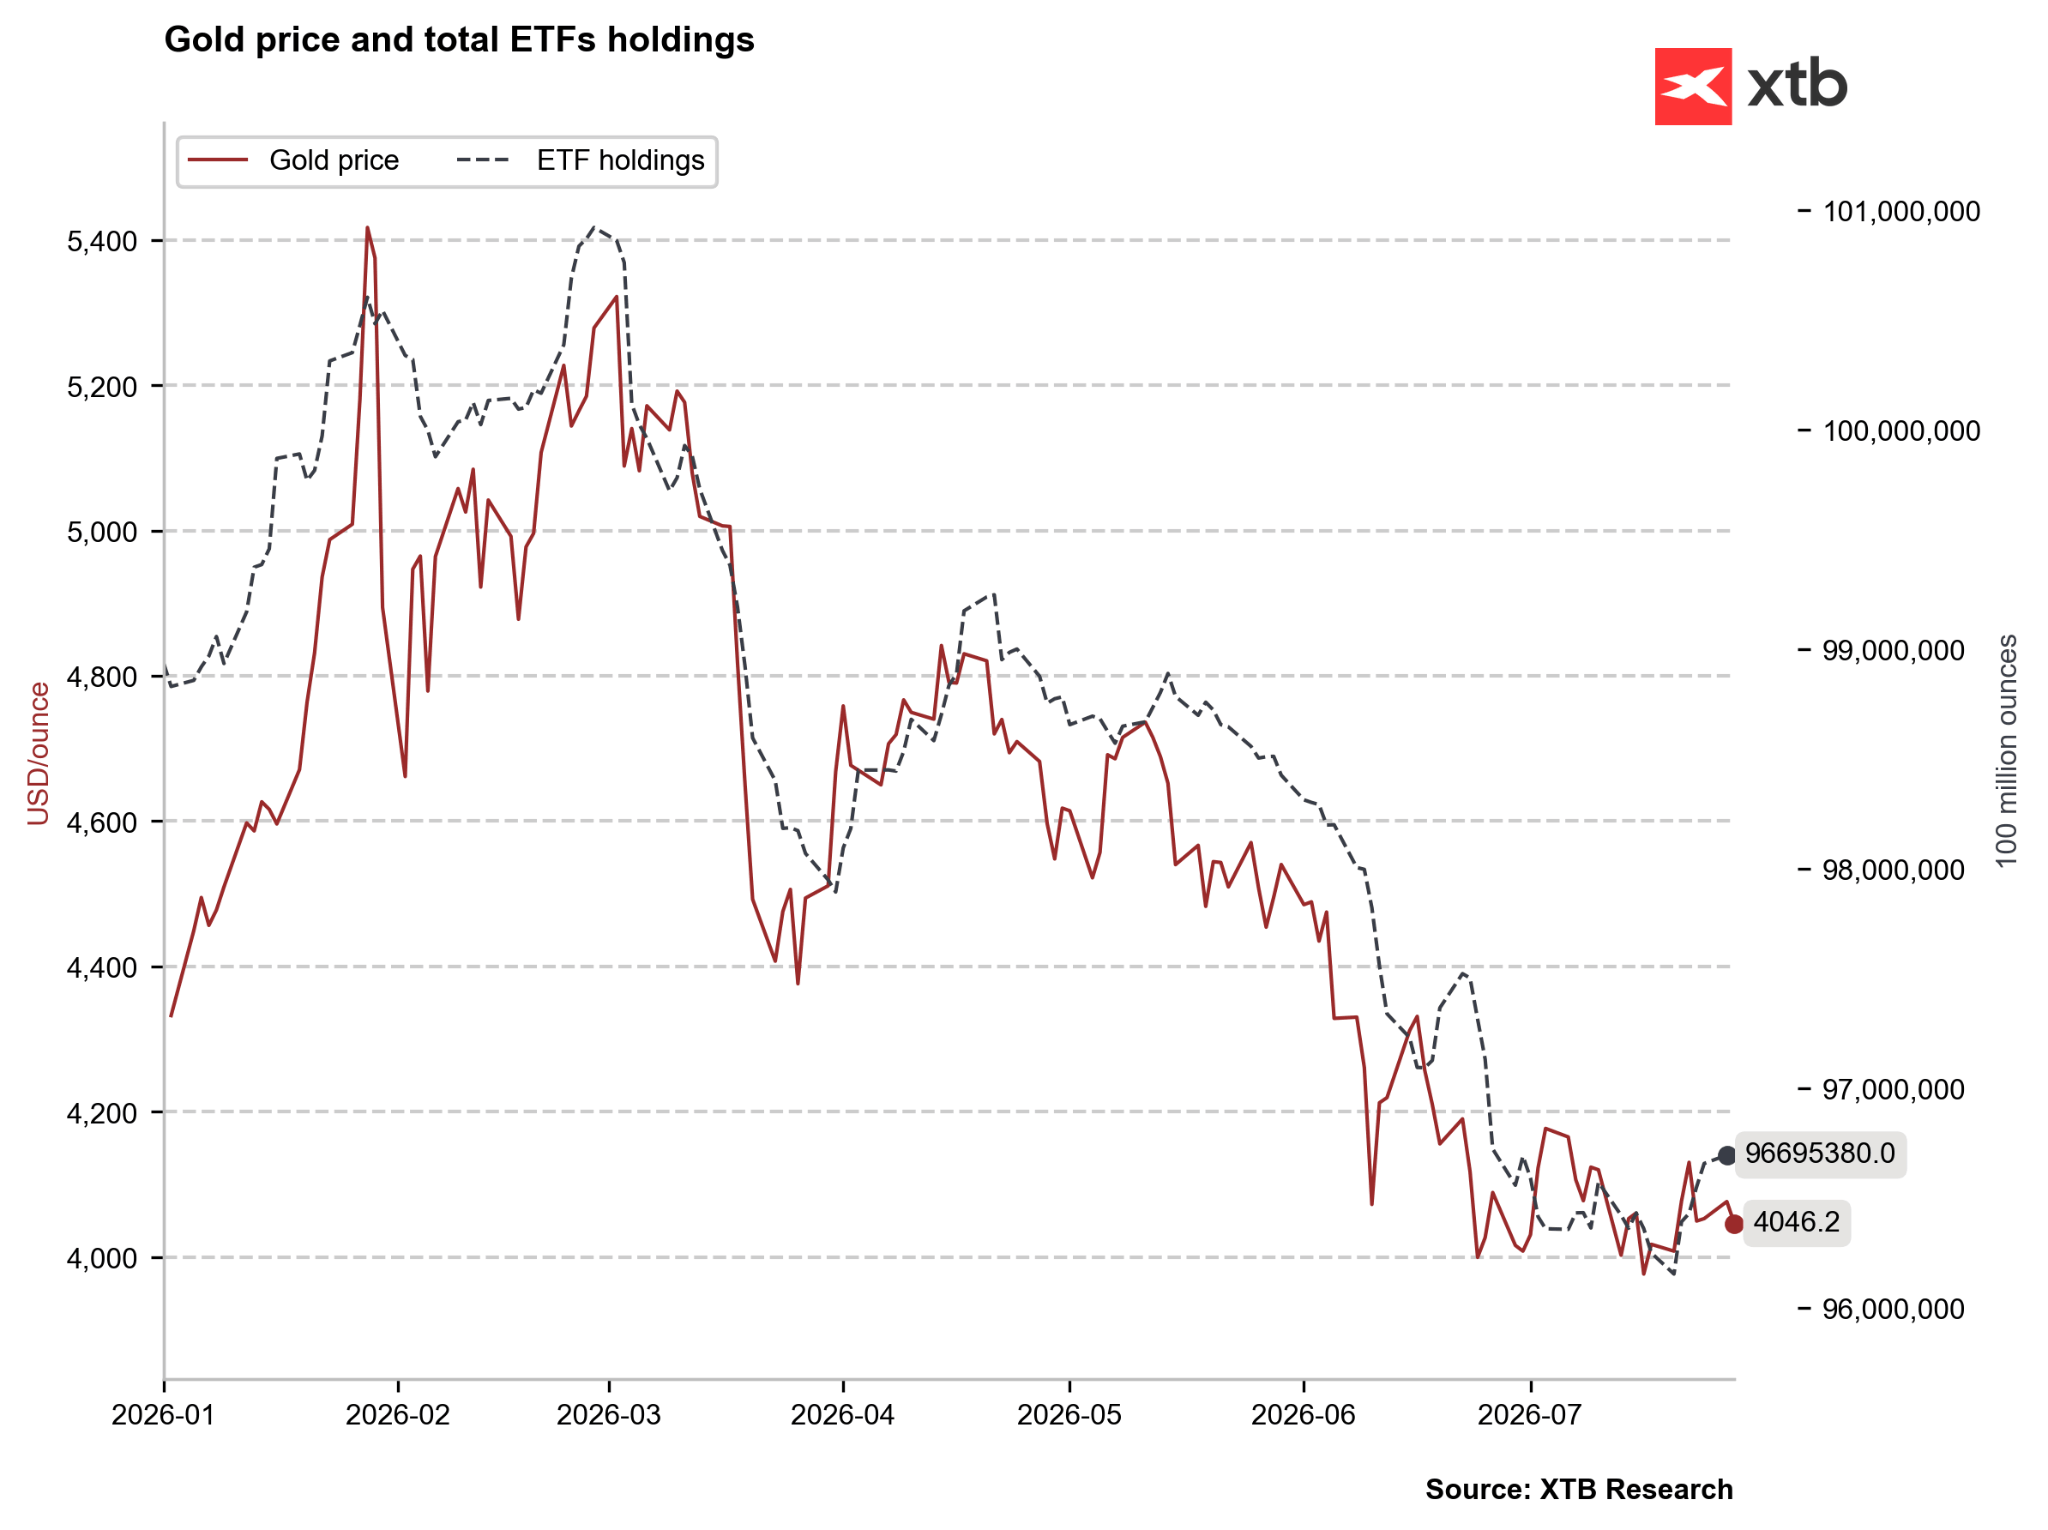
Despite mixed sentiment recently, ETFs are buying gold, and the rebound is already larger than in June. A dovish message from Warsh could push gold back towards $4200 per ounce. Source: Bloomberg Finance LP, XTB Gold Technical Analysis
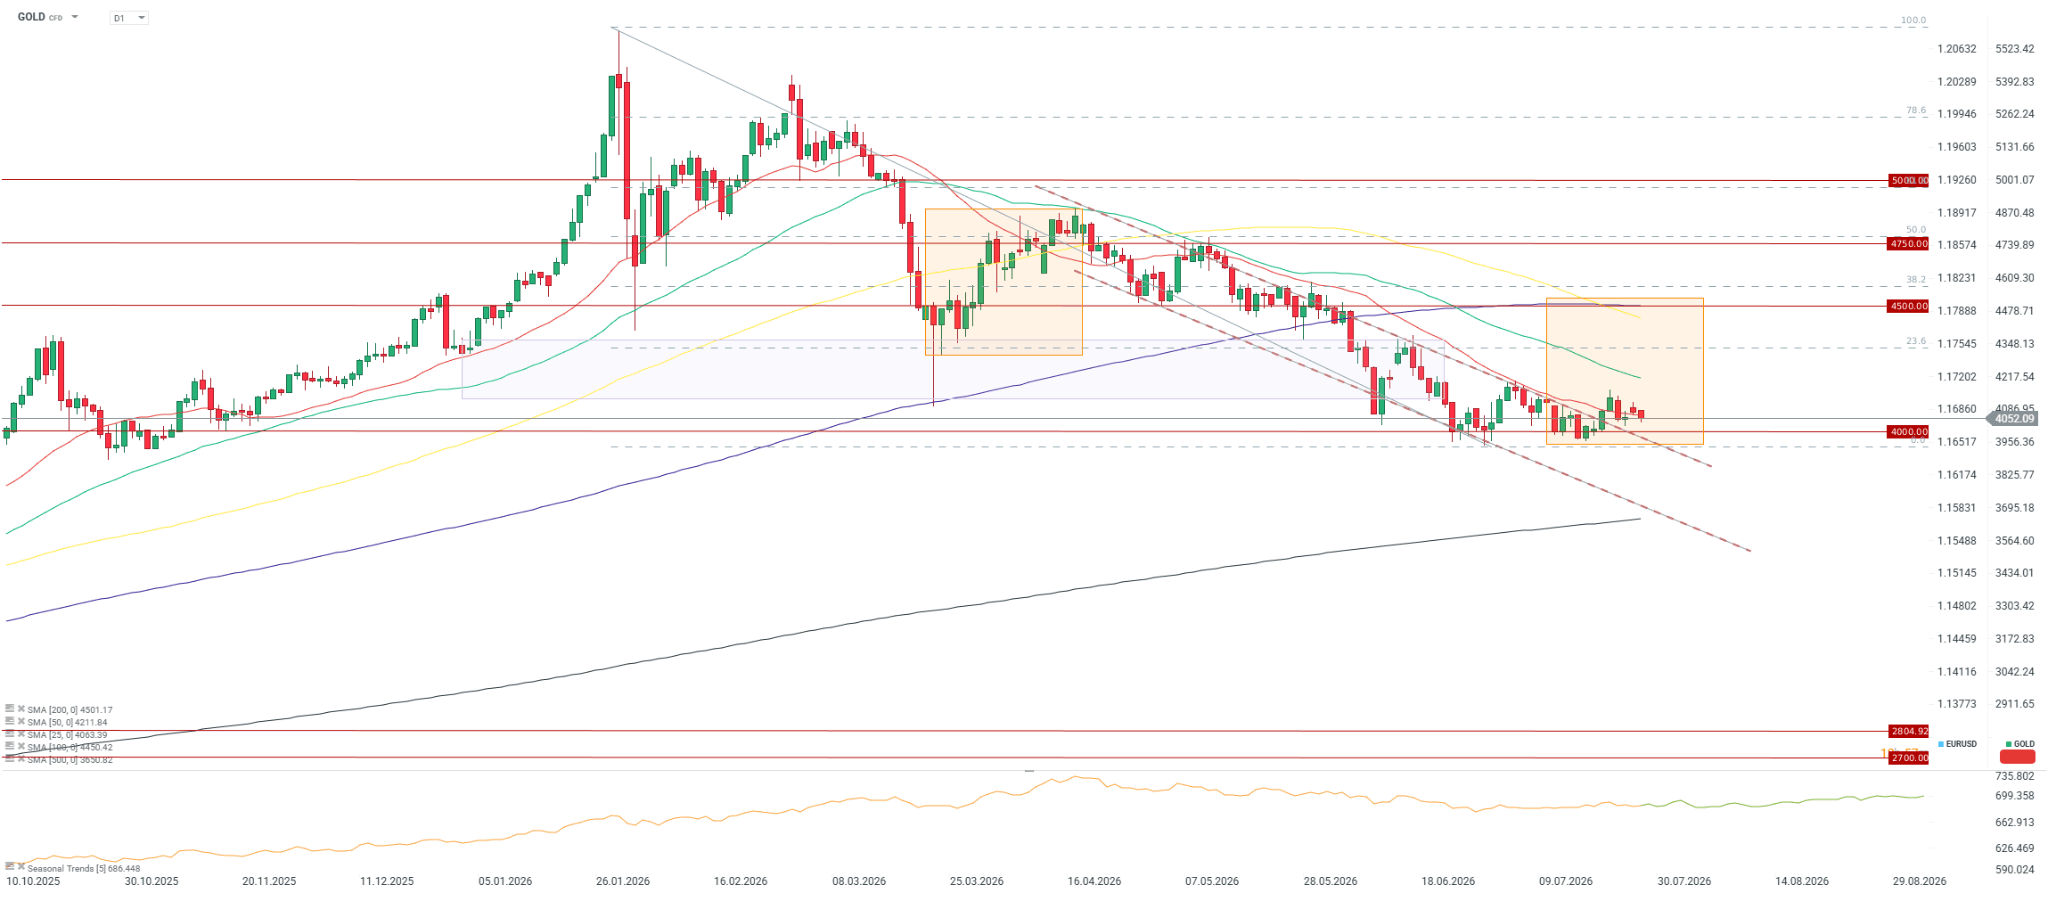
The price of gold is trying to stay above the 25-period average, following the recent attempt to break out of the descending trend channel. Source: xStation5
🍫 Cocoa
Cocoa futures prices have fallen significantly to levels below $5200 per tonne and below £4000 per tonne, representing a decline of 1/3 compared to the previous year.
Giants like Lindt, Barry Callebaut, and Nestlé have reported a drop in chocolate sales volume (e.g., Lindt down 7.5% in H1) due to high prices of finished products.
Sales in traditional markets continue to look weak, but a clear improvement is observed in Asia.
Corporations are focusing on innovation and social media trends (e.g., Dubai-style chocolate) to regain customers. However, it is worth noting that the amount of cocoa itself in finished products is simultaneously decreasing.
Favorable weather conditions in Côte d’Ivoire, Ghana, and Nigeria are supporting preparations for the main harvests beginning at the turn of August and September.
Cocoa deliveries to ports in Côte d’Ivoire since the start of the season reached 2.11 million tonnes compared to 1.75 million tonnes a year earlier.
The CCC regulator in Côte d’Ivoire has begun a campaign to deliver fertilizers and seedlings to farmers across an area of 1.5 million hectares.
Preliminary expectations for the 26/27 season indicate cocoa production in Côte d’Ivoire at 1.8 million tonnes, which would be a decrease of nearly 20% compared to the current production level.
Transgraph Consulting indicates that the cocoa market surplus in 26/27 will shrink to just 80 thousand tonnes from over 400 thousand tonnes in the current season, which is mainly related to falling production.
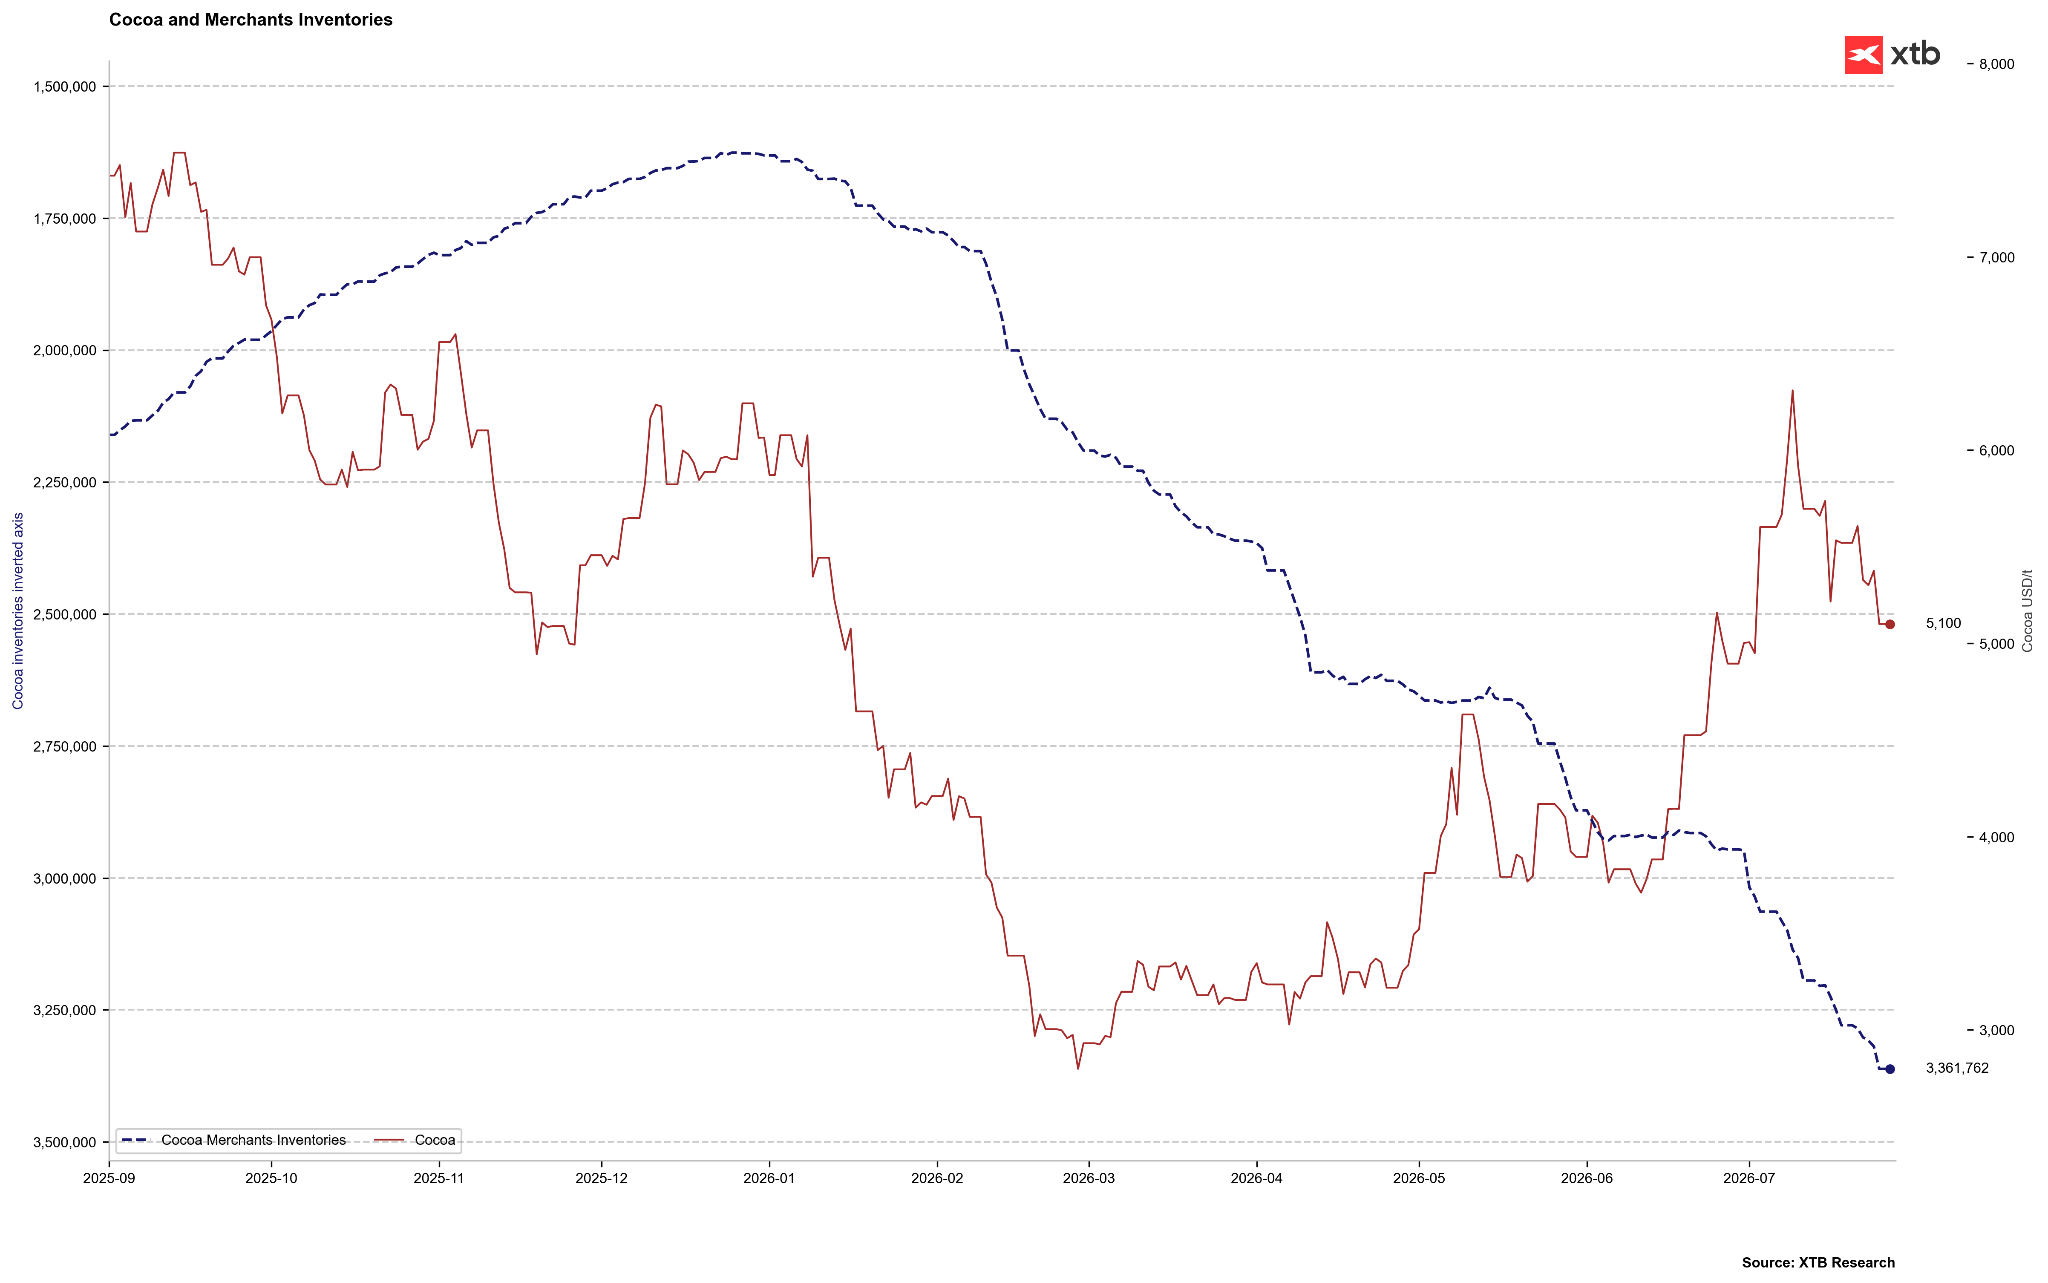
Cocoa Stocks on Exchanges
The real picture of the market is currently shown by the strong increase in cocoa stocks on exchanges, despite the fact that seasonally we should already be observing a slight decrease, as we are 2 months before the start of the next harvest season. Source: Bloomberg Finance LP, XTB Speculator Positions in the Cocoa Market
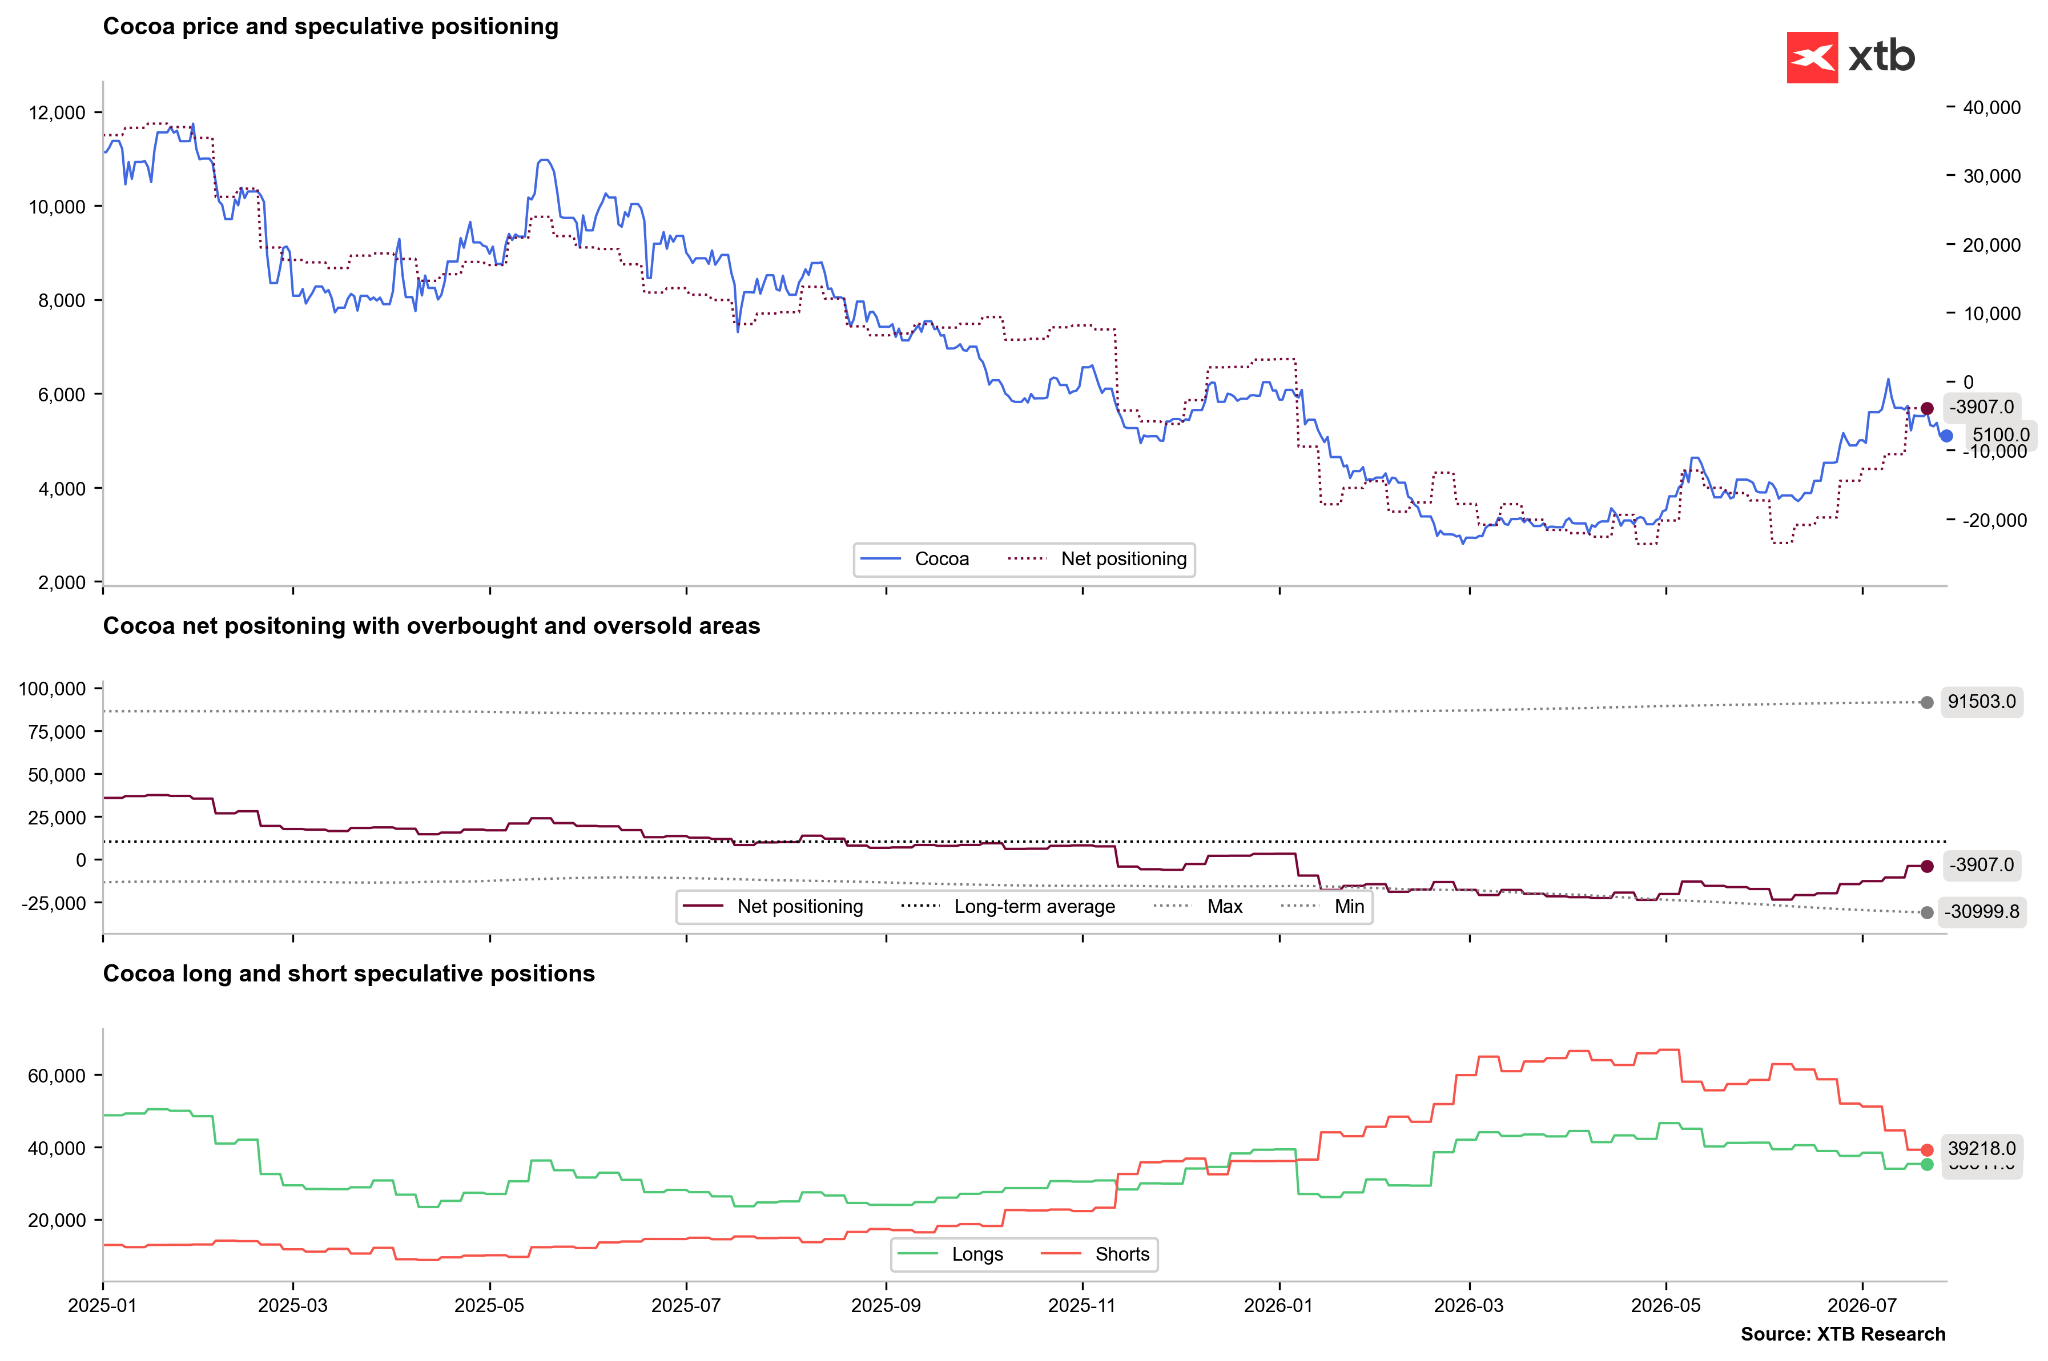
In recent weeks, speculators have reduced a lot of short positions. Source: Bloomberg Finance LP, XTB Cocoa Price Technical Analysis
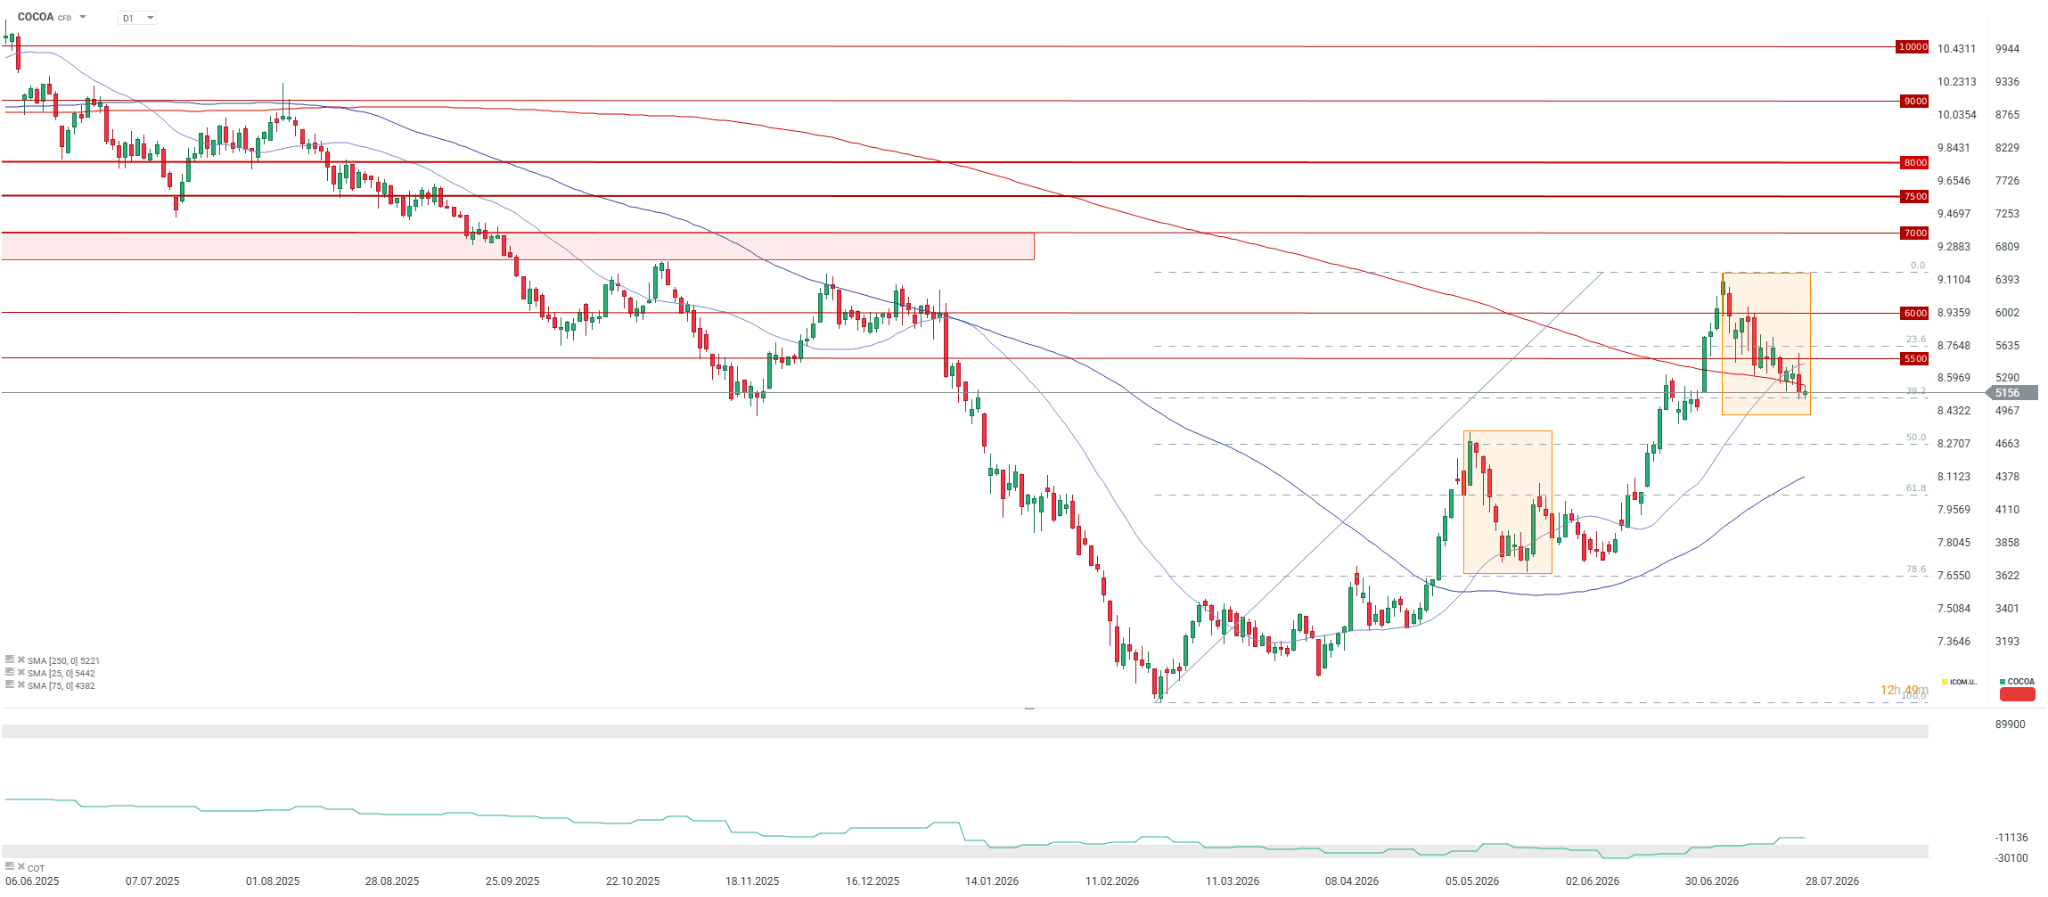
The price of cocoa has experienced a sharp drop to $5150 per tonne and is holding at the support related to the 38.2 retracement of the last upward wave and at the range of the largest correction in the current upward trend. However, the price is below the 25-period average and below the 250-period average. The key support is the area around 4700 at the 50.0 retracement. Source: xStation5
EUR/GBP holds gains around 0.8550, with bulls testing three-week highs.
The Euro is drawing support from lower Oil prices and expectations of further ECB tightening.
An uncertain BoE monetary policy and concerns about the UK’s public finances are weighing on the Pound.
The Euro (EUR) consolidated gains, just below three-week highs against the British Pound (GBP) on Tuesday, trading sideways at the mid-range of the 0.8550s at the time of writing. The risk-off mood is weighing on Euro rallies, but GBP bulls are also subdued amid concerns about the UK government’s fiscal policy and caution ahead of the Bank of England’s (BoE) monetary policy meeting, due later this week.
A pause in hostilities between the US and Iran and the ensuing decline in Oil prices is underpinning the common currency, which is also drawing some support from the hawkish stance of last week’s European Central Bank (ECB) monetary policy.
The ECB left interest rates on hold, following a 25-basis-point hike in June, but signalled a further rate hike in September, as high energy prices keep pushing inflationary pressures higher.
BoE seen tolerating 3% inflation as risks stay below second-round threshold
In the UK, the focus this week shifts to the BoE, which is widely expected to leave its benchmark Bank Rate unchanged at 3.75%. Investors will look at the number of hawkish dissenters within the committee, and Governor Bailey’s comments at the press conference to confirm market expectations that the bank will hike rates in the last quarter of the year.
Economists at ING are sceptical about that posibility, though, as the Bank of England’s updated projections are set to show inflation running “fairly close to 3% in the second half of this year and into early next,” a level they argue remains comfortably within the Bank’s tolerance. In this context, their base case is that “the Bank stays on hold through 2026,” with policy easing pushed well into the next cycle. ING says it “currently project[s] two rate cuts from the spring of 2027,” but emphasises that this path is “contingent on there being no material fiscal stimulus at the Autumn Budget.”
Beyond that, the Pound has been on the back foot with investors wary about the financing for the new Prime Minister Andy Burnham’s spending pledges. Burnham announced caps on transport fares and electricity bills, triggering market concerns about further strains on public finances, a very sensitive issue in the UK after Liz Truss’s fiasco in 2022.
EUR/USD slides to the monthly low near 1.1362 amid caution ahead of the Fed’s policy.
Investors await German and Eurozone preliminary HICP data for July.
ECB’s Kazimir stresses the need for at least one interest rate hike amid high inflationary pressures.
The Euro (EUR) falls to its monthly low at around 1.1362 against the US Dollar (USD) during the early European trading session on Tuesday. The major currency pair weakens as the US Dollar extends gains amid caution ahead of the Federal Reserve’s (Fed) monetary policy announcement on Wednesday.
At press time, the US Dollar Index (DXY), which gauges the Greenback’s value against six major currencies, trades marginally higher, closer to its monthly high of around 101.59.
US Dollar Price This week
The table below shows the percentage change of US Dollar (USD) against listed major currencies this week. US Dollar was the strongest against the New Zealand Dollar.
USD
EUR
GBP
JPY
CAD
AUD
NZD
CHF
USD
0.24%
0.34%
0.05%
0.22%
0.48%
0.66%
0.37%
EUR
-0.24%
0.08%
-0.19%
-0.02%
0.25%
0.42%
0.13%
GBP
-0.34%
-0.08%
-0.39%
-0.07%
0.17%
0.33%
0.04%
JPY
-0.05%
0.19%
0.39%
0.16%
0.43%
0.61%
0.23%
CAD
-0.22%
0.02%
0.07%
-0.16%
0.24%
0.44%
0.15%
AUD
-0.48%
-0.25%
-0.17%
-0.43%
-0.24%
0.17%
-0.12%
NZD
-0.66%
-0.42%
-0.33%
-0.61%
-0.44%
-0.17%
-0.29%
CHF
-0.37%
-0.13%
-0.04%
-0.23%
-0.15%
0.12%
0.29%
The heat map shows percentage changes of major currencies against each other. The base currency is picked from the left column, while the quote currency is picked from the top row. For example, if you pick the US Dollar from the left column and move along the horizontal line to the Japanese Yen, the percentage change displayed in the box will represent USD (base)/JPY (quote).
In the policy meeting, the Fed is highly expected to leave interest rates unchanged in the range of 3.50%-3.75%. The CME FedWatch tool shows a 62% chance that the Fed will maintain the status quo.
Investors will pay close attention to the Fed’s monetary policy statement and Chairman Kevin Warsh’s press conference to get fresh cues regarding inflation and the economic outlook. The Fed is unlikely to deliver any remarks regarding the monetary policy outlook, as Warsh said in its last policy press conference that “so-called forward guidance is not well-suited in the current policy juncture”.
The CME FedWatch tool shows that the odds of the Fed delivering an interest rate hike in the next policy meeting in September are 80.8%.
On the Eurozone front, investors await the German and Eurozone preliminary Harmonized Index of Consumer Prices (HICP) data for July, which will be released on Thursday and Friday, respectively.
Investors will closely track the inflation data as it is expected to significantly influence European Central Bank (ECB) interest rate expectations. On Monday, ECB Governing Council member and Governor of the National Bank of Slovakia (NBS), Peter Kazimir, said that at least one interest rate hike will be needed to contain elevated inflationary pressures.
US Dollar Index remained flat amid a rare level of uncertainty heading into a Fed decision.
Traders expect the Federal Reserve to hold interest rates steady this week, with possible hikes delayed to September.
Donald Trump warned military strikes against Iran could resume if diplomatic negotiations collapse.
The US Dollar Index (DXY), which measures the value of the US Dollar (USD) against six major currencies, is losing ground after three days of gains and trading around 101.50 during the Asian session on Tuesday.
The Greenback moves little amid market caution ahead of the Federal Reserve’s policy decision on Wednesday. According to the CME FedWatch Tool, markets are pricing in nearly a 38% chance of a rate hike in July, an unusually high level of uncertainty so close to a meeting. Citadel Securities expects the Fed to deliver a rate increase to solidify Chairman Kevin Warsh’s inflation-fighting credibility following his repeated promises to restore price stability. Looking further ahead, the probability of at least a 25-basis-point hike in September currently sits at approximately 81.4%.
President Donald Trump stated that the US is engaged in “good talks” with Iran to resolve the Middle East conflict. While Washington suspended its 13-night strike campaign over the weekend, leading to three consecutive days without attacks. Tehran’s foreign ministry countered that no direct negotiations with the US are taking place, noting its only active dialogue is with Oman regarding the future of the Strait. Even so, the diplomatic developments helped push oil prices down, easing broader inflation and monetary policy concerns.
Washington suspended its 13-night strike campaign over the weekend, leading to three consecutive days without attacks. Tehran’s foreign ministry countered that no direct negotiations with the US are taking place, noting its only active dialogue is with Oman regarding the future of the Strait.
USD/JPY flattens at around 163.75 in the countdown to the Fed’s monetary policy.
The Fed and the BoJ are expected to hold interest rates steady.
The BoJ will likely maintain hawkish monetary policy guidance.
The Japanese Yen (JPY) trades flat against the US Dollar (USD) at around 163.75 during the Asian trading session on Tuesday. The USD/JPY pair struggles for direction as investors have sidelined ahead of the Federal Reserve’s (Fed) monetary policy announcement on Wednesday.
At press time, the US Dollar Index (DXY), which gauges the Greenback’s value against six major currencies, trades marginally lower to near 101.46.
According to the CME FedWatch tool, traders see a 62% chance that the Fed will leave interest rates unchanged in the range of 3.50%-3.75%. The tool also shows a strong possibility of an interest rate hike in the September policy meeting.
Investors should not expect any guidance on the interest rate outlook in the monetary policy statement and Chairman Kevin Warsh’s press conference, as he clarified in the last meeting that “so-called forward guidance is not well-suited in the current policy juncture”.
Market participants would like to know for how long the United States (US) inflation will stay above the central bank’s 2% target.
On the Tokyo front, investors also await the Bank of Japan (BoJ) monetary policy announcement on Friday. The BoJ is expected to leave interest rates unchanged at 1% and deliver hawkish remarks on the monetary policy outlook.
To provide the best experiences, we use technologies like cookies to store and/or access device information. Consenting to these technologies will allow us to process data such as browsing behavior or unique IDs on this site. Not consenting or withdrawing consent, may adversely affect certain features and functions.
Functional
Always active
The technical storage or access is strictly necessary for the legitimate purpose of enabling the use of a specific service explicitly requested by the subscriber or user, or for the sole purpose of carrying out the transmission of a communication over an electronic communications network.
Preferences
The technical storage or access is necessary for the legitimate purpose of storing preferences that are not requested by the subscriber or user.
Statistics
The technical storage or access that is used exclusively for statistical purposes.The technical storage or access that is used exclusively for anonymous statistical purposes. Without a subpoena, voluntary compliance on the part of your Internet Service Provider, or additional records from a third party, information stored or retrieved for this purpose alone cannot usually be used to identify you.
Marketing
The technical storage or access is required to create user profiles to send advertising, or to track the user on a website or across several websites for similar marketing purposes.