Currency Hedger No Comments

Euro falls even amid strong Eurozone PMIs

  • EUR/USD trades lower near 1.1370 despite stronger-than-expected German and Eurozone PMI data.
  • US Services PMI jumped to 53.6, keeping the US Dollar supported, while Manufacturing PMI eased to 53.8.
  • Attention turns to next weekโ€™s Fed meeting with rates expected to remain at 3.50%โ€“3.75%.

EUR/USD trades lower near the 1.1370 area on Friday, struggling despite stronger-than-expected Eurozone business-activity figures. The US Dollar Index (DXY) remains firmer near 101.50, offering limited support to the pair.

Germanyโ€™s preliminary HCOB Composite Purchasing Managers Index (PMI) climbed to 51.2 in July from 49.5, exceeding expectations of 49.8 and returning to expansion territory. Manufacturing PMI improved to 52.2 from 50.3, while Services PMI rose to 49.6 from 48.6 but remained below the 50.0 threshold separating expansion from contraction.

Activity across the wider Eurozone also strengthened. The Composite PMI increased to 51.9 from 50.0, beating the 50.3 forecast. Manufacturing PMI advanced to 52.0, while Services PMI rose sharply to 51.6 from 49.4, indicating that the services sector returned to expansion.

The United States (US) preliminary S&P Global Manufacturing PMI eased to 53.8 and missed expectations of 54.5, while the Services PMI surged to 53.6 from 51.2, significantly exceeding the 51.0 forecast. The strong services reading may keep US Treasury yields supported and prevent a deeper decline in the Greenback.

Risk sentiment also improved after reports that Pakistan and Iran are exploring a potential path toward renewed US-Iran negotiations under a China-backed diplomatic initiative. A possible reduction in regional tensions has contributed to a sharp decline in Oil prices and reduced some safe-haven demand for the US Dollar, although significant obstacles to negotiations remain.

Investors will now turn their attention to the Federal Reserveโ€™s (Fed) July 28โ€“29 meeting. The Fed is expected to maintain its target range at 3.50%โ€“3.75%. The meeting will not include new economic projections or an updated dot plot, leaving the policy statement and Chair Kevin Warshโ€™s press conference as the main drivers for EUR/USD.

Chart Analysis EUR/USD

Short-term technical analysis:

On the 4-hour chart, EUR/USD trades at 1.1369 with a bearish near-term bias, holding beneath both the 20-period Simple Moving Average (SMA) at 1.1397 and the 100-period SMA at 1.1422. The pair is also trading under nearby horizontal caps at 1.1387 and 1.1391, reinforcing a topside ceiling, while the Relative Strength Index (RSI) hovers near 37, hinting at persistent downside pressure but not yet oversold conditions.

On the downside, immediate support is clustered just below the market at 1.1368 and 1.1366, where a break would open the door to an extension of the recent decline. On the topside, a recovery above the 1.1387โ€“1.1391 band is needed to ease immediate pressure, with the 20-period SMA at 1.1397 then acting as the next barrier ahead of the 100-period SMA at 1.1422, whose clearance would be required to challenge the broader bearish structure.

Currency Hedger No Comments

NZD/USD Price Forecast: Kiwi tests 0.5800 as bullish momentum fades

  • NZD/USD tests 0.5800 as 50-day SMA caps recovery.
  • RSI turns bullish but fading slope warns of downside risk.
  • Break below 0.5762 exposes 0.5743 and 0.5700 supports.

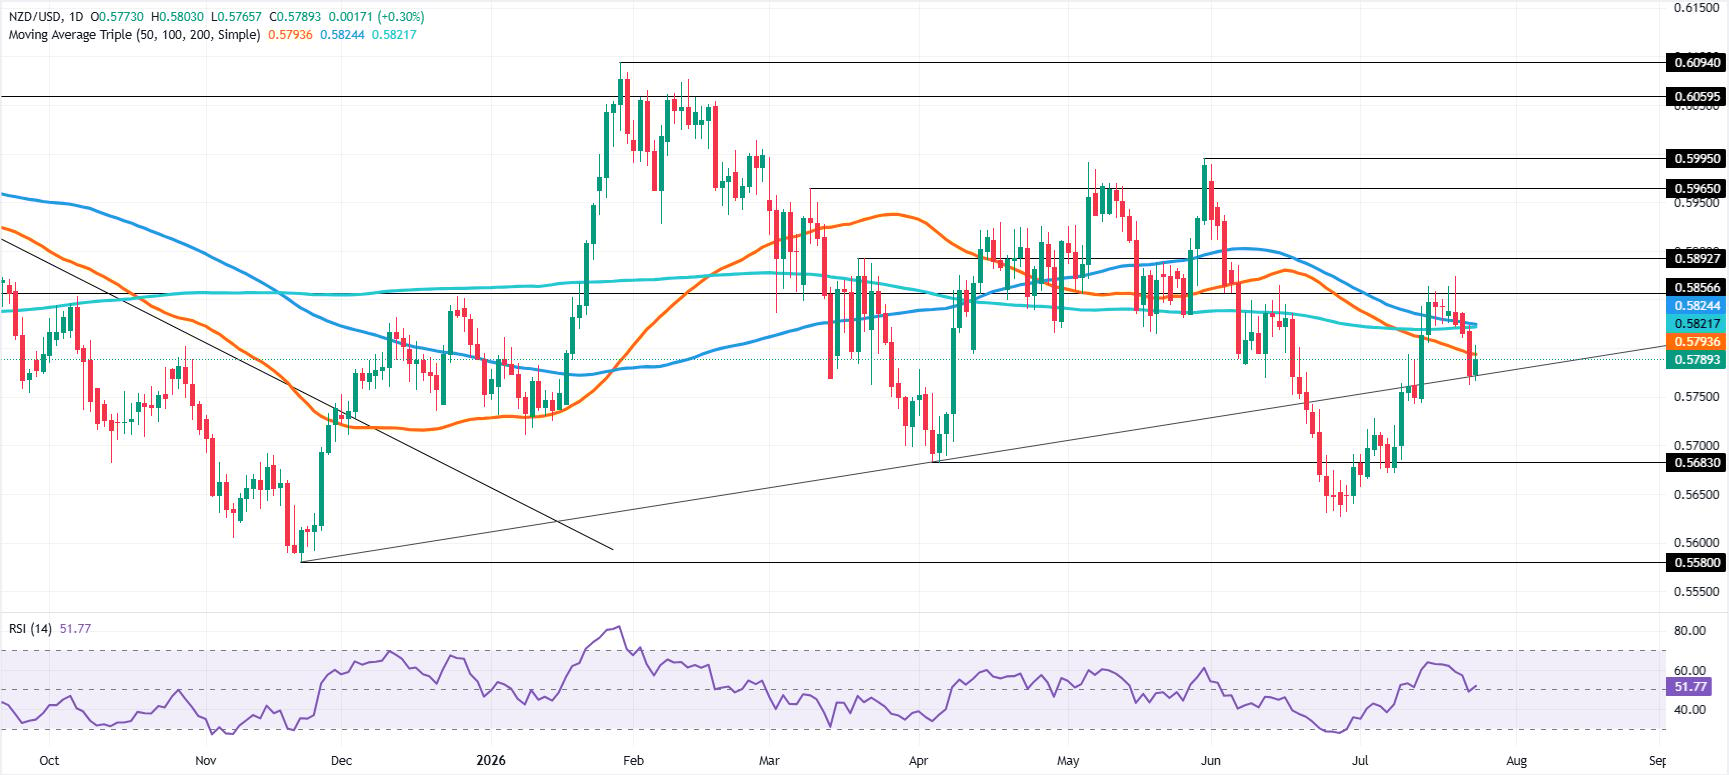
The New Zealand Dollar gains over 0.30% against the US Dollar on Friday. The pair is poised to test key resistance levels with the 50-day Simple Moving Average (SMA) at 0.5793, slightly below the 0.5800 figure. At the time of writing, the NZD/USD trades at 0.5789, after bouncing off daily lows of 0.5767.

NZD/USD Price Forecast: Technical outlook

The Kiwi Dollar seems to recover during the day, but the overall trend is downwards, until the pair reclaims the May 29 high of 0.5995. Momentum turned bullish as depicted in the Relative Strength Index (RSI), but seems to be fading as the index is about to pierce bearish territory.

As of writing, the NZD/USD is testing key resistance below 0.5800. A breach of the latter will expose the confluence of the 100- day and 200-day Simple Moving Averages (SMAs) at 0.5823, followed by the July 21 high at 0.5874. Above this area, the next resistance is the 0.5900, followed by the May 29 high beneath 0.6000.

On the other hand, if NZD/USD breaches the low of the week (LOW) of 0.5762, it opens the door for further downside. The next key support is the July 13 low of 0.5743, followed by 0.5700. Beneath lies the July 7 high at 0.5672.

NZD/USD daily price chart

NZD/USD daily chart
Currency Hedger No Comments

South Korean Won: Strong GDP and inflows support Won โ€“ Commerzbank

Commerzbank reports that South Koreaโ€™s advance Q2 GDP rose 0.6% quarter-on-quarter and 3.7% year-on-year, beating expectations. Robust AI-related semiconductor demand and resilient domestic spending underpin growth. The strong data support prospects of a further 25bp Bank of Korea hike in August. USD/KRW fell to 1,475, with the Won aided by portfolio inflows into bonds and equities.

Growth surprise bolsters BoK hike case

“The advance Q2 GDP rose 0.6% qoq sa (Bloomberg consensus: 0.4%) vs 1.8% in Q1. This suggests that growth momentum remained resilient despite energy supply disruptions.”

“On an annual basis, the economy expanded 3.7% yoy (Bloomberg consensus: 3.5%) vs 3.8% previously. The Ministry of Economy and Finance (MoEF) recently upgraded its 2026 growth forecast to 3.0% from 2.0%, reflecting the stronger outlook for exports and investment.”

“On monetary policy, the strong Q2 GDP reading supports the case of another 25bp hike to 3.0% by the Bank of Korea (BoK) at the 27 August meeting. At the previous meeting, Governor Shin Hyun-sung described August as a โ€œliveโ€ meeting, reinforcing the BoKโ€™s data-dependent approach.”

“With growth remaining resilient, inflation above target, and the AI-driven export boom broadening into wages and domestic demand, policymakers have scope to continue normalising policy.”

“In FX, USD-KRW fell 0.2% to 1,475 yesterday. The pair initially dropped 0.9% following the GDP release before paring some of its losses later in the session. Portfolio inflows provided support for KRW, with foreign investors purchasing USD1.0bn of domestic bonds and USD3.7bn of equities so far this week.”

Currency Hedger No Comments

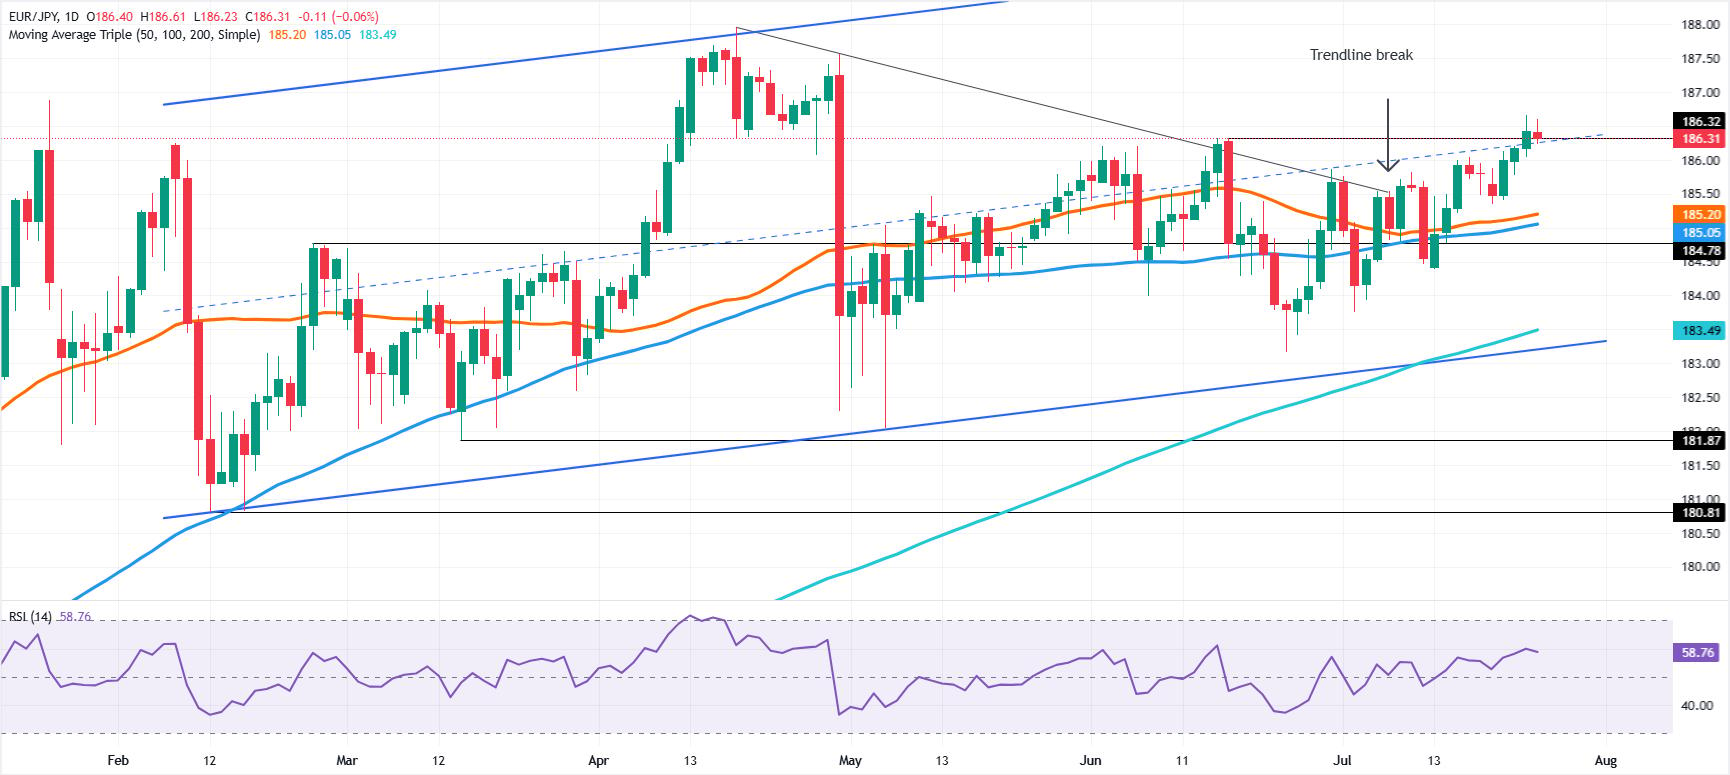
EUR/JPY Price Forecast: Cross consolidates under 187.00, bulls target 188.00

  • EUR/JPY remains capped within 186.00-187.00 as intervention fears linger.
  • RSI holds bullish territory, signaling buyers retain momentum advantage.
  • Break above 187.00 exposes YTD high and 190.00 resistance.

The EUR/JPY consolidates around 186.00, edges down by 0.06% amid a souring of risk appetite amid the escalation of the US-Iran war, and strengthens safe-haven assets like the Japanese Yen.

EUR/JPY Price Forecast: Technical outlook

The EUR/JPY trades sideways after reaching the year-to-date (YTD) high of 187.95. The cross-pair dipped toward the 183.00 area following the Bank of Japan’s (BoJ) last intervention, and since then buyers have reclaimed key resistance levels to reach the 186.00 mark.

At the time of writing, the EUR/JPY remains capped within the 186.00-187.00 range, amid fears that Japanese authorities could intervene in the foreign exchange markets. But bulls seem to be gaining momentum as indicated by the Relative Strength Index (RSI) in bullish territory.

Buyers need to clear 187.00 to challenge the YTD high at 187.95. Once those levels are taken out, the next resistance would be the 189.00 mark ahead of the 190.00 psychological level. 

On the other hand, if sellers push the EUR/JPY below the July 20 low of 185.35, it exacerbates a move toward the 50-day Simple Moving Average (SMA) at 185.20, followed by the 100-day SMA at 185.05. Still lower lies the 200-day SMA at 183.29.

EUR/JPY daily price chart

EUR/JPY daily chart
Currency Hedger No Comments

Mexican Peso Gains on Trade Advantage

The Mexican peso strengthened to around 17.48 per USD in late July from 17.52 earlier in the month as investors viewed Mexico’s trade position with the US as relatively favorable. The US announced new tariffs ranging from 10% to 12.5% on imports from roughly 60 economies. For Mexico, imports that do not qualify for preferential treatment under the USMCA will face a 10% tariff, while goods that comply with the agreement’s rules of origin will remain exempt, preserving the country’s preferential access to the US market. Existing exemptions also remain in place for products already covered by sector-specific tariffs, including automobiles, steel, aluminum, and pharmaceuticals. Mexico was included among the countries subject to the minimum 10% tariff, while many economies without trade agreements will face 12.5% duties, preserving Mexico’s competitive advantage over several export rivals. The peso also found support from a pullback in global energy prices.

Currency Hedger No Comments

Japanese Yen remains pinned near 40-year low as Fed-BoJ rate gap keeps carry trade active

  • USD/JPY consolidates the previous dayโ€™s strong gains amid looming intervention risks.
  • The wide US-Japan rate differential holds back the JPY bulls from placing aggressive bets.
  • US-Iran tensions and Fed rate hike expectations favor USD bulls, supporting spot prices.

The USD/JPY pair edges lower on Friday as bulls turn cautious in anticipation of a potential government intervention to prop up the Japanese Yen (JPY). Nevertheless, spot prices remain within striking distance of the four-decade high, touched on Thursday, and the 164.00 mark amid a supportive fundamental backdrop.

A stark contrast in monetary policy between Japan and the rest of the world keeps the so-called carry trade active, which might continue to undermine the JPY. Despite the recent Bank of Japan (BoJ) rate hike to 1%, or the highest since 1995, borrowing costs in Japan remain exceptionally low relative to other major economies, including the US. Furthermore, economic risks stemming from energy supply disruptions due to the Middle East conflict contributed to the JPY’s relative underperformance.

The US military announced that it has completed another round of strikes against Iran on Thursday, marking the 13th straight night of operations. Meanwhile, Iran and its allies launched retaliatory strikes against US-linked military assets in Kuwait, Bahrain and Jordan. Adding to this, Iran-aligned Houthis extended the Middle East war to a second major shipping chokepoint and struck two Saudi oil tankers in the Red Sea, describing the action as part of a naval blockade against Saudi Arabia.

This comes on top of the closure of the Strait of Hormuz and further exacerbates supply disruption concerns, lifting crude oil prices to a fresh high since June 11 on Thursday. Investors remain worried that elevated energy prices will rekindle inflationary pressure and force major central banks, including the USย Federal Reserveย (Fed), to adopt a more hawkish stance. Moreover, data showed on Thursday that USย Jobless Claimsย fell to the lowest level since September 1969, pointing to a resilient labor market.

This reaffirmed market expectations that the US central bank will raise borrowing costs by the end of this year, which favors the US Dollar (USD) bulls and backs the case for the emergence of dip-buying around the USD/JPY pair. Traders, however, seem hesitant and opt to move to the sidelines ahead of the highly anticipated FOMC policy meeting next week. Nevertheless, spot prices remain on track to register strong weekly gains for the third straight week and seem poised to climb further.

Japanese Yen Price This week

The table below shows the percentage change of Japanese Yen (JPY) against listed major currencies this week. Japanese Yen was the strongest against the Swiss Franc.

USDEURGBPJPYCADAUDNZDCHF
USD0.39%0.99%0.87%0.45%-0.33%0.83%0.99%
EUR-0.39%0.61%0.43%0.06%-0.71%0.44%0.59%
GBP-0.99%-0.61%-0.17%-0.54%-1.30%-0.16%0.03%
JPY-0.87%-0.43%0.17%-0.32%-1.14%-0.09%0.22%
CAD-0.45%-0.06%0.54%0.32%-0.74%0.24%0.58%
AUD0.33%0.71%1.30%1.14%0.74%1.16%1.35%
NZD-0.83%-0.44%0.16%0.09%-0.24%-1.16%0.20%
CHF-0.99%-0.59%-0.03%-0.22%-0.58%-1.35%-0.20%

The heat map shows percentage changes of major currencies against each other. The base currency is picked from the left column, while the quote currency is picked from the top row. For example, if you pick the Japanese Yen from the left column and move along the horizontal line to the US Dollar, the percentage change displayed in the box will represent JPY (base)/USD (quote).

Currency Hedger No Comments

Rupee Near Record Low on Oil, US Tariffs

The Indian rupee weakened to around 96.58 per dollar, hovering near record lows as a sharp surge in crude oil prices and fresh US tariff measures weighed on sentiment. Brent crude jumped more than 7% to above $100 per barrel after Yemen’s Houthis attacked two Saudi oil tankers in the Red Sea, exacerbating supply concerns as trade through the Strait of Hormuz remained severely disrupted. Sentiment was further dampened after the US imposed new tariffs of 10% to 12.5% on imports from around 60 economies under a forced-labor investigation, including a 10% duty on Indian goods, fueling concerns over global trade, India’s export outlook, and broader emerging-market assets. Investor focus also remained on the Reserve Bank of India, with traders watching for further intervention after state-run banks were reportedly seen selling dollars on the central bank’s behalf to curb volatility and prevent the rupee from breaching record lows.

Currency Hedger No Comments

Philippine Peso Nears Fresh Record Low

The Philippine peso weakened to around 61.84 per US dollar in late July, moving closer to a fresh record low as surging oil prices and broad US dollar strength weighed on the currency. Crude prices have jumped more than 30% this month as the escalating US-Iran conflict spilled over into key other shipping routes, heightening concerns over deeper disruptions to global energy supplies. This has intensified pressure on oil-importing economies, including the Philippines, raising concerns over imported inflation and the country’s trade balance. The Bangko Sentral ng Pilipinas intervened in the foreign exchange market this week to support the peso, while the Marcos administration expressed confidence that the central bank would act decisively if needed. Fitch Group’s BMI Research forecasts the peso to trade within the 61โ€“63 per US dollar range this year, making it one of Asia’s weakest-performing currencies. The peso has fallen nearly 5% against the US dollar so far this year.