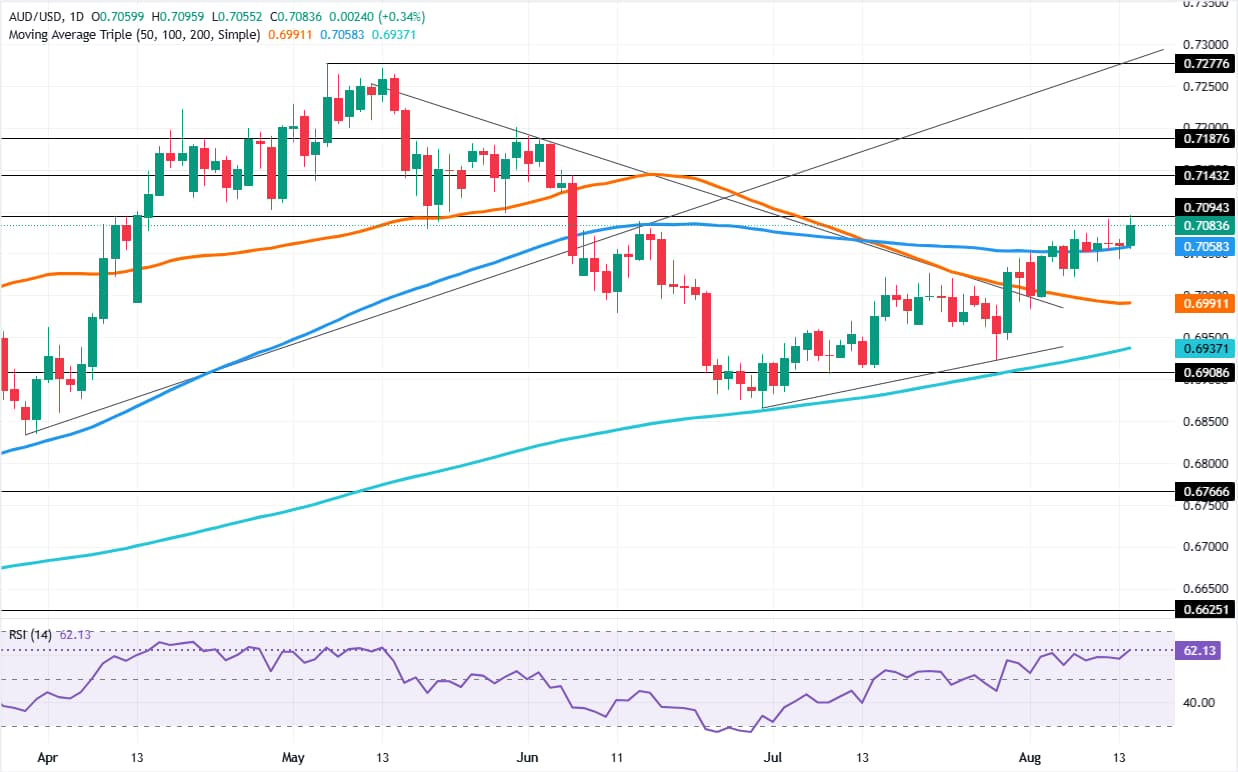
- AUD/USD gains as weak Retail Sales pressure the Greenback.
- Bullish RSI supports upside, but 0.7094 caps momentum.
- Break above 0.7100 exposes 0.7190 and 0.7200 next.
The Australian Dollar advanced on Friday after US Retail Sales disappointed investors, increasing speculation that the Federal Reserve might not raise rates, as the economy showed tentative signs of weakness. The AUD/USD trades at 0.7083, up 0.34%
AUD/USD Price Forecast: Technical outlook
The daily chart shows the AUD/USD is bullish, but buyers remain unable to decisively crack the January 29 high of 0.7094, which could open the door for further upside. Momentum shifted bullish since mid-July, as depicted in the Relative Strength Index (RSI).
From a market structure perspective, the pair has not shifted bullish until buyers regain the June 1 peak at 0.7190. Hence, the first AUD/USD resistance is 0.7100, followed by the latter. On further strength, the next stop is 0.7200.
On the downside, the 100-day Simple Moving Average (SMA) at 0.7058 is the first support. Once cleared, the 50-day SMA emerges as the next demand zone at 0.6991, followed by the 200-day SMA at 0.6937.
AUD/USD Price Chart – Daily