NZD/USD softens to near 0.5700 in Tuesday’s Asian session.
Trump insisted on Hormuz opening as he escalated Iran threats.
The RBNZ rate decision will be in the spotlight later on Wednesday, with no change in rate expected.
The NZD/USD pair attracts some sellers to around 0.5700 during the Asian trading hours on Tuesday. The US Dollar (USD) strengthens against the New Zealand Dollar (NZD) as heightened uncertainty in the Middle East boosts demand for a safe-haven currency.
US President Donald Trump said on Monday that freedom of navigation through the Strait of Hormuz would be part of any deal to end the Middle East war and escalated threats to attack key Iranian infrastructures if his terms aren’t met before a Tuesday deadline at 8 p.m. Eastern Time (00:00 GMT Wednesday), per Bloomberg.
Iran has also retaliated by saying that it will respond to Trump’s threats by ramping up its own attacks on energy infrastructure in the Gulf. Rising tensions in the Middle East could provide some support to the Greenback and act as a headwind for the pair in the near term.
However, the downbeat US economic data might cap the upside for the USD. The US Services Purchasing Managers Index (PMI) declined to 54.0 in March from 56.1 in February, the Institute for Supply Management (ISM) showed on Monday. This reading came in below the market consensus of 55.0.
The Reserve Bank of New Zealand (RBNZ) is expected to keep interest rates unchanged at its April meeting on Wednesday and restate its willingness to look through the initial inflationary impact of surging fuel prices that threaten a stuttering recovery. Governor Anna Breman will hold a press conference after the policy meeting. Markets and analysts anticipate a potential rate hike to 2.50% by the end of 2026.
NZD/USD rebounds after retesting a four-month trough during the Asian session on Monday.
Reports of a push for a US-Iran ceasefire weigh on the USD and lend some support to spot prices.
Geopolitical risks remain in play, warranting caution before positioning for any further recovery.
The NZD/USD pair attracts some buyers near the 0.5680 region, or over a four-month trough retested during the Asian session on Monday, and for now, seems to have snapped a two-day losing streak. Spot prices currently trade just above the 0.5700 mark, up nearly 0.25% for the day, though the upside potential seems limited.
Bloomberg, citing Axios, reported that the US, Iran, and regional mediators are discussing terms for a possible 45-day ceasefire that could lead to an end of fighting. The headlines offer a temporary respite to the fragile global risk sentiment and undermine the US Dollar’s (USD) global reserve currency status, which turns out to be a key factor lending some support to the NZD/USD pair. Investors, however, remain on edge amid persistent geopolitical uncertainties.
US President Donald Trump threatened to destroy Iran’s civilian infrastructure, including power plants and bridges, if Tehran does not meet his deadline to reopen the Strait of Hormuz by Tuesday. Iran, on the other hand, outlined a new condition and said that the transit through the strategic waterway could resume if part of the revenue is allocated to compensate Iran for war-related damages. Moreover, chances of a deal over the next 48 hours remain low.
Meanwhile, investors remain worried that the war-driven surge in energy prices would rekindle inflationary pressures and force major central banks, including the US Federal Reserve (Fed), to adopt a more hawkish stance. In fact, traders are now pricing in a greater probability that the Fed will raise borrowing costs in 2026, which could act as a tailwind for the USD. This might cap the upside for the NZD/USD pair and warrants some caution for bullish traders.
Traders now look forward to the release of the US ISM Services PMI for some impetus later during the North American session amid thin liquidity on the back of the Easter Monday Holiday in many global financial markets. Nevertheless, the fundamental backdrop makes it prudent to wait for some follow-through buying before confirming that the NZD/USD pair has formed a near-term bottom and positioning for any further appreciating move.
NZD/USD drifts lower to near 0.5710 in Friday’s Asian session.
China’s RatingDog Services PMI eased to 52.1 in March, weaker than expected.
The US March jobs data will be the highlight on Friday.
The NZD/USD pair extends the decline to a near four-month low around 0.5710 during the Asian trading hours on Friday. The New Zealand Dollar (NZD) softens against the US Dollar (USD) on the downbeat Chinese economic data and heightened geopolitical tensions in the Middle East. Trading volumes are likely to be thin due to the Good Friday holiday.
Data released by RatingDog on Friday showed that China’s Services Purchasing Managers’ Index (PMI) declined to 52.1 in March from 56.7 in February. This figure came in below the market consensus of 53.7. The China-proxy Kiwi edges lower following the weaker Chinese data.
Additionally, escalating tensions between the US and Iran could boost a safe-haven currency such as the Greenback and create a headwind for the pair. US President Donald Trump pressures Iran “to make a deal” after a military strike destroys a bridge near Tehran. Meanwhile, Iran’s foreign minister Abbas Araghchi stated that Washington’s recent strikes on civilian infrastructure will not force the country to back down.
Traders will closely monitor the US March jobs data later on Friday. The US economy is expected to see 60,000 job additions in March, while the Unemployment Rate is estimated to hold steady at 4.4% during the same period. Any signs of a weakening in the US labor market could drag the USD lower in the near term.
The Overbalance analysis aims to identify three financial instruments, analyzed primarily on the daily/four-hour (D1/H4) timeframe. The analysis uses only the Overbalance methodology, which helps determine where a trend may continue or where it may reverse. Today’s analysis covers three instruments, evaluated solely in terms of 1:1 correction structures.
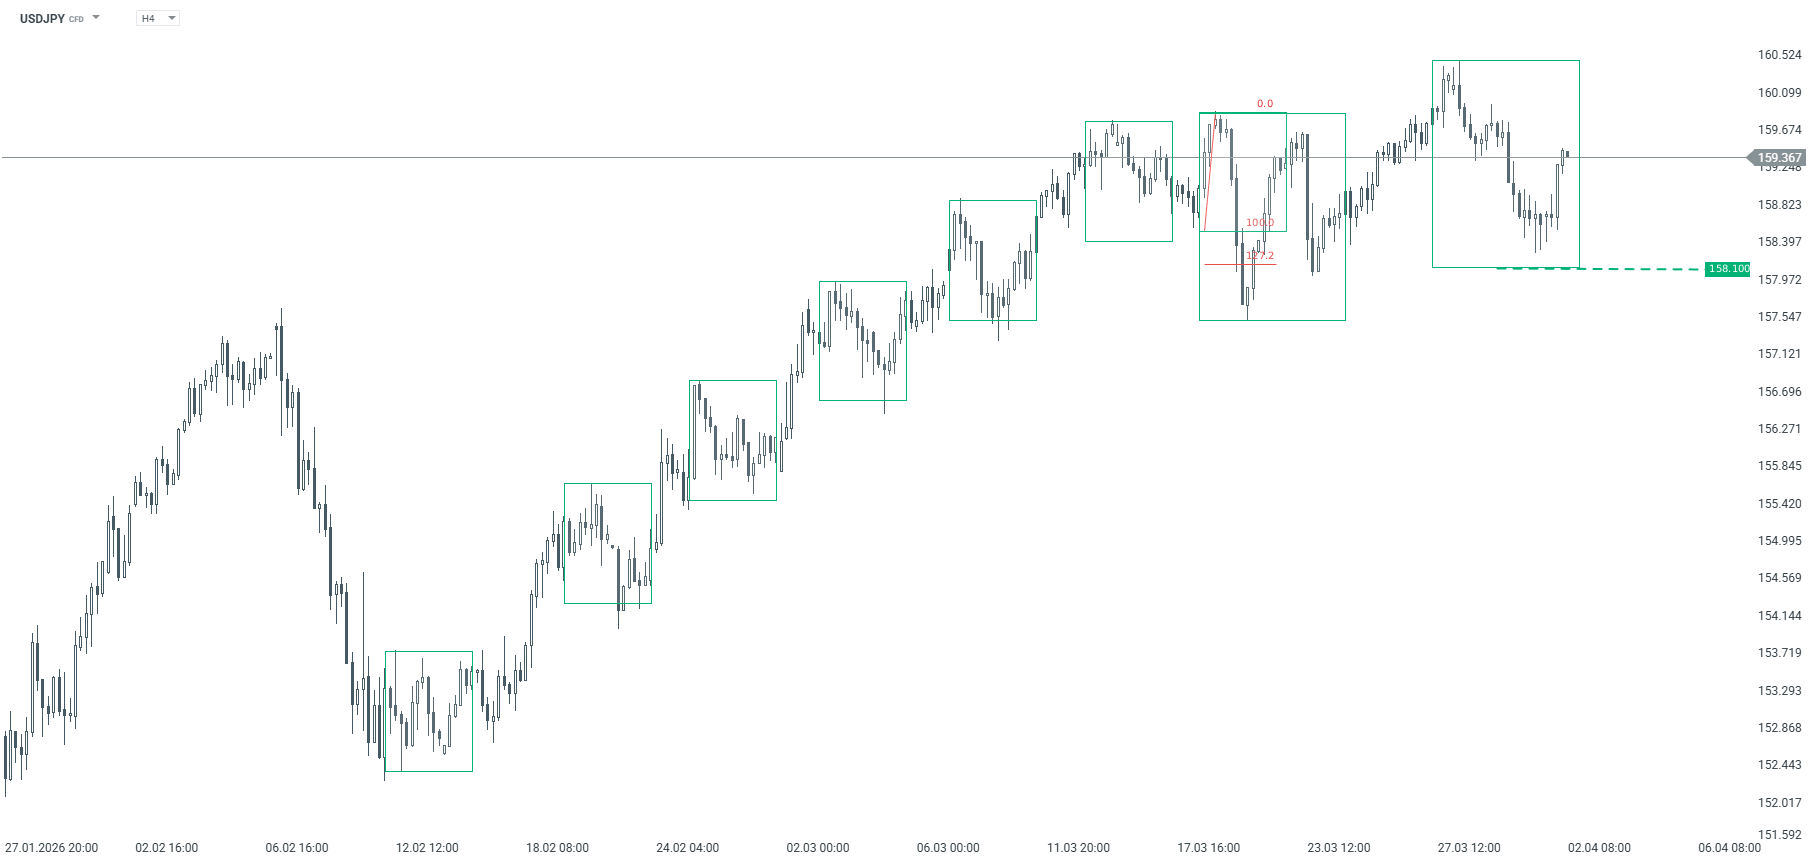
USDJPY Since February 12, the USDJPY has been trading in a strong uptrend. Initially, the movement was controlled by a 1:1 corrective pattern with a range of approximately 140 pips; however, in mid-March, a deeper correction occurred, after which the market established a new high. As a result, the current largest corrective pattern has a range of approximately 240 pips. At this point, the key support level is 158.10, derived from the lower boundary of this pattern. As long as this level holds, the uptrend remains in place. A break below it, however, could open the way for a larger correction or even a trend reversal.
USDJPY – H4 chart. Source: xStation
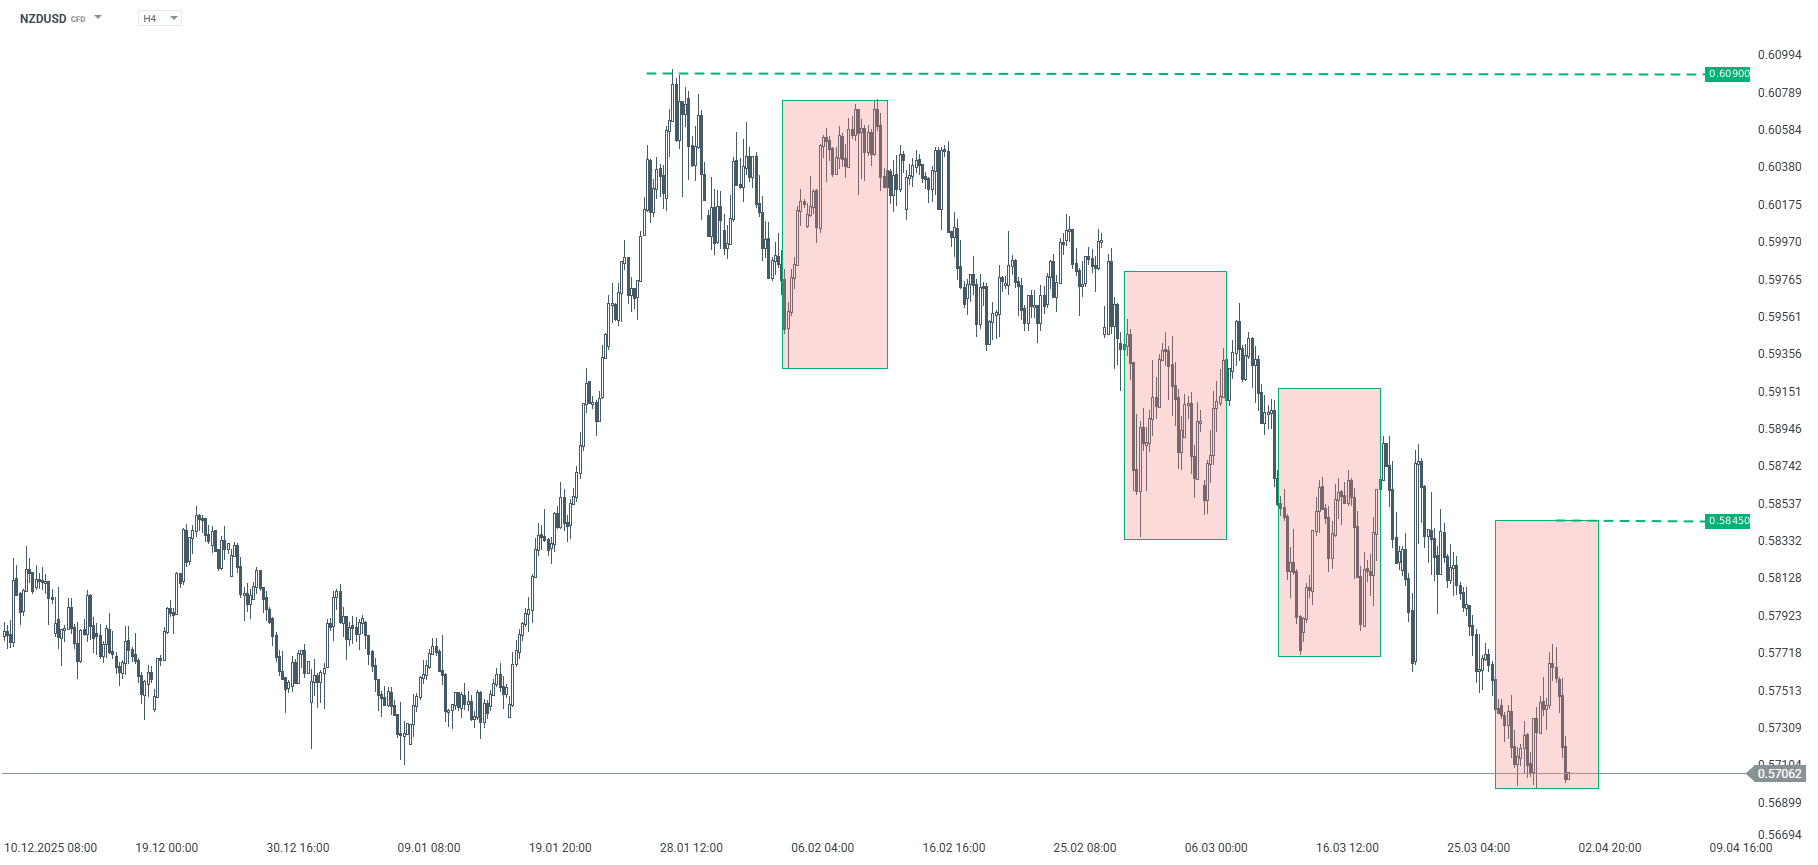
NZDUSD The NZDUSD pair has been trending downward since late January. We are currently seeing an upward corrective move. If the correction continues, the key resistance level remains at 0.5845, where the upper boundary of the 1:1 correction pattern is located. According to the Overbalance methodology, the downtrend remains in effect until this level is negated.
NZDUSD – H4 chart. Source: xStation
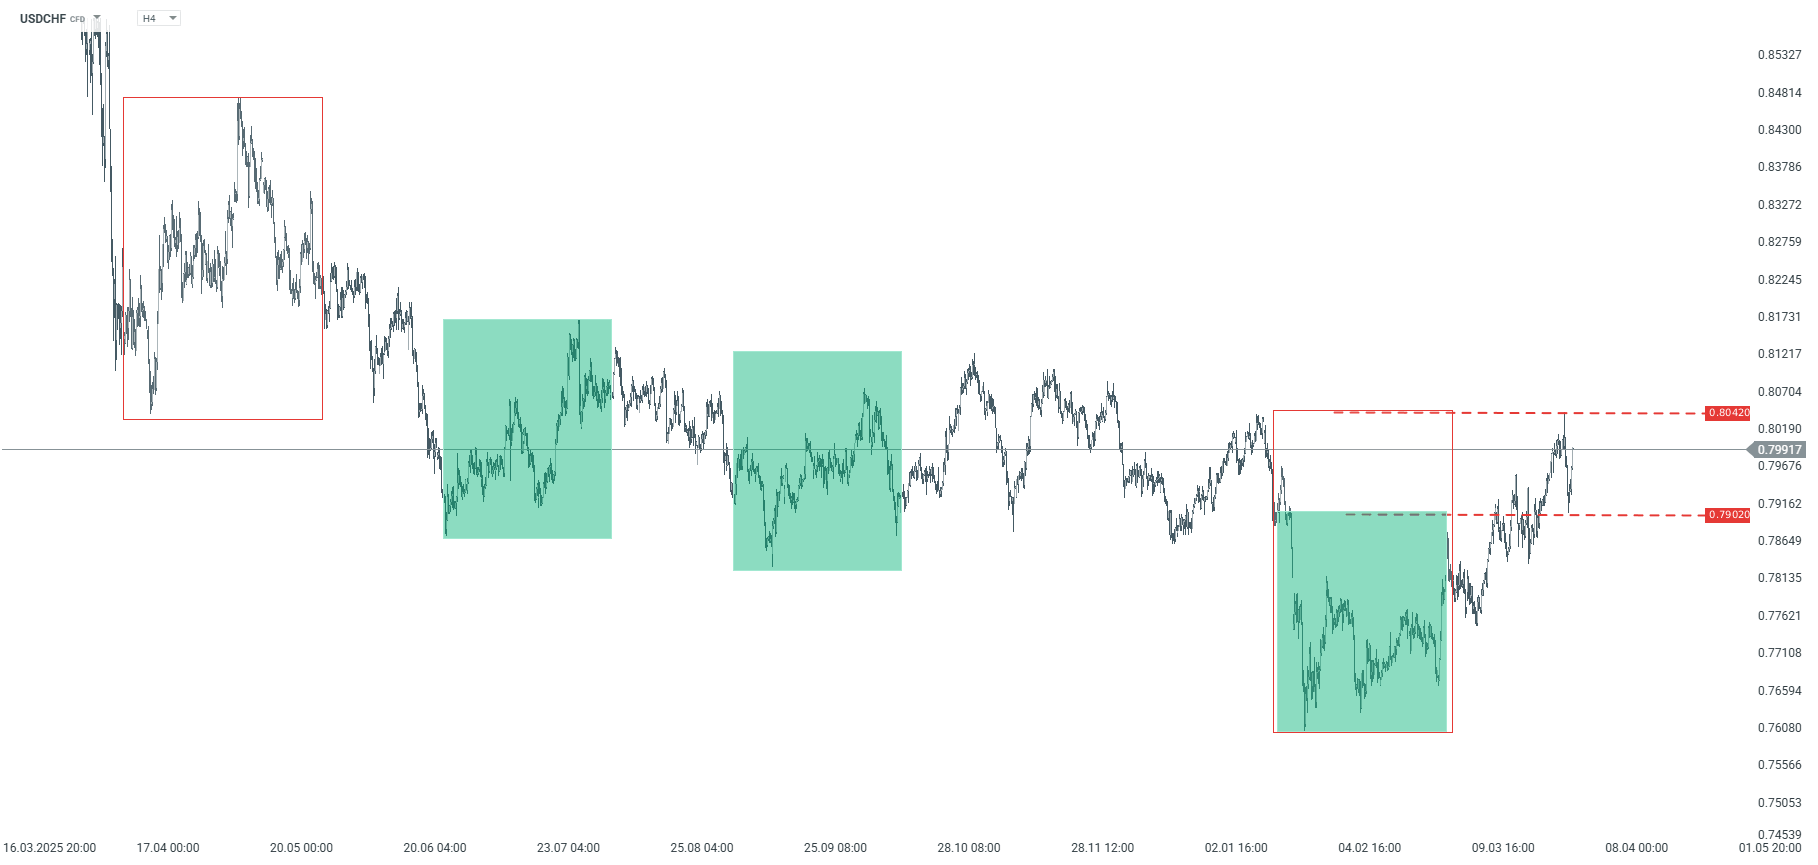
USDCHF Since early January, USDCHF has been in a downtrend. However, an upward correction has been developing since late January, and its range has already exceeded smaller geometric patterns, including the 0.7902 level. Nevertheless, the price has failed to break through the key resistance at 0.8042, where the upper boundary of the largest corrective pattern is located. According to the Overbalance methodology, the downtrend remains in effect until this level is broken. The decline could accelerate after falling below the 0.7902 level, which is the lower boundary of the smaller geometric pattern. Conversely, a break above 0.8042 could lead to a shift to an uptrend.
USDCHF – H4 timeframe. Source: xStation
The material on this page does not constitute financial advice and does not take into account your level of understanding, investment objectives, financial situation or any other specific needs. All information provided, including opinions, market research, mathematical results and technical analyzes published on the Website or transmitted To you by other means, it is provided for information purposes only and should in no way be construed as an offer or solicitation for a transaction in any financial instrument, nor should the information provided be construed as advice of a legal or financial nature on which any investment decisions you make should be based exclusively To your level of understanding, investment objectives, financial situation, or other specific needs, any decision to act on the information published on the Website or sent to you by other means is entirely at your own risk if you In doubt or unsure about your understanding of a particular product, instrument, service or transaction, you should seek professional or legal advice before trading. Investing in CFDs carries a high level of risk, as they are leveraged products and have small movements Often the market can result in much larger movements in the value of your investment, and this can work against you or in your favor. Please ensure you fully understand the risks involved, taking into account investments objectives and level of experience, before trading and, if necessary, seek independent advice.
NZD/USD slumps to around 0.5725 in Thursday’s Asian session.
Trump said the conflict in Iran would soon be ending, but US military would continue to hit targets there over the next few weeks.
US March employment data will be the highlight on Friday.
The NZD/USD pair tumbles to near 0.5725 during the Asian trading hours on Thursday. The US Dollar (USD) edges higher against the New Zealand Dollar (NZD) as market caution persists due to the ongoing conflict in the Middle East, which boosts safe-haven demand.
US President Donald Trump said on Thursday that he expects the war with Iran to last another two to three weeks, but deemed it close to an end. Trump further stated that Iran’s ability to launch missiles and drones has been curtailed. A White House official stated that the US President will focus on the operation having met or exceeded all of its benchmarks, including destroying Iran’s ballistic missiles and production facilities.
“Trump’s comments failed to reassure markets … markets are starting to realize that the war will probably escalate further from here before de-escalating,” said Carol Kong, a currency strategist at Commonwealth Bank of Australia.
The attention will shift to the US employment report for March, which will be published later on Friday. The US economy is expected to show 60,000 job additions in March, while the Unemployment Rate is projected to hold steady at 4.4% during the same period. Any signs of weakening in the US labour market could drag the Greenback lower and act as a tailwind for the pair.
The Reserve Bank of New Zealand (RBNZ) will announce its interest rate decision next week. RBNZ Governor Anna Breman indicated the bank might “look through” temporary energy-driven inflation but could hike if long-term expectations are threatened.
NZD/USD turns lower after touching a fresh weekly high during the Asian session on Wednesday.
Inflation fears and Fed rate hike bets remain in play, limiting USD losses and capping spot prices.
Delayed RBNZ rate hike bets due to prolonged energy supply shock further weigh on the NZD.
The NZD/USD pair attracts some sellers following a modest Asian session rise to the 0.5760 area, or the weekly top, and stalls the previous day’s recovery move from over a four-month low. Spot prices slide to the 0.730 region in the last hour and seem vulnerable to prolonging the downtrend witnessed over the past two months or so.
The optimism led by US President Donald Trump’s signal that the US would wind down current hostilities with Iran within two to three weeks remains limited amid reports that the UAE is pushing for military action to reopen the Strait of Hormuz. Adding to this, the US is still deploying additional troops and assets in the Middle East, raising the risk of a broader regional conflict. This keeps inflation concerns and Federal Reserve (Fed) rate hike bets in play, which acts as a tailwind for the US Dollar (USD) and exerts some pressure on the NZD/USD pair.
Meanwhile, the New Zealand Dollar (NZD) is undermined by expectations that the Reserve Bank of New Zealand (RBNZ) could wait until Q4 before raising interest rates amid concerns that a prolonged energy supply shock would dent economic growth. Apart from this, the latest data published by RatingDog showed China’s Manufacturing PMI dropped to 50.8 in March from 52.1. This counters Tuesday’s upbeat official PMIs and points to a fragile recovery in the world’s second-largest economy, which further weighs on antipodean currencies, including the Kiwi.
The aforementioned fundamental backdrop validates the near-term negative outlook for the NZD/USD pair, though traders might opt to wait for geopolitical developments before placing aggressive directional bets. In the meantime, Wednesday’s US economic docket – featuring the release of the ADP report on private-sector employment, the monthly Retail Sales, and the ISM Manufacturing PMI – will be looked upon for some impetus. The market attention will then shift to the release of the closely-watched US Nonfarm Payrolls (NFP) report on Friday.
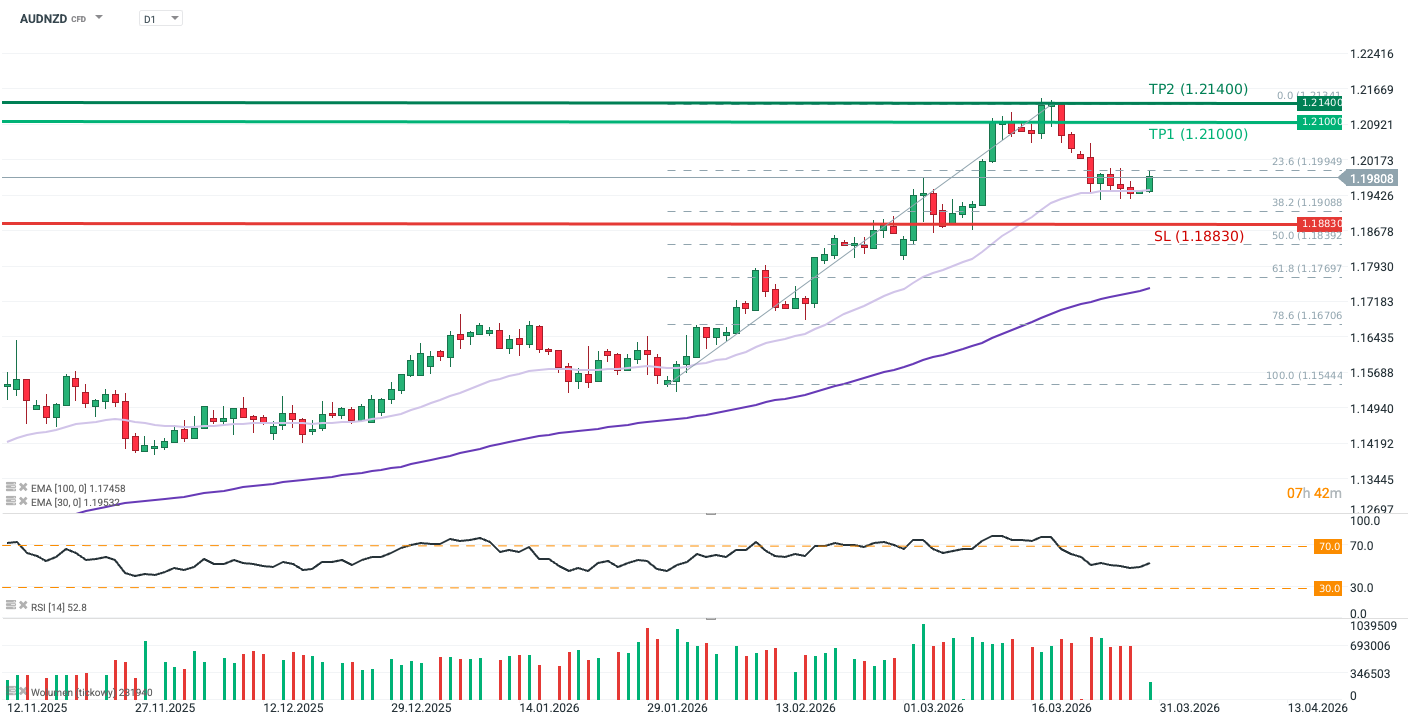
AUDNZD rebounded from the 30-day exponential moving average (EMA30; light purple) during today’s session.
The swap market (OIS curve) currently prices an approximately 60% probability of an interest rate hike in Australia for May, compared to approximately 8% in New Zealand.
The RSI stands at approximately 52, remaining well below the overbought threshold (i.e., below 70).
AUDNZD recently underwent a correction triggered by a global decline in risk appetite and concerns regarding an economic slowdown in China. As China is highly dependent on Iranian oil, its trade ties with the Australian mining industry significantly influence the Australian dollar’s valuation. However, the downward move stalled at the EMA30; after several days of sideways trading, the pair rebounded, signaling a likely continuation of the broader uptrend.
While global inflation concerns driven by energy prices remain prevalent, the Reserve Bank of Australia (RBA) continues to position itself as the most hawkish central bank among G10 nations, with rates currently at 4.10%. This creates a favorable carry trade opportunity against the significantly more dovish Reserve Bank of New Zealand (RBNZ), where rates stand at 2.25%.
The 10-year bond yield spread between the two economies has remained stable since early March (at approximately 30 bps). Therefore, in the short term, Australia’s active hiking cycle should continue to support the AUDNZD trend. A primary risk factor would be a decisive pivot from the RBNZ; according to the OIS curve, markets expect the RBNZ to resume hikes in the autumn, potentially ending the year with rates at 3%.
Methodology
This recommendation was prepared based on a technical analysis of the AUDNZD chart and a fundamental analysis of both economies (focusing on Australian and New Zealand monetary policy). The directional bias was determined using moving averages, price action, and market expectations regarding central bank responses to the ongoing conflict in Iran. Take Profit and Stop Loss levels were set using Price Action methodology (TP1 at the nearest resistance, TP2 at the recent peak, and SL at the nearest swing low).
The Overbalance analysis aims to identify three financial instruments, analyzed primarily on the daily/four-hour (D1/H4) timeframe. The analysis uses only the Overbalance methodology, which helps determine where a trend may continue or where it may reverse. Today’s analysis covers three instruments, evaluated solely in terms of 1:1 correction structures.
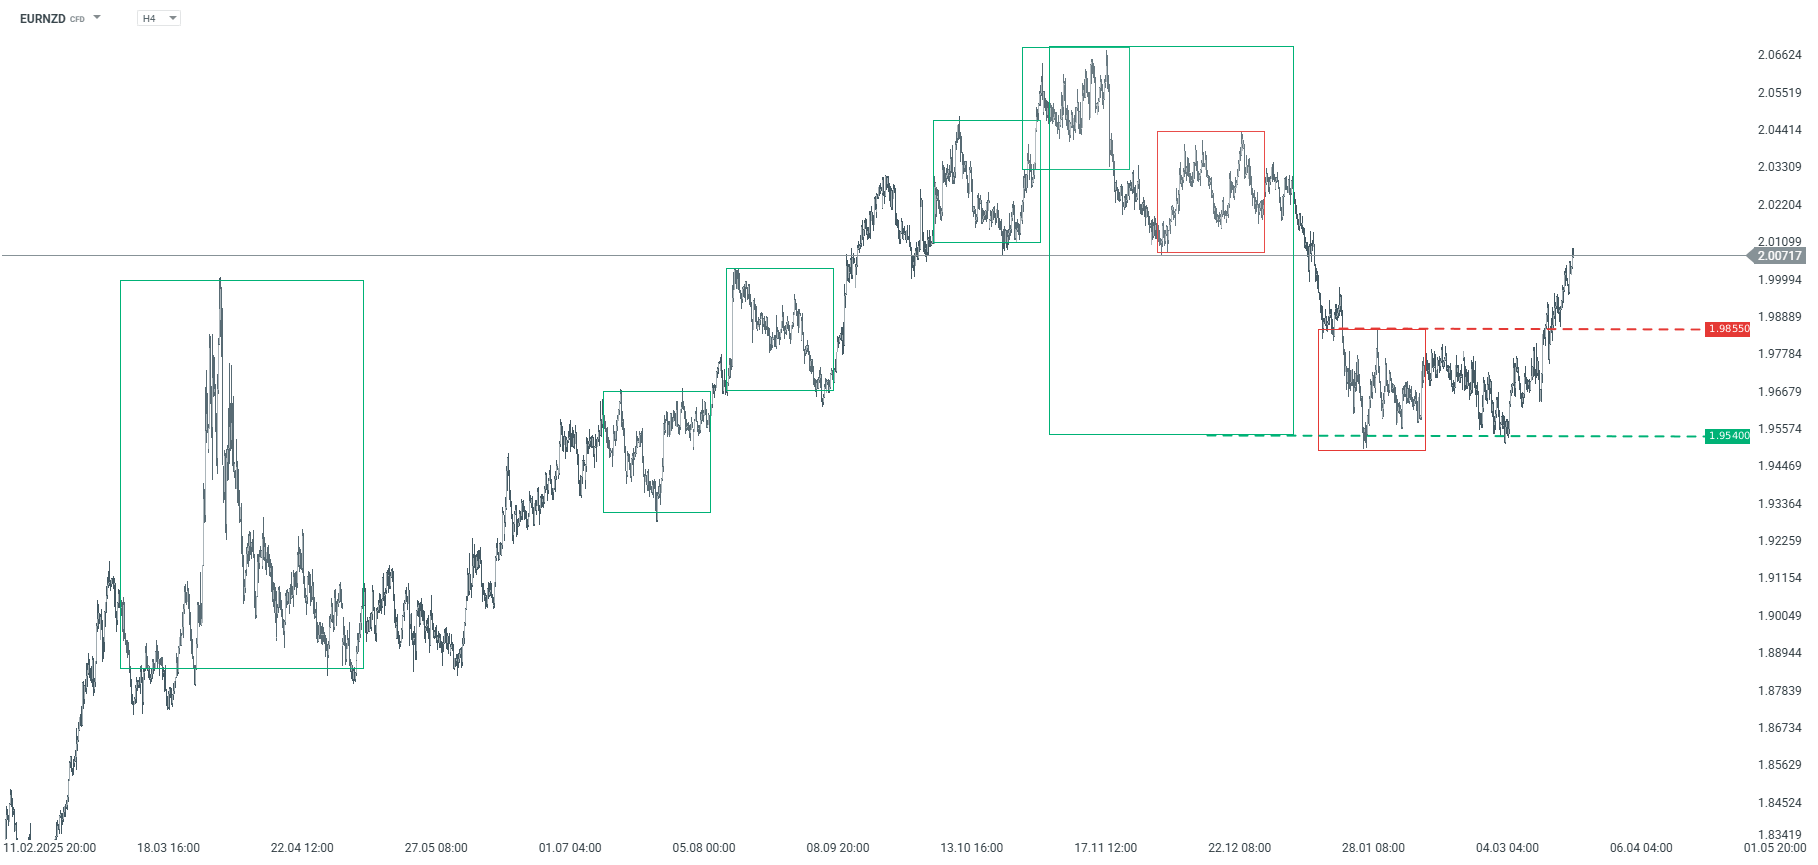
EURNZD Last week, the EURNZD broke through key resistance at 1.9855, which corresponded to the upper boundary of the 1:1 geometric pattern. According to the Overbalance methodology, this breakout suggests potential for a move toward last November’s highs, around 2.0680. An additional argument in favor of the bullish scenario is the earlier double bounce off support at 1.9540. In the event of a correction, the 1.9855 level should act as short-term support.
EURNZD – H4 timeframe. Source: xStation
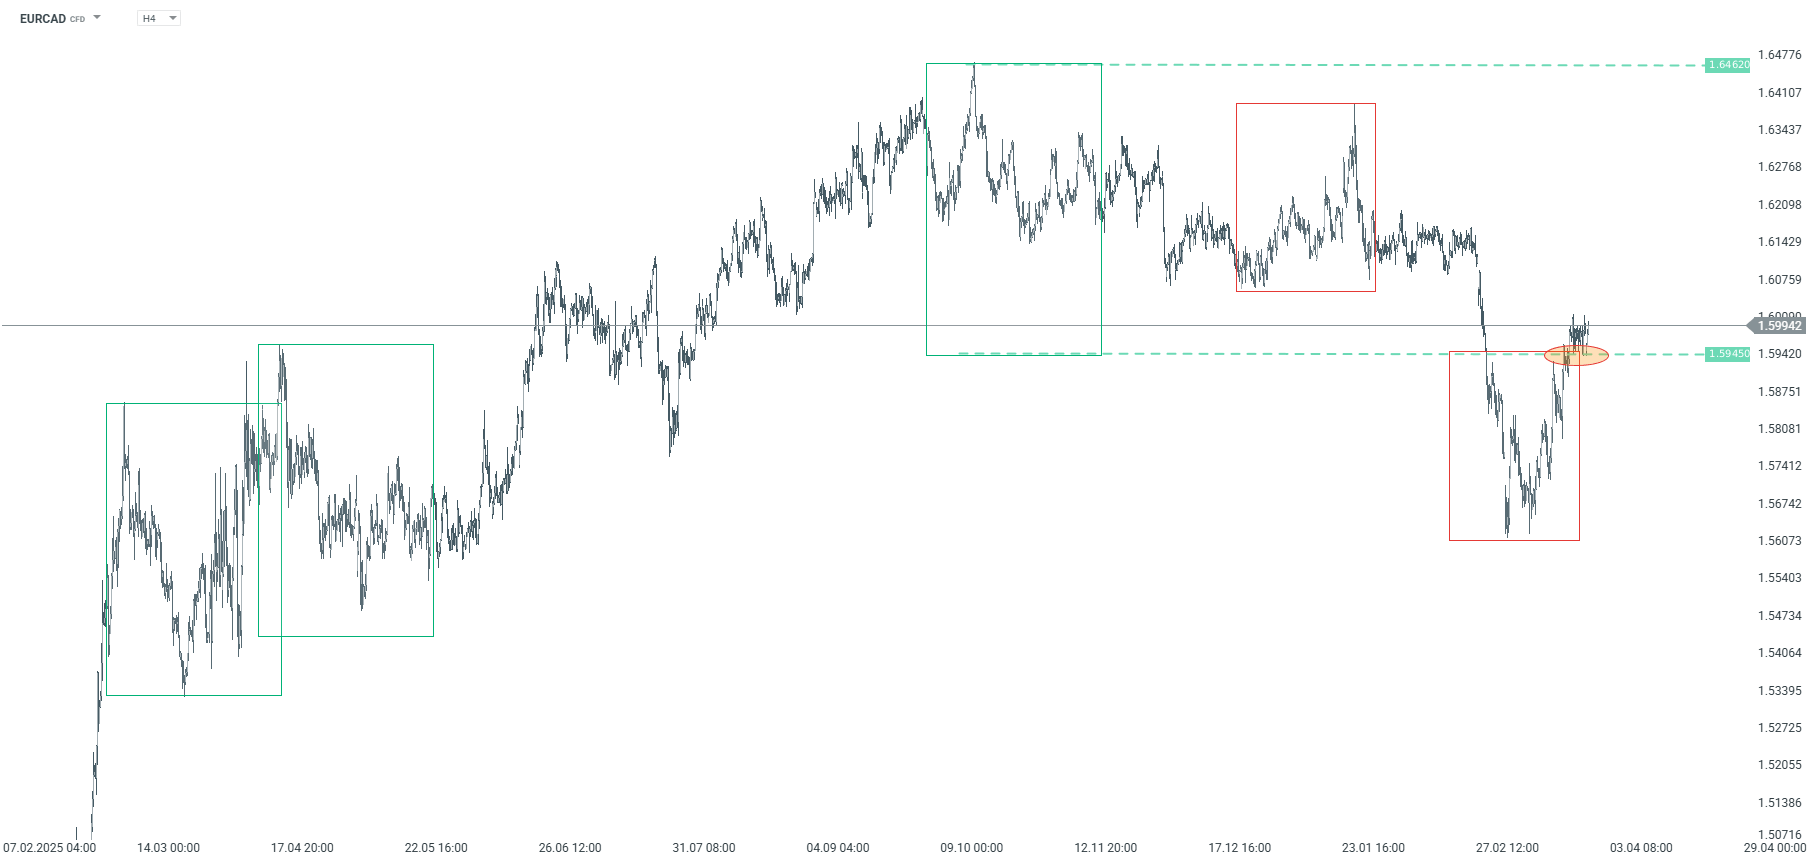
EURCAD The EURCAD pair is attempting to resume its upward trend. The price has broken above the upper boundary of the 1:1 bearish pattern at the 1.5945 level and has also broken above the polarity of the previous bullish pattern, which falls exactly at the same point. According to the Overbalance methodology, as long as the price remains above the 1.5945 level, the bullish scenario remains in effect.
EURCAD – H4 timeframe. Source: xStation
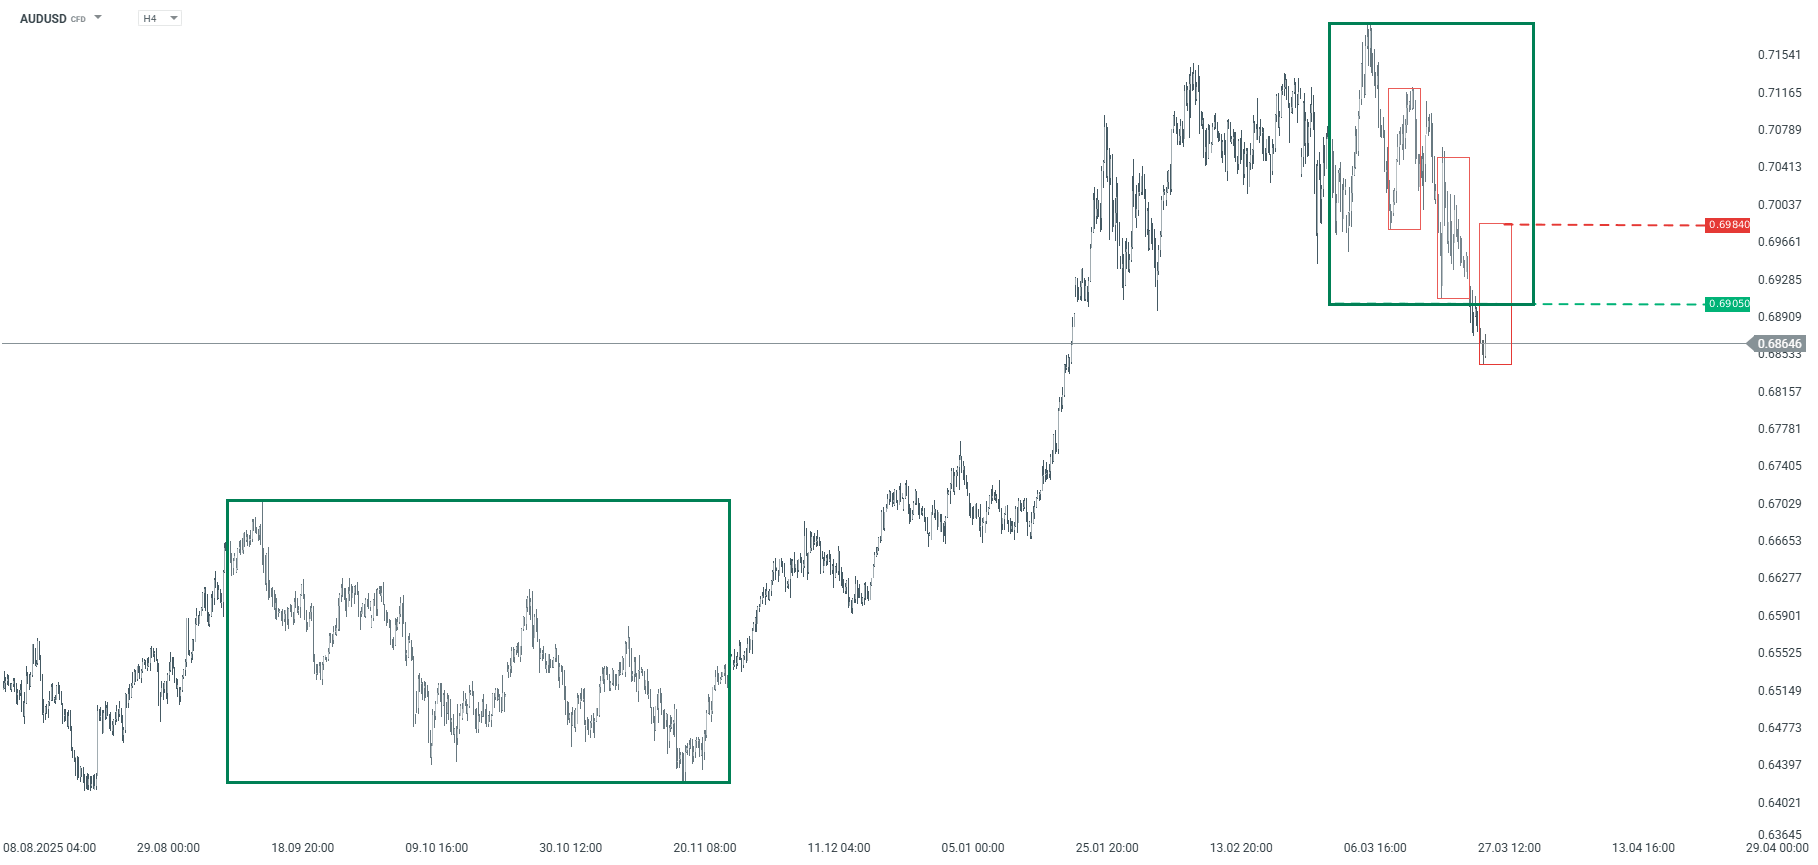
AUDUSD The AUDUSD price has broken below the key support level at 0.6905, which corresponded to the lower boundary of a broad 1:1 pattern. A break below this level could support a scenario involving a deeper correction or even a trend reversal. Currently, the 0.6905 level acts as key resistance. To signal a return to an uptrend, the price would need to additionally break above the 0.6984 level, where the upper boundary of the local 1:1 downtrend pattern is located.
AUDUSD – H4 chart. Source: xStation
The material on this page does not constitute financial advice and does not take into account your level of understanding, investment objectives, financial situation or any other specific needs. All information provided, including opinions, market research, mathematical results and technical analyzes published on the Website or transmitted To you by other means, it is provided for information purposes only and should in no way be construed as an offer or solicitation for a transaction in any financial instrument, nor should the information provided be construed as advice of a legal or financial nature on which any investment decisions you make should be based exclusively To your level of understanding, investment objectives, financial situation, or other specific needs, any decision to act on the information published on the Website or sent to you by other means is entirely at your own risk if you In doubt or unsure about your understanding of a particular product, instrument, service or transaction, you should seek professional or legal advice before trading. Investing in CFDs carries a high level of risk, as they are leveraged products and have small movements Often the market can result in much larger movements in the value of your investment, and this can work against you or in your favor. Please ensure you fully understand the risks involved, taking into account investments objectives and level of experience, before trading and, if necessary, seek independent advice.
To provide the best experiences, we use technologies like cookies to store and/or access device information. Consenting to these technologies will allow us to process data such as browsing behavior or unique IDs on this site. Not consenting or withdrawing consent, may adversely affect certain features and functions.
Functional
Always active
The technical storage or access is strictly necessary for the legitimate purpose of enabling the use of a specific service explicitly requested by the subscriber or user, or for the sole purpose of carrying out the transmission of a communication over an electronic communications network.
Preferences
The technical storage or access is necessary for the legitimate purpose of storing preferences that are not requested by the subscriber or user.
Statistics
The technical storage or access that is used exclusively for statistical purposes.The technical storage or access that is used exclusively for anonymous statistical purposes. Without a subpoena, voluntary compliance on the part of your Internet Service Provider, or additional records from a third party, information stored or retrieved for this purpose alone cannot usually be used to identify you.
Marketing
The technical storage or access is required to create user profiles to send advertising, or to track the user on a website or across several websites for similar marketing purposes.