Currency Hedger No Comments

USD/JPY Price Forecast: Defends 200-SMA support on H4; bulls seem hesitant near 159.00

  • USD/JPY edges higher during the Asian session on Wednesday, though it lacks follow-through.
  • Hormuz risks undermine the JPY and lend support to spot prices amid a modest USD recovery.
  • The mixed technical setup warrants some caution before placing aggressive directional bets.

The USD/JPY pair once again shows some resilience below the 200-period Simple Moving Average (SMA) on the 4-hour chart and edges higher during the Asian session on Wednesday. Spot prices, however, lack bullish conviction and struggle to capitalize on the strength beyond the 159.00 mark.

Despite the optimism over Iran diplomacy, economic concerns stemming from the instability in the Strait of Hormuz hold back traders from placing bullish bets around the Japanese Yen (JPY). This, along with a modest US Dollar (USD) recovery from its lowest level since early March, turns out to be another factor lending some support to the USD/JPY pair. However, the optimism over continued US-Iran peace talks and diminishing odds for a rate hike by the USย Federal Reserveย (Fed) caps the upside for the currency pair.

From a technical perspective, the USD/JPY pair retains a mildly bullish near-term bias as it remains above the 158.30-158.25 horizontal support. Moreover, the Moving Average Convergence Divergence (MACD) indicator is slightly negative and flat below the zero line, suggesting waning bearish pressure rather than a strong directional impulse for now. That said, the Relative Strength Index (RSI) around 46 hints at only modest downside momentum. This, in turn, warrants caution before positioning for further gains.

Meanwhile, the 200-period SMA on the 4-hour chart near 158.76 might continue to protect the immediate downside. A sustained break would weaken the constructive tone and open the door to a deeper correction. As long as USD/JPY holds above this moving average, dips are likely to attract buyers, though the lack of bullish conviction implies that the near-term trajectory will have to be defined on the basis of forthcoming price action rather than the existing mixed technical setup.

USD/JPY 4-hour chart

Chart Analysis USD/JPY

Japanese Yen Price Today

The table below shows the percentage change of Japanese Yen (JPY) against listed major currencies today. Japanese Yen was the strongest against the Canadian Dollar.

USDEURGBPJPYCADAUDNZDCHF
USD0.07%0.01%0.13%0.06%-0.15%0.03%0.07%
EUR-0.07%-0.06%0.07%-0.02%-0.15%-0.04%-0.00%
GBP-0.01%0.06%0.11%0.09%-0.10%-0.01%0.05%
JPY-0.13%-0.07%-0.11%-0.06%-0.21%-0.12%-0.07%
CAD-0.06%0.02%-0.09%0.06%-0.13%-0.04%-0.01%
AUD0.15%0.15%0.10%0.21%0.13%0.10%0.14%
NZD-0.03%0.04%0.00%0.12%0.04%-0.10%0.04%
CHF-0.07%0.00%-0.05%0.07%0.00%-0.14%-0.04%

The heat map shows percentage changes of major currencies against each other. The base currency is picked from the left column, while the quote currency is picked from the top row. For example, if you pick the Japanese Yen from the left column and move along the horizontal line to the US Dollar, the percentage change displayed in the box will represent JPY (base)/USD (quote).


Currency Hedger No Comments

EUR/USD Price Forecast: Steadies below 1.1800 near eight-week highs

  • EUR/USD may retest the ascending channel top near the eight-week high of 1.1834.
  • The 14-day Relative Strength Index near 64 indicates solid positive momentum.
  • The immediate support lies at the nine-day EMA at 1.1701.

EUR/USD remains calm after halting its seven-day winning streak, trading around 1.1790 during the Asian hours on Wednesday. The daily chart technical analysis indicates a bullish bias, as the pair is moving upwards within an ascending channel.

The EUR/USD pairย maintains a bullish near-term bias as spot holds above both the nine-day and 50-day Exponential Moving Averages (EMAs). The pair is pressing higher with the 14-day Relative Strength Index hovering near 64, suggesting firm positive momentum but edging towards overbought territory as price approaches nearby overhead levels.

On the upside, the EUR/USD pair may retest its immediate barrier at the upper boundary of the ascending channel around 1.1830, followed by the eight-week high of 1.1834, reached on February 23. A sustained break above this confluence resistance zone would lead the pair to explore the region around 1.2082, the highest since June 2021, reached on January 27.

The EUR/USD pair may find the initial support at the nine-day EMA of 1.1701, followed by the nine-day EMA of 1.1654 and the lower ascending channel boundary around 1.1630. Further declines below the channel would expose the eight-month low of 1.1411, recorded on March 13.

EUR/USD: Daily Chart

Euro Price Today

The table below shows the percentage change of Euro (EUR) against listed major currencies today. Euro was the weakest against the Australian Dollar.

USDEURGBPJPYCADAUDNZDCHF
USD0.07%0.00%0.11%0.06%-0.17%0.02%0.06%
EUR-0.07%-0.06%0.06%-0.01%-0.17%-0.05%-0.01%
GBP-0.00%0.06%0.13%0.09%-0.10%0.01%0.05%
JPY-0.11%-0.06%-0.13%-0.06%-0.21%-0.14%-0.08%
CAD-0.06%0.00%-0.09%0.06%-0.15%-0.05%-0.02%
AUD0.17%0.17%0.10%0.21%0.15%0.10%0.15%
NZD-0.02%0.05%-0.01%0.14%0.05%-0.10%0.05%
CHF-0.06%0.00%-0.05%0.08%0.02%-0.15%-0.05%

The heat map shows percentage changes of major currencies against each other. The base currency is picked from the left column, while the quote currency is picked from the top row. For example, if you pick the Euro from the left column and move along the horizontal line to the US Dollar, the percentage change displayed in the box will represent EUR (base)/USD (quote).

Currency Hedger No Comments

EUR/USD holds near 1.1800 due to rising optimism on US-Iran talks

  • EUR/USD may extend gains as the US Dollar weakens on optimism over renewed USโ€“Iran talks.
  • Trump signaled talks may restart this week, with opposing a 20-year suspension of Iranโ€™s nuclear enrichment program.
  • ECBโ€™s Lagarde said the bank is well-positioned on Iran risks but warned itโ€™s too early to dismiss the shock.

EUR/USD remains flat after seven days of gains, trading around 1.1790 during the Asian hours on Wednesday. The pair may extend its gains as the US Dollar (USD) weakened amid rising optimism that the United States (US) and Iran could soon resume negotiations, boosting hopes for a deal to end the conflict and reopen the Strait of Hormuz.

The New York Post reported that US President Donald Trump signaled talks could restartย this week, while also noting he opposes a 20-year suspension of Iranโ€™s nuclear enrichment program. Meanwhile, Vice President JD Vance highlighted โ€œa lot of progressโ€ in the initial round of Iran negotiations in Pakistan, with follow-up talks potentially scheduled within days

Meanwhile, softer-than-expected US Producer Price Index (PPI) data reinforced the view of easing inflation pressures. Notably, the services component, closely watched by theย Federal Reserveย (Fed), stood out, as it excludes direct energy and tariff-related effects.

The US PPI rose 0.5% month-over-month (MoM), well below the 1.2% consensus, while core PPI printed at 0.1% MoM versus expectations of 0.6%. On an annual basis, US PPI increased 4% in March, missing the 4.6% forecast and rising from Februaryโ€™s 3.4%, while Core PPI held steady at 3.8% YoY, unchanged from the prior month.

The Euroย (EUR) finds support as easing energy prices provide relief to theย Eurozone, given its status as a net importer of crude oil and natural gas. Markets are pricing modest tightening by the European Central Bank (ECB) at the April 30 meeting, along with two additional rate hikes this year.

ECB Presidentย Christine Lagardeย stated that the central bank is well-positioned to manage developments related to Iran, while cautioning that it is too early to dismiss the impact of the shock.

Currency Hedger No Comments

JPY bulls seem hesitant despite Iran diplomacy hopes; USD/JPY trades below 159.00

  • USD/JPY struggles to attract any meaningful buyers during the Asian session on Wednesday.
  • Hormuz risks continue to fuel economic worries, undermining the JPY and supporting the pair.
  • Iran diplomacy hopes and reduced Fed rate hike bets weigh on the USD, capping spot prices.

The USD/JPY pair is seen consolidating the previous day’s losses and oscillating in a narrow band below the 159.00 mark during the Asian session on Wednesday. Spot prices, however, remain confined in a broader trading range held over the past month or so, warranting some caution before placing aggressive directional bets amid mixed cues.

Despite the optimism over Iran diplomacy, the Japanese Yen (JPY) has been struggling to attract any meaningful buyers amid economic concerns stemming from the instability in the Strait of Hormuz. The US Navy blockade of Iranian ports took effect on Monday, threatening to further constrain already shuttered oil flows through the vital waterway. Given that Japan depends mostly on oil imports from the Middle East, the blockade fuels worries that the economy will come under substantial strain in the foreseeable future. This, in turn, undermines the JPY and acts as a tailwind for the USD/JPY pair.

Meanwhile, hopes that US-Iran peace talks would continue remain supportive of the risk-on impulse, which is evident from the upbeat mood across the global equity markets. Adding to this, the softer US Producer Price Index (PPI) released on Tuesday forced traders to further scale back bets for immediate interest rate hikes by the USย Federal Reserveย (Fed). This keeps the US Dollar (USD) depressed near its lowest level since early March, set the previous day. Furthermore, intervention fears might continue to offer some support to the JPY and contribute to capping the upside for the USD/JPY pair.

There isn’t any relevant market-moving economic data due for release from Japan or the US on Wednesday, leaving the currency pair at the mercy of the USD price dynamics. Nevertheless, geopolitical developments would continue to infuse volatility in the financial markets and continue to produce some trading opportunities around the USD/JPY pair. The fundamental backdrop, however, makes it prudent to wait for a sustained breakout through a short-term trading range before positioning for a firm near-term trajectory.

Currency Hedger No Comments

AUD gains support from USโ€“Iran talks optimism

  • Australian Dollar appreciates amid reports of renewed USโ€“Iran talks ahead of the two-week ceasefire expiring.
  • US Vice President Vance cited โ€œsignificant progressโ€ in initial Iran talks in Pakistan, with follow-up discussions likely within days.
  • RBAโ€™s Hauser warned that the coming months will be challenging amid the energy crisis and high inflation.

AUD/USDย gains ground for the third successive day, trading around 0.7120 during the Asian hours on Wednesday. The pair appreciates as the Australian Dollar (AUD) receives support from improved market sentiment due to the potential for further United States (US)-Iran talks.

The New York Post reported that US President Donald Trump signaled negotiations could resumeย this week, while also opposing a 20-year suspension of Iranโ€™s nuclear enrichment program. Meanwhile, Vice President JD Vance highlighted โ€œsignificant progressโ€ in the initial round of Iran talks held in Pakistan, with follow-up discussions potentially set to take place within days.

Reserve Bank of Australia (RBA) Deputy Governor Andrew Hauser warned on Tuesday during a fireside chat that the months ahead will be challenging for Australia amid the energy crisis driven by Middle East tensions and elevated inflation pressures. Hauser noted that the economy is struggling to absorb the shock due to persistent inflation and supply constraints, increasing the risk of a stagflation-like scenario.

On the data front, softer-than-expected US Producer Price Index (PPI) data reinforced easing inflation pressures, reducing the need for theย Federal Reserveย (Fed) to raiseย rates. Notably, the services component, closely watched by the Fed, stood out, as it excludes direct energy and tariff-related effects.

The US PPI rose 0.5% month-over-month (MoM), well below the 1.2% consensus, while core PPI printed at 0.1% MoM versus expectations of 0.6%. On an annual basis, US PPI increased 4% in March, missing the 4.6% forecast and rising from Februaryโ€™s 3.4%, while Core PPI held steady at 3.8% YoY, unchanged from the prior month.

Currency Hedger No Comments

USD/CAD gains ground above 1.3700 while outlook remains uncertain amid Iran optimism

  • USD/CAD edges up to near 1.3780; outlook remains worsened on hopes of US-Iran permanent ceasefire.
  • US President Trump expresses confidence that the war with Iran is close to over.
  • Investors await the announcement of another round of US-Iran talks.

Theย USD/CADย pair trades slightly higher to near 1.3780 during the European trading session on Wednesday. The Loonie pair gained a temporary ground after posting a fresh three-week low near 1.3730 on Tuesday; however, theย outlookย remains uncertain amid hopes that the United States (US) and Iran could reach a permanent ceasefire soon.

Earlier in the day, US President Donald Trump said in an interview with Foxย News, โ€œI view it as very close to over,โ€ when asked how long the war with Iran will continue.

Meanwhile, US Vice President (VP) JD Vance has also expressed confidence, in a public event, that both sides are working towards a deal, and talks are taking place via channels including Pakistan. Vance added, โ€œDiscussions have made tremendous progress, and the current ceasefire holds for a seventh consecutive day.โ€

During the press time, market sentiment remains risk-on amid hopes of a US-Iran ceasefire. S&P 500 futures hold onto Tuesdayโ€™s gains near 6,970. The US Dollar Index (DXY), which tracks the Greenbackโ€™s value against six major currencies, trades 0.1% higher to near 98.20, but is still close to its over six-week low of 97.97 posted on Tuesday.

US Dollar Price Last 7 Days

The table below shows the percentage change of US Dollar (USD) against listed major currencies last 7 days. US Dollar was the weakest against the New Zealand Dollar.

USDEURGBPJPYCADAUDNZDCHF
USD-1.61%-1.98%-0.40%-0.77%-2.19%-2.80%-2.03%
EUR1.61%-0.39%1.20%0.80%-0.63%-1.22%-0.45%
GBP1.98%0.39%1.62%1.23%-0.26%-0.83%-0.05%
JPY0.40%-1.20%-1.62%-0.38%-1.83%-2.53%-1.62%
CAD0.77%-0.80%-1.23%0.38%-1.36%-2.15%-1.23%
AUD2.19%0.63%0.26%1.83%1.36%-0.71%0.20%
NZD2.80%1.22%0.83%2.53%2.15%0.71%0.89%
CHF2.03%0.45%0.05%1.62%1.23%-0.20%-0.89%

The heat map shows percentage changes of major currencies against each other. The base currency is picked from the left column, while the quote currency is picked from the top row. For example, if you pick the US Dollar from the left column and move along the horizontal line to the Japanese Yen, the percentage change displayed in the box will represent USD (base)/JPY (quote).

Going forward, investors will focus on the outcome of the second round of US-Iran talks, whose date has not been confirmed, but will likely take place before the expiration of the two-week ceasefire on April 21, according to Reuters.

On the domestic front, traders do not expect theย Federal Reserveย (Fed) to raise interestย ratesย this year anymore amid optimism on the US-Iran truce.

Currency Hedger No Comments

Trade of The Day – EUR/USD

Facts:

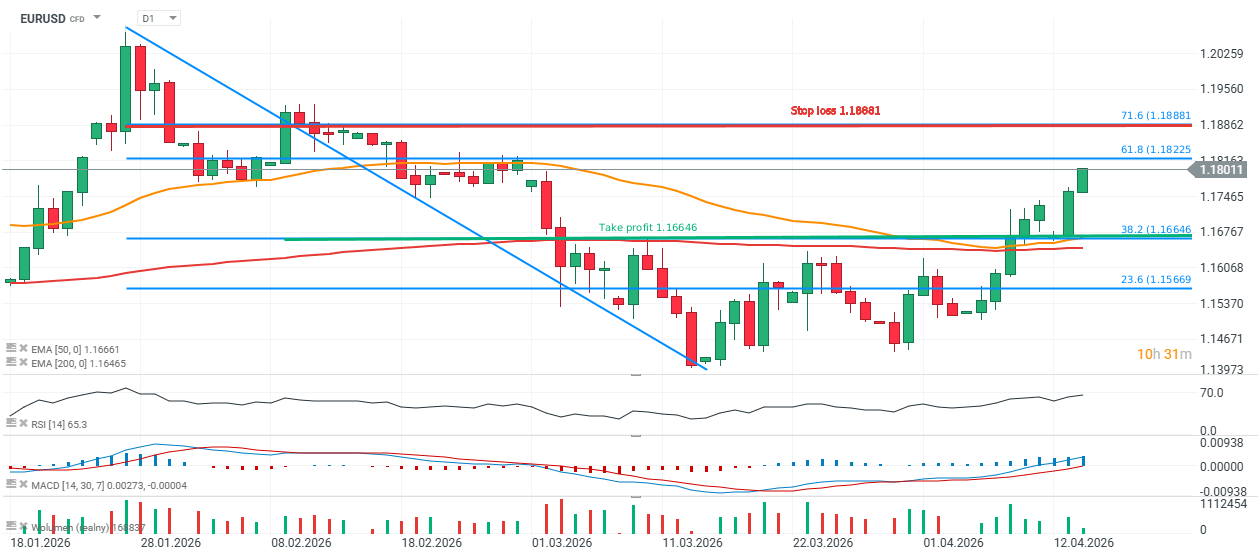
  • EUR/USD is trading at 1.18 12:30 PM GMT on Tuesday, April 14, one hour ahead of the U.S March PPI release
  • The pair has managed to break above both the 200- and 100-session exponential moving averages (EMA200 and EMA100)
  • The daily RSI is above 65, while MACD remains supportive, and the pair is trading near the 61.8% Fibonacci retracement of the downtrend that began on January 27

Recommendation:

  • Position: Short EUR/USD at market price
  • Take Profit: 1.16646
  • Stop Loss: 1.18881

View:

From a technical perspective, EUR/USD has re-entered an upward trend, but the reboundโ€”driven by growing optimism around a potential resolution of the U.S.โ€“Iran conflictโ€”has been unusually sharp. At the same time, conditions in global energy marketsโ€”on which Europe is more dependent than the U.S remain challenging. IEA President Fatih Birol indicated that normalization of supply from the Middle East could take up to two years due to the scale of infrastructure damage. As a result, the 61.8% Fibonacci retracement of the late-January downtrend, further reinforced by prior price reactions (February consolidation), may act as a significant resistance level for EUR/USD. Uncertainty surrounding the Strait of Hormuz is likely to persist, with Iran maintaining that the U.S. will not control this key trade route. In an escalation scenario, sentiment toward EUR/USD may gradually weaken, and even if the conflict ultimately resolves favorably for Europe, the pair could experience elevated volatility along the way. Also, multiple US macro data signals that price pressure is starting to rise across the economy, which may lead to still quite ‘hawkish’ Fed stance ahead of the summer. Technically, the daily RSI has risen to 65, while the hourly RSI stands at 79.1โ€”both suggesting overbought conditions. Given this setup, a short position is favored, targeting 1.16646 with a protective stop at 1.18881. M

Source: xStation5

Currency Hedger No Comments

Currency Talk – GBP/USD, GBP/JPY USD/CHF

This analysis from the Overbalance series aims to identify three financial instruments, analyzed primarily on the daily/four-hour (D1/H4) timeframe. The analysis uses only the Overbalance methodology, which helps determine where a trend may continue or where a reversal might occur.
Todayโ€™s analysis covers three instruments, evaluated solely in terms of 1:1 correction structures.

GBPUSD
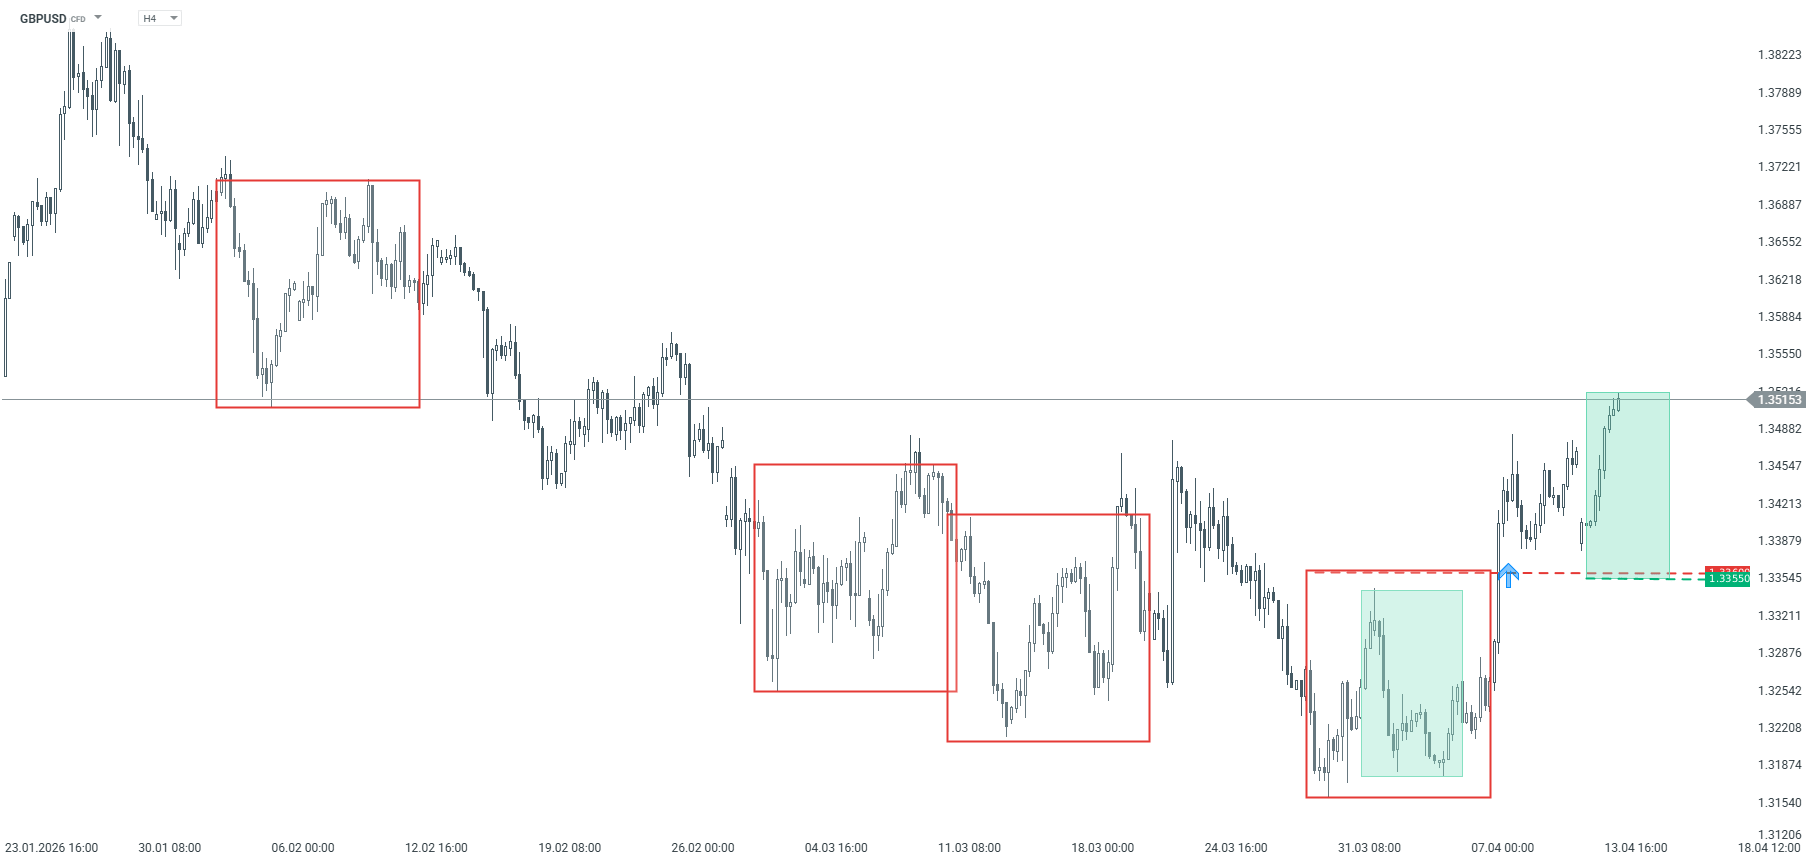
GBPUSD prices have been trending downward for quite some time, but on April 8, the 1:1 geometry was negated, which, according to the Overbalance methodology, paves the way for a larger correction or even a shift to an uptrend. Currently, the 1.3360โ€“1.3355 zone should be treated as key support, where both the polarity of the negated downward geometry and the lower boundary of the local 1:1 upward pattern are located. As long as the price remains above this zone, the bullish sentiment prevails. Only a drop below 1.3355 could push the market back toward declines.

GBPUSD – H4 chart. Source: xStation

GBPJPY
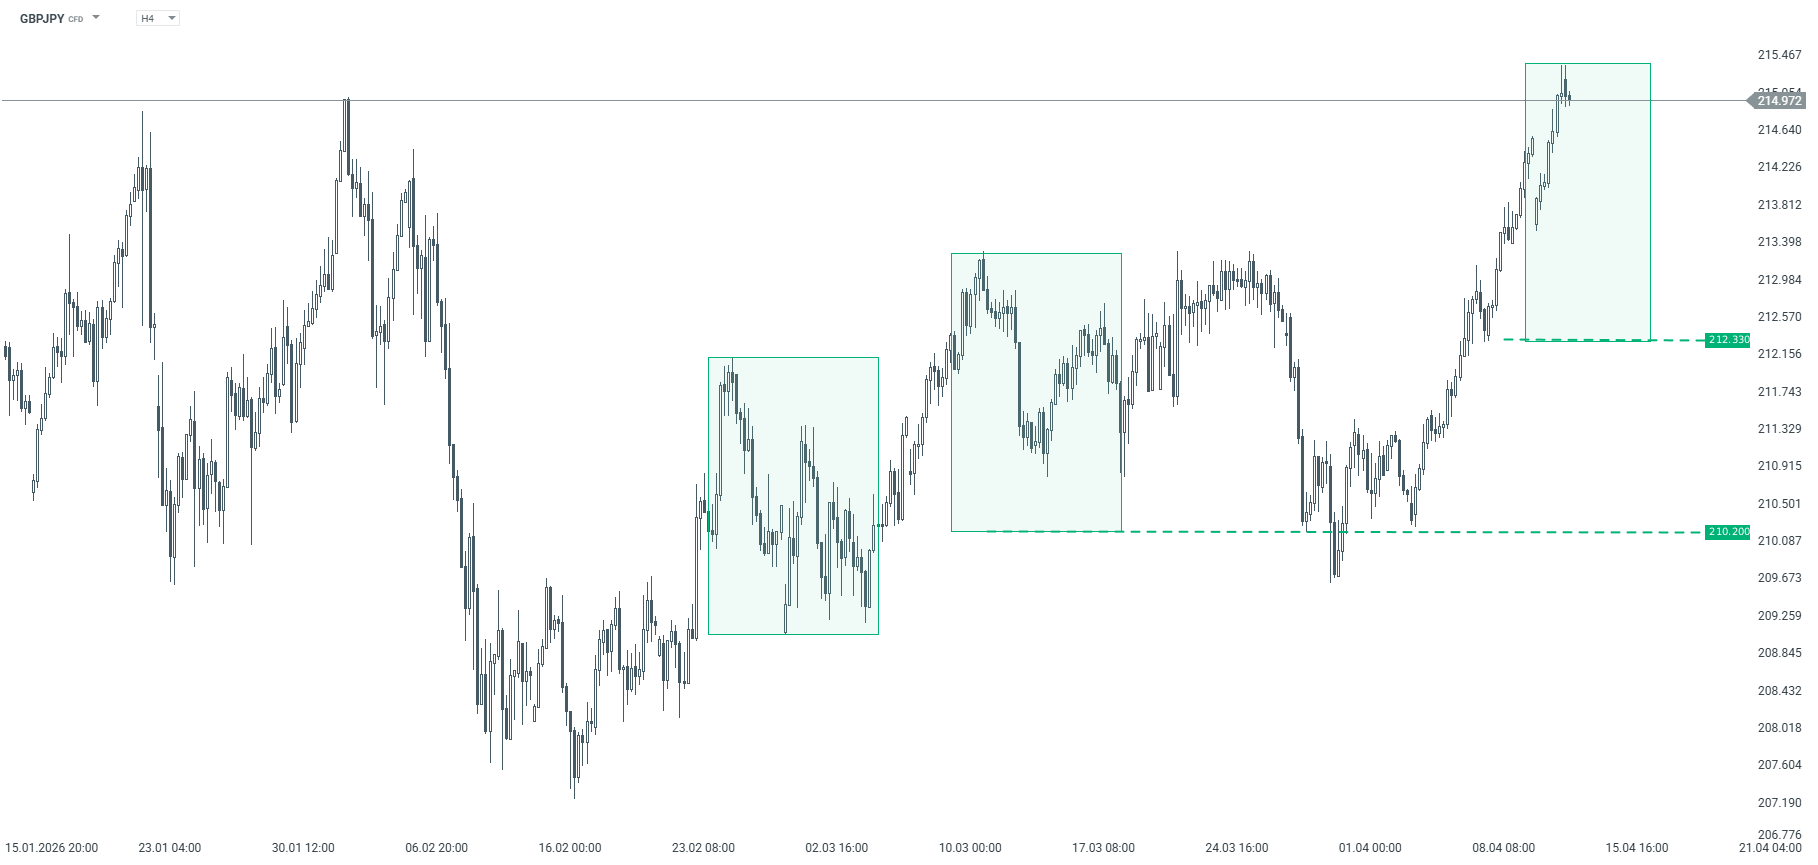
GBPJPY has been in an uptrend for some time now. The last two corrections were of identical magnitude, as indicated by the green rectangles, confirming the marketโ€™s rhythm in line with the Overbalance methodology. Currently, the price is trading near local highs. In the event of a correction, the key support level remains at 212.33, derived from the 1:1 ratio. At this point, there are no clear supply signals, so the base case scenario remains a continuation of the uptrend.

GBPJPY – H4 timeframe. Source: xStation

USDCHF
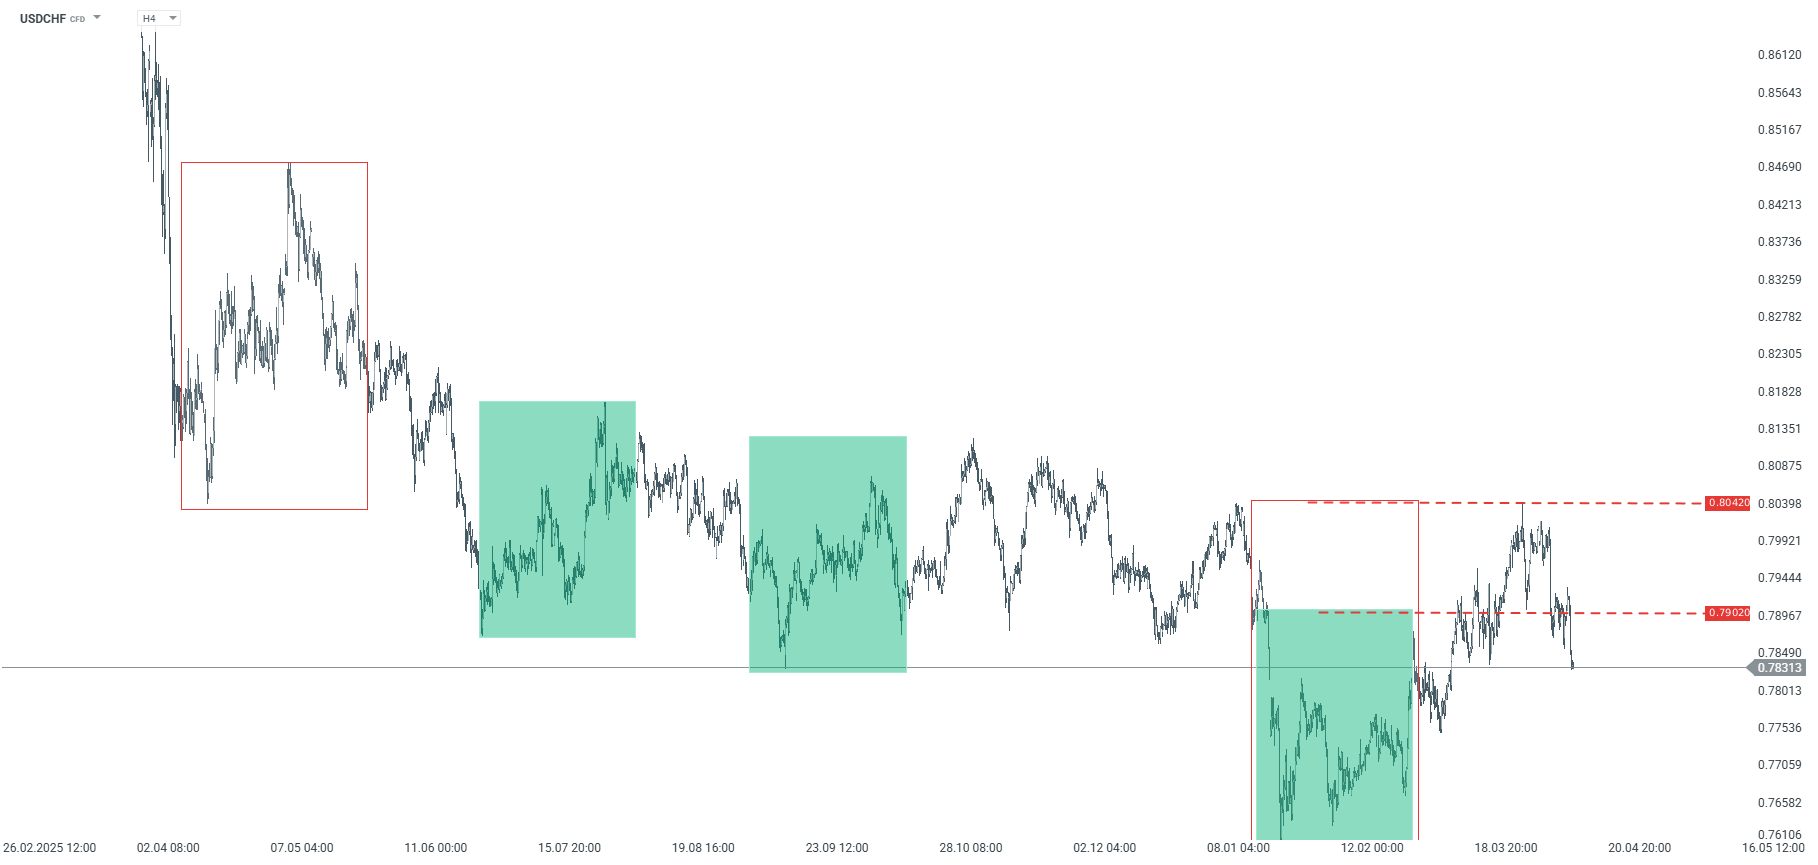
The USDCHF pair rebounded from key resistance at the 0.8042 level, which stems from the largest corrective pattern within the downtrend that has been ongoing since January 2025. Additionally, the price fell below the 0.7902 level, which is the upper boundary of a smaller 1:1 pattern; according to the Overbalance methodology, this supports the scenario of further declines toward the January lows. To signal a shift to an uptrend, prices would need to break above the 0.8042 level; however, this is not the base case scenario at this time.

USDCHF – H4 timeframe. Source: xStation

The material on this page does not constitute financial advice and does not take into account your level of understanding, investment objectives, financial situation or any other specific needs. All information provided, including opinions, market research, mathematical results and technical analyzes published on the Website or transmitted To you by other means, it is provided for information purposes only and should in no way be construed as an offer or solicitation for a transaction in any financial instrument, nor should the information provided be construed as advice of a legal or financial nature on which any investment decisions you make should be based exclusively To your level of understanding, investment objectives, financial situation, or other specific needs, any decision to act on the information published on the Website or sent to you by other means is entirely at your own risk if you In doubt or unsure about your understanding of a particular product, instrument, service or transaction, you should seek professional or legal advice before trading. Investing in CFDs carries a high level of risk, as they are leveraged products and have small movements Often the market can result in much larger movements in the value of your investment, and this can work against you or in your favor. Please ensure you fully understand the risks involved, taking into account investments objectives and level of experience, before trading and, if necessary, seek independent advice.