EUR/USD holds near a seven-week high as weak US payrolls weigh on the US Dollar.
Bullish RSI and MACD readings suggest buyers retain the upper hand.
The 100-day SMA caps immediate gains, with a break exposing the 200-day SMA.
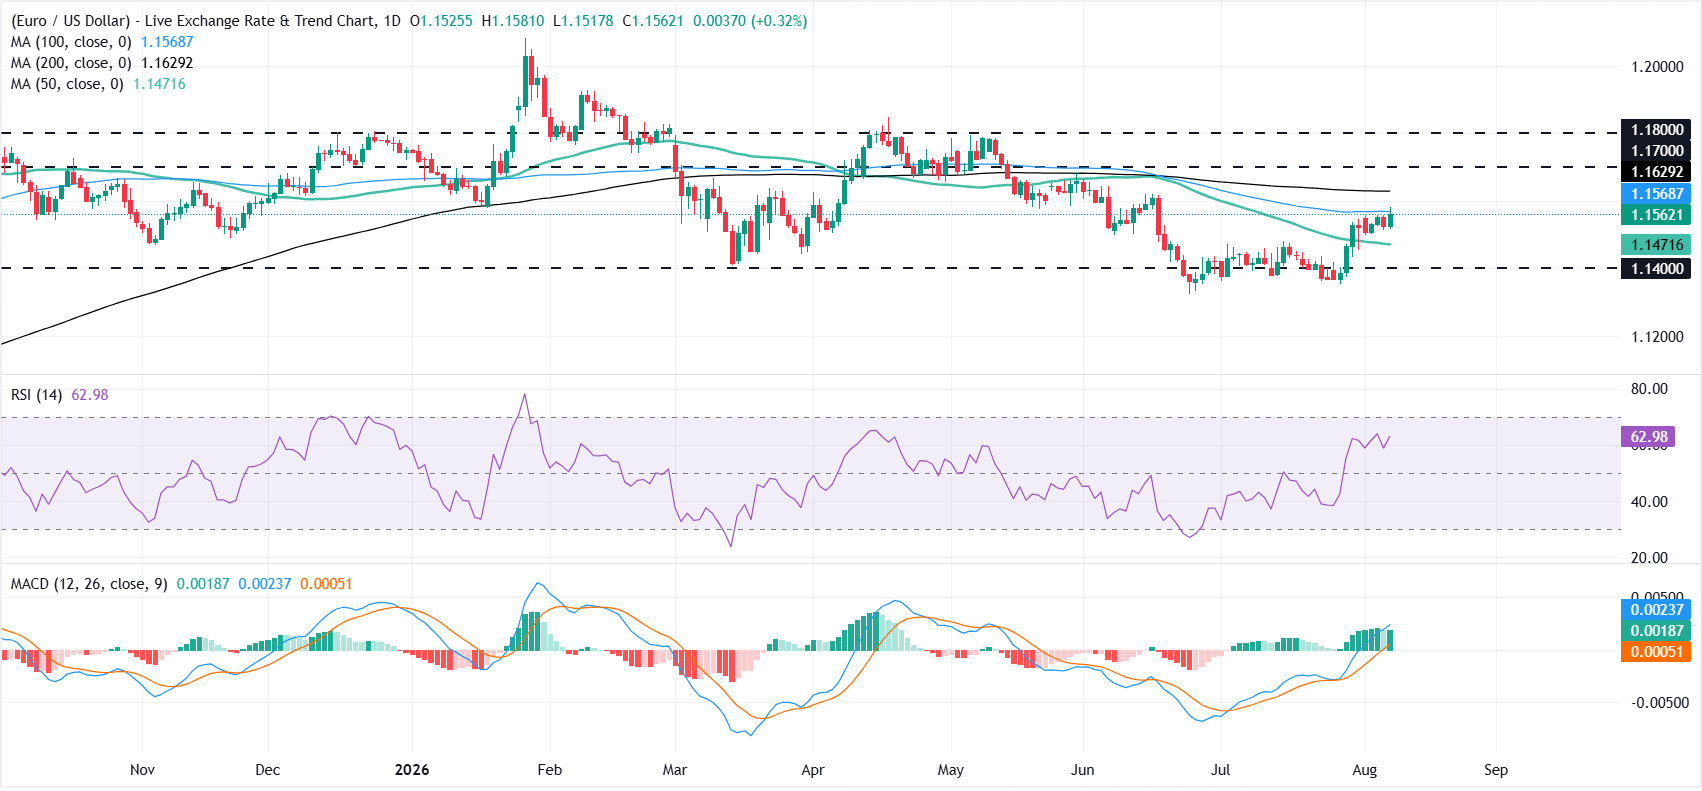
EUR/USD edges higher on Friday, supported by a softer US Dollar (USD) as traders scale back Federal Reserve (Fed) rate-hike bets following a disappointing US Nonfarm Payrolls (NFP) report. At the time of writing, the pair trades around 1.1562, hovering near a seven-week high.
Price action, however, has been confined to a narrow range for more than a week, with the 100-day Simple Moving Average (SMA) capping immediate upside attempts after the pair staged a rebound from below 1.1400 in late July.
Still, the near-term outlook remains bullish, as the dovish repricing of Fed rate expectations and optimism surrounding peace in the Middle East and the reopening of the Strait of Hormuz could keep the US Dollar on the defensive. The EUR/USD recovery faces its next major test from the US Consumer Price Index (CPI) data due next week.
From a technical perspective, the daily chart shows that the 50-day SMA at 1.1471 offers immediate support, followed by the 1.1400 psychological mark.
The Relative Strength Index (RSI) at 63 points to bullish momentum, while the Moving Average Convergence Divergence (MACD) indicator stays positive, which hints that buyers retain an edge as long as price holds over the short-term average.
On the topside, immediate resistance is located at the 100-day SMA at 1.1568, followed by the 200-day SMA at 1.1629. A sustained break above these levels would expose the horizontal barriers at 1.1700 and 1.1800.
Mexican Peso rallies as weak NFP crushes Fed hike expectations.
Mexican inflation falls to six-year low after Banxico hold.
USD/MXN rebounds from a low of 17.09 but remains under bearish pressure.
The Mexican Peso (MXN) capitalizes on a weaker US jobs report and soars versus the US Dollar (USD) on Friday as risk appetite improves and the Greenback gets battered on speculation that the Federal Reserve (Fed) might not raise rates in 2026. At the time of writing, the USD/MXN pair trades at 17.18 after refreshing five-month lows at 17.09.
USD/MXN tumbles as Mexico’s inflation approaches target
The Mexican economic docket showed that inflation eased to a six-year low, from 3.37% to 3.12% YoY in July, according to INEGI, the National Statistics Agency. Core inflation, which strips volatile items, was 3.95% YoY, slightly exceeding forecasts of 3.94%. The report came a day after the Bank of Mexico (Banxico) left rates unchanged at 6.50%, while hinting that the main reference rate would remain steady for the foreseeable future.
Should inflation continue its downward trajectory, it could end 2026 below Banxico’s 3.5% forecast for headline and underlying inflation in 2026. The central bank projects that inflation will converge to its 3% goal in the last quarter of 2027.
Earlier, US Nonfarm Payrolls for July showed a 23K job loss, missing the forecast of an 80K gain. May and June revisions cut 103,000 jobs, lower than before. The data support the Fed’s pause on rate hikes, but the Unemployment Rate fell from 4.2% to 4.1%.
The report weakened the Greenback. The US Dollar Index (DXY), which measures the US Dollar’s strength against six other currencies, has fallen by 0.42% to 99.54.
Next week, the Mexican economic calendar will feature June Industrial Output. Across the southern border, investors are eyeing the release of inflation on the consumer and producer side, followed by jobless claims data and the University of Michigan (UoM) Consumer Sentiment.
USD/MXN Price Forecast: Technical outlook
USD/MXN daily chart
In the daily chart, USD/MXN trades at 17.1364, extending its retreat and holding below the clustered simple moving averages (SMA) trio now aligned near 17.4061, which reinforces a bearish near-term bias. The pair has also slipped back under the more recent downward resistance trend line, whose break point at 17.4584 acts as an additional topside cap, while the Relative Strength Index (14) at 32.4 hovers just above oversold territory, hinting that selling pressure is stretched but not yet exhausted.
On the topside, initial resistance is seen at the Triple SMA around 17.4061, followed by the downward-sloping trendline reference at 17.4584, where further rallies would likely stall unless momentum improves decisively. On the downside, the current area around 17.1364 is the immediate battleground, with a deeper slide opening the way toward the earlier structural break zone near 15.6962, while the RSI’s proximity to oversold levels suggests that any move lower could eventually invite a corrective bounce rather than a sustained reversal for now.
GBP/USD holds sideways, but upside bias survives above 1.3406.
Break above 1.3558 opens the path toward 1.3600.
Failure below 1.3500 risks a pullback toward key SMA support.
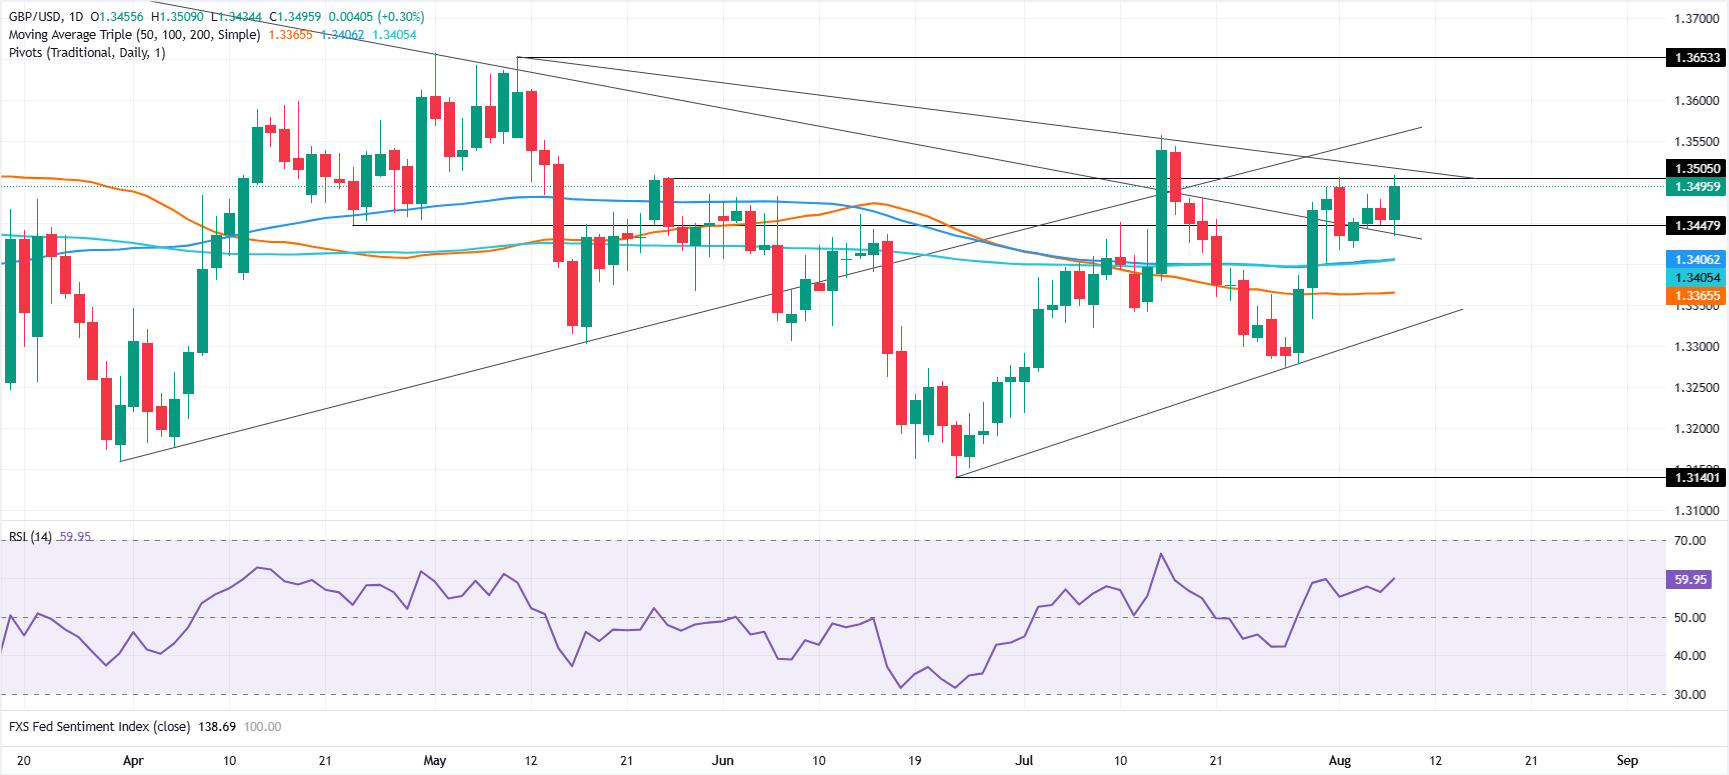
The Pound Sterling (GBP) edges higher by some 0.29% against the US Dollar (USD) on Friday, yet it remains trading sideways, unable to decisively crack 1.3500 after reaching a three-week peak of 1.3509, and has retreated to the 1.3490 area.
GBP/USD Price Forecast: Technical outlook
The technical picture shows that GBP/USD is consolidating, yet it is slightly tilted to the upside after clearing the 200-day Simple Moving Average (SMA) at 1.3406. Market structure suggests the uptrend might resume once buyers reclaim the July 15 swing high at 1.3558, opening the door to a test of 1.3600.
In that scenario, the next area of interest for GBP/USD would be the May 11 swing high at 1.3653, followed by 1.3700.
On the flip side, if GBP/USD remains below 1.3500, look for a pullback towards August’s 3 low of the day at 1.3417. A breach of the latter will expose the convergence of the 100- and 200-day SMAs at 1.3406/05, followed by the 50-day SMA at 1.3365.
The cross plunged near the start of the American session despite broad Euro gains elsewhere.
The Yen jumped after the US payrolls shock, with traders alert to intervention a week on from the joint Tokyo-Washington operation.
German industrial and trade figures offered the Euro little help, and the ECB is in no hurry.
EUR/JPY trades on the back foot on Friday, easing away even as the Euro (EUR) posts solid gains against the US Dollar (USD). The Japanese currency surged suddenly near the start of the American session after a surprisingly weak United States (US) employment report. But the cross recovered much of those losses fairly quickly.
Japan and the United States conducted coordinated Yen-buying intervention last Friday, a rare bilateral action, and that memory is enough to make traders reluctant to sell the Yen into a US Dollar that fell over 1% against the Yen during the early American session on Friday. The Yen now drifts well away from the 40-year low it reached in July.
The European Central Bank (ECB) continues to adopt a cautious stance after leaving interest rates unchanged at its latest meeting. Markets currently expect only one additional rate hike before the end of the year, with a lower chance of a second increase.
Iran’s parliament speaker and top negotiator, Mohammad Bagher Ghalibaf, accused US President Donald Trump of staging “theater diplomacy” on Thursday, and under the draft plan reported by Fars, US and Israeli ships would be barred from the Strait of Hormuz. Flows through the waterway are unlikely to return to pre-war levels any time soon even if Iran and Oman finalize their framework. For an economy that imports almost all of its energy through that route, higher and less certain Crude prices erode Japan’s terms of trade, which is the mechanism that drove the Yen to four-decade lows in the first place.
Short-term technical analysis:
On the 4-hour chart, EUR/JPY trades at 182.00, retaining a mildly bearish near-term bias as it holds below both the 20-period Simple Moving Average (SMA) at 182.17 and the 100-period SMA at 184.70. The pair is caught under a nearby horizontal cap at 182.13, while the Relative Strength Index (RSI) around 41 suggests subdued momentum rather than aggressive selling, hinting at a consolidative tone beneath these overhead levels.
On the topside, immediate resistance is seen at 182.13, followed by the 20-period SMA at 182.17. Asustained break above this cluster would open the way toward the next barrier at 182.69 before the broader 100-period SMA near 184.70.
On the downside, initial support aligns at 181.76, ahead of a lower horizontal floor at 181.30 where the cross found support early in the American session on Friday. A decisive breach there would reinforce the bearish bias and expose deeper retracement levels in the coming sessions.
GBP/JPY recovers 200-day SMA after sliding to 211.47.
Upside remains capped by 100- and 50-day SMA resistance.
Break below 211.91 exposes 211.00 and 209.58 support.
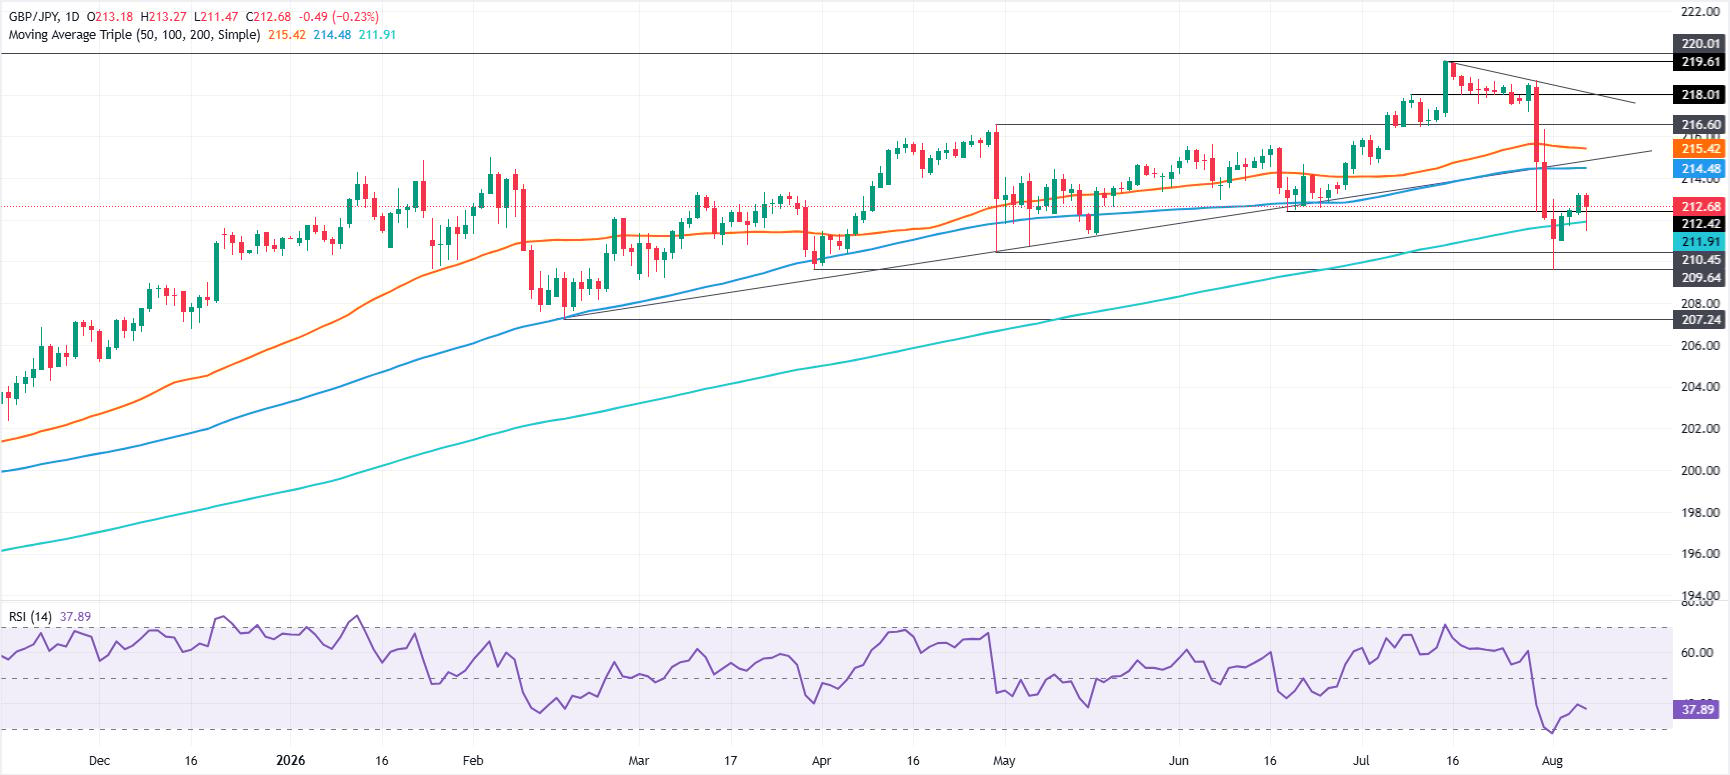
The British Pound retreats against the Japanese Yen, down about 0.24%, as the Yen is poised to end the week on a higher note. However, GBP/JPY is poised to finish the week with minimal gains, trading at 212.64.
GBP/JPY Price Forecast: Technical outlook
The GBP/JPY trades sideways, though slightly tilted to the downside, following an intervention in the FX markets by US and Japanese authorities. Worth noting that after soft US jobs data, Japanese Finance Minister Katayama said she agreed with US Treasury Secretary Scott Bessent that FX markets had been affected by moves rather than fundamentals.
This pushed GBP/JPY to the day’s low of 211.47, slightly below the 200-day SMA of 211.91, but buyers reclaimed the latter and surpassed 212.00. After the rebound, the cross is about to end Friday’s session near the highs, but it will face key resistance at the 100-day SMA at 214.48, followed by the 50-day SMA at 215.42.
In the event of further losses, the first GBP/JPY support is 212.00. Below the next support is the 200-day SMA at 211.91, followed by 211.00. Beneath emerges the August 3 low of 209.58.
Negotiations between Iran, the US, and GCC states on access to the Strait of Hormuz will continue to set energy prices and interest rate outlooks for the global economy. In the meantime, updates on the AI trade, which is undergoing heightened volatility, will feature earnings from Applied Materials, Cisco, and CoreWeave. The US will publish consumer inflation data as both the FOMC and financial markets are split on the Fed’s rate decision next month. The US will also post the PPI, retail sales, and the Michigan Consumer Confidence Index. In Europe, the UK and Switzerland will post Q2 GDP figures, while the Eurozone will publish industrial production data. In Asia, Chinese monetary aggregates will be in focus, while Taiwan’s GDP will unveil concrete figures on global chip production. Also, China and India will post inflation rates. For G10 monetary policy, rate decisions are due in Australia and Norway, while the BoJ will post July’s Summary of Opinions.
The Indian Rupee trades slightly lower at around 95.27 against the US Dollar as the US NFP takes center stage.
Weak US ADP Employment Change data has set a negative tone for the US NFP.
Oil prices bounce back amid fears of escalation in internal Middle East war.
The Indian Rupee (INR) falls slightly against the US Dollar (USD) on Friday in the countdown to the United States (US) Nonfarm Payrolls (NFP) data for July at 06:00 PM IST or 12:30 GMT. The USD/INR pair rises to near 95.27, with investors awaiting the US NFP to get cues regarding the current status of the labor market.
Ahead of the US NFP, weak ADP Employment Change data for July has established a cautious backdrop for the official employment data.
ADP slowdown reinforces expectations for softer US payrolls
According to TD Securities, July ADP employment data “surprised to the downside, moderating to 44k (TD: 50k, cons: 65k).” While the bank stresses that it does “not put much weight on ADP when it comes to m/m moves in NFP,” it notes that “the trend in the data is in line with what we are expecting.” TD highlights that “both the monthly and weekly ADP data have moderated this summer after a strong start to the year,” and suggests that “a similar trend is likely to occur with NFP job gains.”
According to NFP estimates, the US economy created 80K fresh jobs, higher than 57K in June. The Unemployment Rate is seen as steady at 4.2%. Average Hourly Earnings, a key measure of wage growth, is expected to have grown at a steady pace of 0.3% and 3.5% on a monthly and yearly basis, respectively.
The wage growth measure, which provides cues about the inflation outlook, could prove to be a major driver for the US Dollar’s next move, compared to the job data, as policymakers signaled in July’s Fed monetary policy statement that they are increasingly concerned about inflation remaining well above the 2% target. Also, Chairman Kevin Warsh said that the central bank “won’t hesitate to act” if needed to tame elevated price pressures.
Currently, the CME FedWatch tool shows a 54.5% chance that the Fed will raise interest rates in the September policy meeting.
Oil prices recover on internal Middle East conflicts risk
Oil prices have regained ground after a significant plunge in the last two weeks. Rising friction between Iran-aligned Houthis and Saudi Arabia has increased risks of internal war in the Middle East at a time when Iran and the US have just reached a temporary ceasefire, and has promoted fears of a prolonged energy supply disruption.
According to a report from The Guardian, Saudi Arabia is stepping up its attacks on Houthis in retaliation for striking Yemeni government troops and Najran province.
At press time, the MCX Crude Oil contract expiring on August 19 trades 1.13% higher at around Rs. 7,460.
Currencies from economies, such as India, which rely heavily on oil imports to meet their energy needs, tend to underperform in a high-oil-price environment.
Technical Analysis: USD/INR aims to return to 20-day EMA
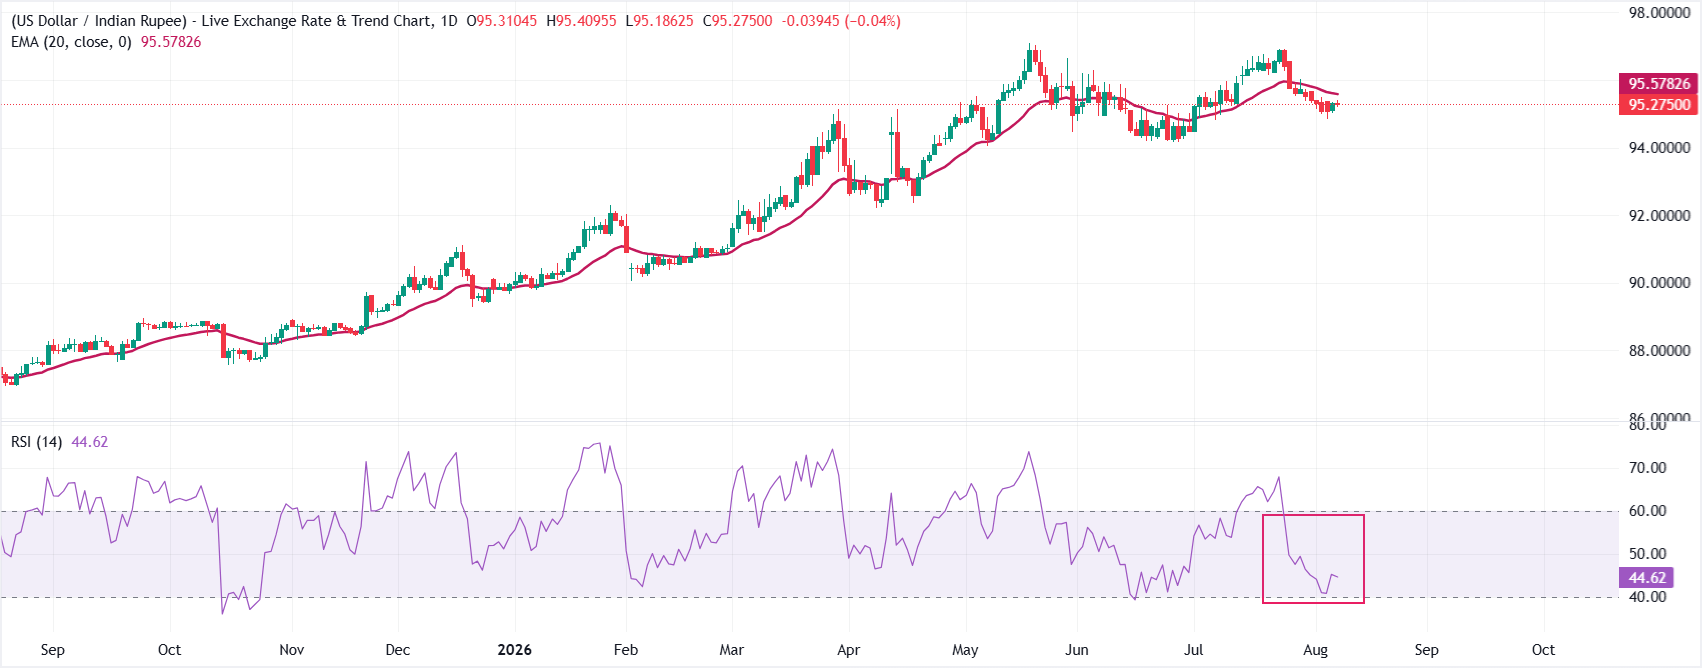
USD/INR trades at around 95.27, retaining a mildly bearish near-term bias as spot holds below the 20-day exponential moving average (EMA) at 95.57.
The pair’s failure to reclaim this dynamic resistance hints at continued downside risk, while the Relative Strength Index (RSI) at 44.6 sits in neutral territory, suggesting selling pressure is present but not yet stretched into oversold conditions.
On the topside, the 20-day EMA at 95.57 is the first barrier that bulls would need to clear to ease the current downward tone and open the way for a more sustained recovery. Looking down, the Wednesday low at 94.83 is the key support level, followed by the June low at 94.15.
To provide the best experiences, we use technologies like cookies to store and/or access device information. Consenting to these technologies will allow us to process data such as browsing behavior or unique IDs on this site. Not consenting or withdrawing consent, may adversely affect certain features and functions.
Functional
Always active
The technical storage or access is strictly necessary for the legitimate purpose of enabling the use of a specific service explicitly requested by the subscriber or user, or for the sole purpose of carrying out the transmission of a communication over an electronic communications network.
Preferences
The technical storage or access is necessary for the legitimate purpose of storing preferences that are not requested by the subscriber or user.
Statistics
The technical storage or access that is used exclusively for statistical purposes.The technical storage or access that is used exclusively for anonymous statistical purposes. Without a subpoena, voluntary compliance on the part of your Internet Service Provider, or additional records from a third party, information stored or retrieved for this purpose alone cannot usually be used to identify you.
Marketing
The technical storage or access is required to create user profiles to send advertising, or to track the user on a website or across several websites for similar marketing purposes.