

The New Zealand dollar remained at a six-week high, hovering around $0.584, as the prospect of additional rate hikes at home helped offset a broader risk-off move amid escalating US-Iran tensions. The Reserve Bank of New Zealand is widely expected to raise interest rates again in September, with the OCR projected to reach at least 3.0% by the end of the year. Earlier this week, RBNZ Chief Economist Paul Conway warned that renewed hostilities in the Middle East could reignite inflationary pressures, potentially prompting the central bank to tighten policy further after last week’s first hike in more than three years. Meanwhile, the US dollar rebounded from a near one-month low after the latest data pointed to continued resilience in the US economy, capping further gains in the kiwi. For the week, the currency rose more than 1%, marking its third straight week of gains.

Korean Won Pauses Gains on Oil Rally
The South Korean won hovered around 1,480 per dollar, pausing recent gains after climbing to its strongest level since mid-May, as escalating US-Iran tensions fueled a rally in oil prices and dampened risk sentiment. Brent crude rose above $85 per barrel, heading for its biggest weekly gain since April after renewed US strikes on Iran and attacks near the country’s main oil export terminal heightened concerns over supply disruptions. Earlier this week, the central bank lifted its benchmark interest rate by 25 basis points to 2.75%, as widely expected, marking its first increase since early 2023 as policymakers sought to curb persistent inflation and support the currency following months of depreciation. The move signaled the start of a new tightening cycle, though the currency’s gains were capped by cautious market sentiment amid renewed volatility in technology shares and rising geopolitical tensions.

GBP weakens below 1.3500 as US launches new wave of strikes against Iran
- GBP/USD softens to near 1.3470 in Friday’s Asian session.
- The US launched a new wave of strikes against Iran for a sixth day in a row.
- Traders still ramp up their bets on BoE rate hikes this year.
The GBP/USD pair trades on a softer note around 1.3470 during the Asian trading hours on Friday. Geopolitical tensions in the Middle East trigger risk-off market sentiment and weigh on the Cable. The preliminary reading of the Michigan Consumer Sentiment Index for July is due later on Friday.
The United States (US) has carried out major strikes on Iran for the sixth day in a row. Officials in southern Iran’s Bandar Abbas reported that civilian infrastructure, including power facilities and a train station, has been hit.
The US Central Command (CENTCOM) said that the attacks were intended to “further degrade Iranian military capabilities” before saying it had boarded a vessel as part of its blockade of the strait. Earlier this week, US President Donald Trump threatened to strike Iran’s bridges and power plants if the country did not return to talks. Rising tensions in the Middle East could boost a safe-haven currency such as the US Dollar (USD) against the British Pound (GBP).
Data released on Tuesday showed that US Consumer Price Index (CPI) inflation slowed in June, while data from Wednesday showed a decline in the Producer Price Index (PPI). Traders are now pricing in nearly a 55% chance that the Federal Reserve (Fed) will hike rates in September, according to the CME FedWatch Tool.
On the UK front, Bank of England (BoE) Governor Andrew Bailey said on Tuesday that he was concerned about the resumption of hostilities between the US and Iran in recent days, but so far, there has been no big impact on the UK inflation outlook. Money markets are fully pricing in a BoE hike by the November policy meeting, with a second rate hike priced in by April 2027, according to Reuters.

AUD moves away from three-week top as geopolitics and Fed hike bets lift USD
- AUD/USD attracts some sellers for the second straight day amid a modest USD uptick.
- Escalating US-Iran tensions, reviving inflation fears, and Fed hike bets underpin the buck.
- The RBA’s relatively hawkish stance and steady data from China could support the AUD.
The AUD/USD pair remains on the back foot for the second straight day and slides to the 0.7980 region during the Asian session on Friday. Nevertheless, spot prices seem poised to register gains for the third week in a row and remain within striking distance of a nearly three-week high, touched on Wednesday.
The US Dollar (USD) looks to build on the previous day’s goodish recovery from a nearly one-month low amid a combination of supporting factors and exerts some downward pressure on the AUD/USD pair. Further escalation of tensions between the US and Iran keeps geopolitical risk in play. Furthermore, concerns about energy-driven inflation revive bets for a US Federal Reserve (Fed) rate hike in 2026 and underpin the safe-haven Greenback.
In the latest developments surrounding the Middle East crisis, the US stepped up its attacks on Thursday and carried out a sixth consecutive night of air strikes against Iran. The US also struck an empty oil tanker headed for Kharg Island as part of its renewed naval blockade of Iranian ports. Tehran responded by attacking US military facilities across the region, raising fears of a return to all-out war and triggering the global flight to safety.
Iran’s Islamic Revolutionary Guard Corps had threatened to expand the conflict by targeting additional regional energy supply routes. Furthermore, Reuters reported that Iran has asked Yemen’s Houthis to stand ready to close the Red Sea oil route, posing a potent new threat to global energy supplies. This remains supportive of elevated crude oil prices, fueling inflation fears and bolstering bets for at least one Fed rate hike by the year-end.
Market expectations were reaffirmed by Thursday’s upbeat US Initial Jobless Claims data and the Philly Fed Manufacturing Index. Adding to this, Dallas Fed President Lorie Logan called on Thursday for modestly higher interest rates to win a battle the central bank has been losing for the past five years. Separately, Fed Vice Chair Philip Jefferson said that he would be open to raising rates if inflation does not show near-term improvement.
The aforementioned fundamental backdrop favors the USD bulls and backs the case for a further depreciating move for the AUD/USD pair. However, the Reserve Bank of Australia’s (RBA) relatively hawkish stance, along with steady economic data from China, could lend support to the China-proxy Australian Dollar (AUD), warranting caution before placing aggressive bearish bets on the currency pair and positioning for deeper losses.
US Dollar Price Today
The table below shows the percentage change of US Dollar (USD) against listed major currencies today. US Dollar was the strongest against the Australian Dollar.
| USD | EUR | GBP | JPY | CAD | AUD | NZD | CHF | |
|---|---|---|---|---|---|---|---|---|
| USD | 0.00% | 0.07% | 0.03% | -0.04% | 0.17% | 0.09% | 0.00% | |
| EUR | -0.01% | 0.07% | 0.00% | -0.07% | 0.17% | 0.09% | -0.01% | |
| GBP | -0.07% | -0.07% | -0.09% | -0.14% | 0.09% | 0.03% | -0.08% | |
| JPY | -0.03% | 0.00% | 0.09% | -0.06% | 0.16% | 0.06% | -0.01% | |
| CAD | 0.04% | 0.07% | 0.14% | 0.06% | 0.22% | 0.14% | 0.04% | |
| AUD | -0.17% | -0.17% | -0.09% | -0.16% | -0.22% | -0.09% | -0.18% | |
| NZD | -0.09% | -0.09% | -0.03% | -0.06% | -0.14% | 0.09% | -0.09% | |
| CHF | -0.00% | 0.01% | 0.08% | 0.01% | -0.04% | 0.18% | 0.09% |
The heat map shows percentage changes of major currencies against each other. The base currency is picked from the left column, while the quote currency is picked from the top row. For example, if you pick the US Dollar from the left column and move along the horizontal line to the Japanese Yen, the percentage change displayed in the box will represent USD (base)/JPY (quote).

Japanese Yen softens on renewed US-Iran tensions, Japan flags intervention risk
- USD/JPY trades with mild gains around 162.40 in Friday’s Asian session.
- The US is carrying out major strikes on Iran for the sixth consecutive day, lifting the US Dollar.
- Japan’s Katayama said authorities are ready to act on currency moves whenever necessary.
The USD/JPY pair posts modest gains near 162.40 during the Asian trading hours on Friday. The US Dollar (USD) strengthens against the Japanese Yen (JPY) as the United States (US) launches a new wave of strikes against Iran for a sixth night in a row. Traders will keep an eye on the preliminary reading of the Michigan Consumer Sentiment Index for July later on Friday.
The US Central Command (CENTCOM) said on Thursday that it launched a new wave of strikes against Iran for a sixth night in a row, per the BBC. The US military said that the attacks were intended to “further degrade Iranian military capabilities” before saying it had boarded a vessel as part of its blockade of the Strait of Hormuz.
Iran’s state media reported US missiles struck close to the island of Qeshm, near the strait, as well as in Bandar Abbas and Bushehr, the site of a nuclear power plant. Earlier this week, US President Donald Trump threatened to strike Iran’s bridges and power plants if the country did not return to talks. Renewed Hormuz hostilities could boost the Greenback against the JPY in the near term.
Kyodo News Agency reported on Friday that the Japanese government will state in its economic blueprint that decisions on specific monetary policy tools should be left to the Bank of Japan (BoJ). A final version of the blueprint will also state that the government will reach a decision “by early August” on whether and by how much Japan will cut 8% consumption tax levied on food.
Traders remain on alert for possible intervention from Japanese officials. Japan’s Finance Minister Satsuki Katayama said on Friday that the authorities are ready to act on currency moves whenever necessary.

Chinese Yuan loses as safe-haven demand lifts US Dollar
- USD/CNH climbs as rising Middle East tensions drive investors toward the US Dollar as a safe-haven asset.
- Iran told Houthi rebels to block the Red Sea oil route if the US attacks Iranian infrastructure.
- Economists and an adviser say China can stabilize growth by fast-tracking already-budgeted national infrastructure projects this year.
USD/CNH gains ground for the second successive day, trading around 6.7760 during the Asian hours on Friday. The pair appreciates as the US Dollar (USD) receives support from escalating developments surrounding conflicts in the Middle East.
Reuters reported on Thursday that Iran has instructed Yemen’s Houthi militia to stand ready to close the critical Red Sea oil route if the United States strikes Iranian power infrastructure, presenting a potent new threat to global energy supplies. Amplifying these concerns, the Tasnim news agency reported explosions in Bandar Abbas, Qeshm, and Ahvaz, while very loud explosions were also heard in Kuwait and as far away as Basra.
These geopolitical flare-ups follow threats made earlier this week by US President Donald Trump, who stated the US would strike Iran’s bridges and power plants next week if the country does not return to the negotiating table. Ultimately, these signs of escalating tensions in the Middle East could boost safe-haven currencies like the US Dollar, potentially creating a strong tailwind for the USD/CNH pair in the near term.
China can stabilize its economic growth this year by fast-tracking already-budgeted national infrastructure projects, according to economists and a government adviser. This approach reduces the likelihood of large-scale fiscal stimulus. The strategy allows Beijing to counter an unexpected, broad decline in investment—which recent data showed has dragged down growth—while maintaining strict control over local government spending, per Reuters.

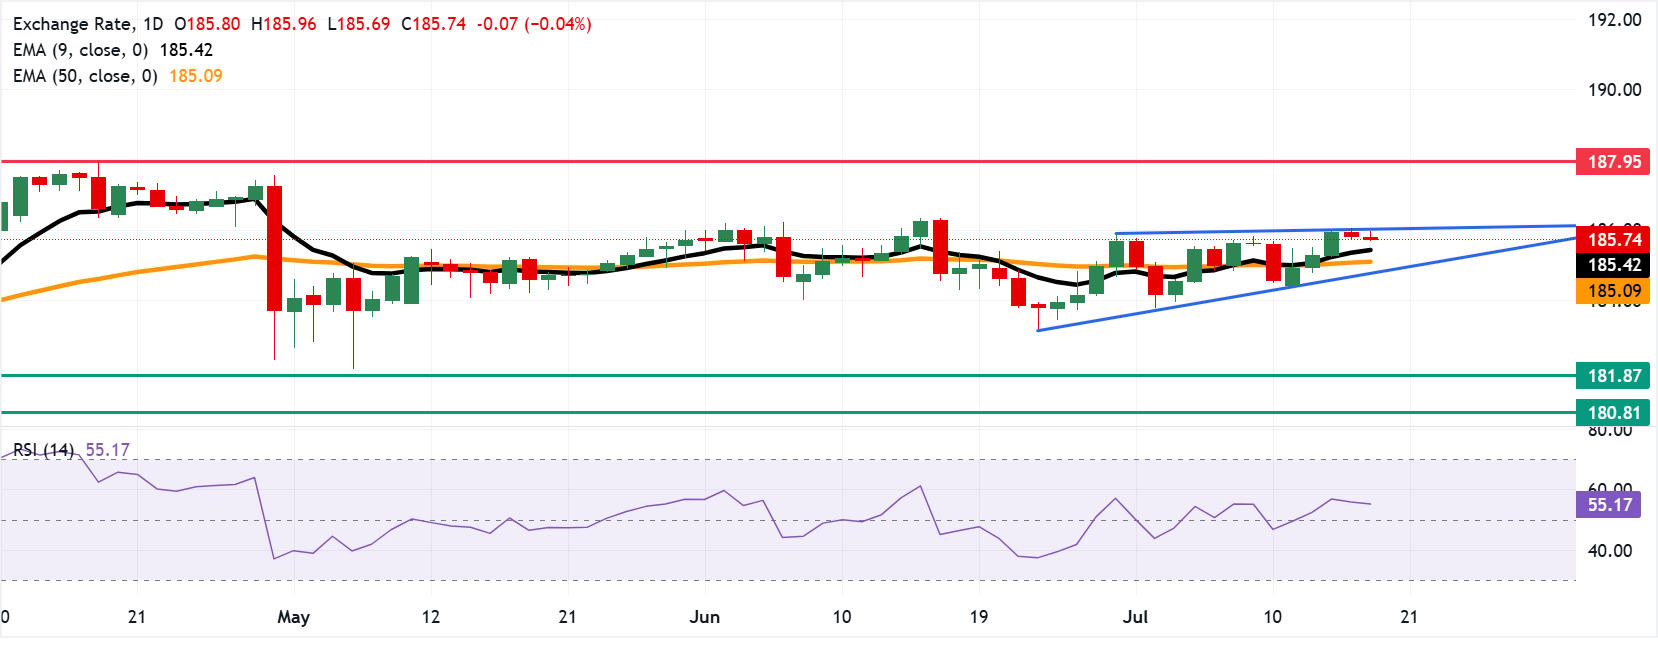
EUR/JPY Price Remains below ascending triangle top near 186.00
- EUR/JPY may find immediate resistance at the ascending triangle top near 186.00.
- The 14-day Relative Strength Index is at 55.17, indicating steady, sustainable bullish momentum.
- The currency cross could find the initial support at the nine-day EMA at 185.42.
EUR/JPY extends its losses for the second consecutive day, trading around 185.70 during the Asian hours on Friday. The currency cross is holding above both the nine-period and 50-period Exponential Moving Averages (EMAs), which reinforces a constructive near-term bias. The 14-day Relative Strength Index (RSI) sits at 55.17, neutral-to-positive territory, suggesting steady bullish momentum rather than an overstretched rally.
The daily chart technical analysis shows the EUR/JPY cross is pressing against ascending triangle resistance near 186.00. This flat ceiling, combined with shallower dips, signals aggressive buying pressure. Because bulls are consistently absorbing the supply at this level, momentum is heavily building for an imminent upside breakout. A decisive daily close above this upper boundary typically triggers a powerful bullish continuation, which could expose the all-time high of 187.95, which was recorded on April 17.
On the downside, primary support lies at the nine-day EMA at 185.42, followed by the 50-day EMA at 185.09. Further declines would put downward pressure on the EUR/JPY cross to test the ascending triangle’s lower boundary around 184.80. A break below the triangle would expose the four-month low of 181.87, recorded on March 16, and the six-month low of 180.81.
Euro Price Today
The table below shows the percentage change of Euro (EUR) against listed major currencies today. Euro was the weakest against the Canadian Dollar.
| USD | EUR | GBP | JPY | CAD | AUD | NZD | CHF | |
|---|---|---|---|---|---|---|---|---|
| USD | 0.02% | 0.06% | 0.00% | -0.04% | 0.12% | 0.04% | 0.00% | |
| EUR | -0.02% | 0.06% | -0.04% | -0.09% | 0.13% | 0.03% | -0.02% | |
| GBP | -0.06% | -0.06% | -0.09% | -0.14% | 0.06% | -0.02% | -0.08% | |
| JPY | 0.00% | 0.04% | 0.09% | -0.03% | 0.15% | 0.04% | 0.01% | |
| CAD | 0.04% | 0.09% | 0.14% | 0.03% | 0.19% | 0.09% | 0.05% | |
| AUD | -0.12% | -0.13% | -0.06% | -0.15% | -0.19% | -0.11% | -0.14% | |
| NZD | -0.04% | -0.03% | 0.02% | -0.04% | -0.09% | 0.11% | -0.04% | |
| CHF | -0.00% | 0.02% | 0.08% | -0.01% | -0.05% | 0.14% | 0.04% |
The heat map shows percentage changes of major currencies against each other. The base currency is picked from the left column, while the quote currency is picked from the top row. For example, if you pick the Euro from the left column and move along the horizontal line to the US Dollar, the percentage change displayed in the box will represent EUR (base)/USD (quote).

Trade of The Day – GBP/AUD
Facts: GBPAUD is trading above the 100-period moving average from D1 interval The pair broke above the resistance at 1.9190 The pair invalidated 1:1 structure
Recommendation: Trade: Long position on GBPAUD at market price Target: 1.9735, 2.0000 Stop: 1.9140
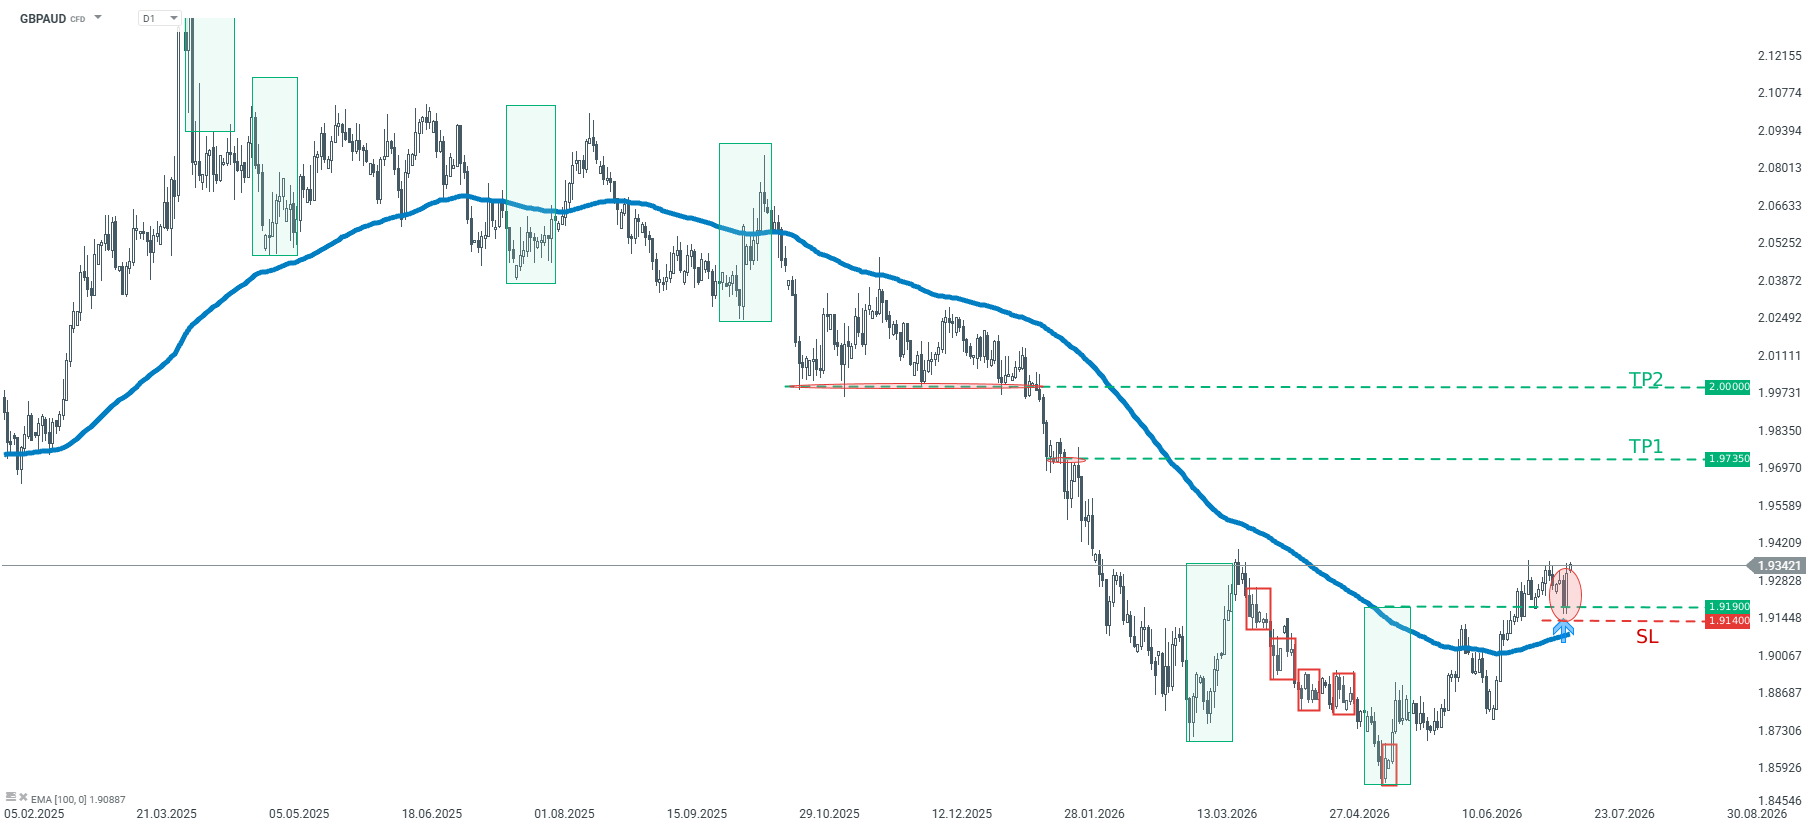
Opinion: GBPAUD has been trading in a downward trend since April 2025, but the pair may be experiencing a trend reversal. Looking at the pair at the D1 interval, one can see that the price broke above the upper limit of the 1:1 structure which, according to the Overbalance strategy, may herald a resumption of an upward trend. As long as the price sits above 1.9190, the further upward move is the base case scenario. We recommend going long GBPAUD at market price with two targets: 1.9735 and 2.0000. We also recommend placing a stop loss at 1.9140. Source: xStation5
