
Currency Hedger No Comments

EUR/JPY Price Forecast: Holds losses near 182.50 as bearish bias prevails

  • EUR/JPY could find initial support at the eight-month low of 179.37.
  • The 14-day Relative Strength Index near 39 indicates weak momentum.
  • The initial barrier lies at the nine-day EMA of 183.09.

EUR/JPY halts its three-day winning streak, trading around 182.50 during the early European hours on Friday. The currency cross is retaining a bearish near-term bias as spot holds below both the nine-period and 50-period Exponential Moving Averages (EMAs).

The short- and medium-term moving averages now act as layered overhead resistance, hinting at a capped tone while the 14-day Relative Strength Index (RSI) Indicator around 39 suggests weak momentum rather than outright oversold conditions.

Yen under scrutiny as Japan and US officials push back on weakness

Analysts at Scotiabank highlight that “officials (both Japanese and US) remain concerned about the level and path of the Yen, and have been determined to push back on recent weakness.” This ongoing vigilance underscores the degree of discomfort with the current USD/JPY trajectory and reinforces the sense that policymakers are closely monitoring the currencyโ€™s performance as it drifts back toward post-intervention lows.

Further intervention to support the Japanese Yen (JPY) would put downward pressure on the EUR/JPY cross to navigate the region around the eight-month low of 179.37, reached on August 3, followed by the nine-month low of 175.70.

On the upside, the EUR/JPY cross could find initial resistance at the nine-day EMA of 183.09, followed by the 50-day EMA at 184.63. Further advances above these moving averages would cause a bullish emergence and support the currency cross to explore the region around the all-time high of 187.95, which was recorded on April 17.

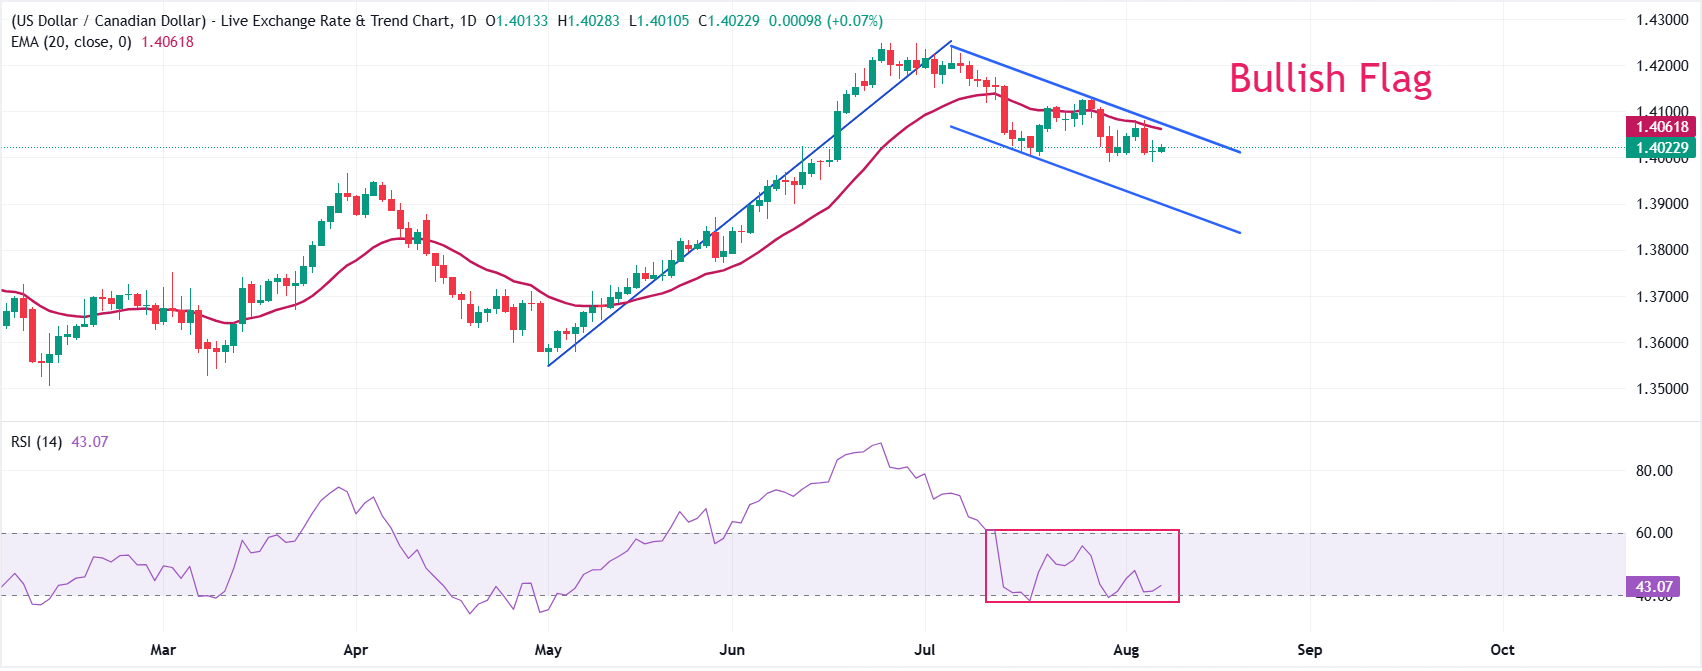
Chart Analysis EUR/JPY
EUR/JPY: Daily Chart

Currency Hedger No Comments

USD/CAD Price: Bullish Flag pattern underway

  • The USD/CAD pair ticks higher to near 1.4023 ahead of US-Canada employment data.
  • The Fed is expected to hike interest rates at the September meeting.
  • A bullish flag pattern is in the making, suggesting that the overall trend is still bullish.

The Canadian Dollar (CAD) trades marginally lower against the US Dollar (USD) on Friday, with the USD/CAD pair edging up to near 1.4023 in the European trading session. The Loonie pair is expected to trade sideways as investors await the labor market data for July from both the United States (US) and Canada.

Investors will pay close attention to both datasets to get fresh cues regarding the Federal Reserve (Fed) and the Bank of Canadaโ€™s (BoC) monetary policy outlook.

US jobs report in focus as Danske Bank sees solid labor backdrop

Analysts at Danske Bank highlight that โ€œthe most important data release will be the US July Jobs Report,โ€ where they โ€œforecast nonfarm payrolls at +70k, the unemployment rate unchanged at 4.2%, and average hourly earnings at +0.3% m/m s.a.โ€ The bank notes that โ€œmost leading data still point towards solid labour market conditions, although weak labour supply growth also weighs on the employment growth outlook,โ€ adding that โ€œthe unemployment rate remains the Fed’s primary focus.โ€

The CME FedWatch tool shows a 54.5% chance that the Fed will raise interest rates in the September policy meeting.

Meanwhile, the Canadian labor market report is expected to show that the economy created 15K fresh jobs, slightly lower than 18.2K in June. The Unemployment Rate is seen as steady at 6.5%.

USD/CAD Technical Analysis

USD/CAD trades at 1.4023, retaining a bearish near-term bias as price holds below the 20-period Exponential Moving Average (EMA) at 1.4062. However, the formation of a Bullish Flag chart pattern suggests that the overall trend is still bullish.

The Relative Strength Index (RSI) at 43.1 sits just under neutral, hinting at subdued downside momentum rather than outright oversold conditions.

On the topside, immediate resistance is clustered between the 20-period EMA at 1.4062 and the channel top at 1.4076; a decisive break above that zone would open the way for an upside move towards 1.4200. On the downside, the lower boundary of the Bullish Flag channel at around 1.3902 will be the key support level.

Currency Hedger No Comments

Euro flatlines amid mixed German data with all eyes on US Nonfarm Payrolls

  • EUR/USD trades flat around the 1.1520 area after pulling back from highs near 1.1560
  • German Industrial Production increased in June, but the trade surplus narrowed beyond expectations.
  • The US Dollar ticks up on hopes of Fed tightening and doubts about an upcoming peace deal in Iran

The Euro (EUR) is trading flat around 1.1520 against the US Dollar (USD) on Friday, following a mild pullback from three-week highs at 1.1560 and on track for a minor weekly decline. The US Dollar is showing a moderately stronger tone although investors remain wary of placing large directional bets, awaiting the release of July’s Nonfarm Payrolls (NFP) report, due later on the day.

Data released by the German Federal Office of Statistics on Friday revealed that Industrial Production rose 0.2% in June, down from May’s 0.7% increase, but above the 0.1% market consensus. At the same time, German Trade Balance data showed that June’s surplus narrowed to EUR 15.4 billion from an upwardly revised EUR 19.4 billion surplus in May, well beyond the EUR 17.4 billion surplus expected by the market.

Hopes of a peace deal in Iran fade

The safe-haven US Dollar is drawing support from growing doubts about a peace deal in Iran and the reopening of the Strait of Hormuz. Iranian Fars news agency reported on Thursday that Tehran would be considering a plan to ban Israeli and US vessels from the Strait, an idea which collides with the US will to keep the waterway free of tolls or restrictions of any sort,

Apart from that, the Financial Times, citing sources close to the US Federal Reserve, reported that Chairman Kevin Warsh is ready to hike interest rates as soon as September, if inflation remains persistently high, which provided additional support to the Greenback

This news heightens investorsโ€™ interest in Fridayโ€™s Nonfarm Payrolls report. Analysts at TD Securities, however, see the risks skewed to the downside. The bank argues that โ€œboth the monthly and weekly ADP data have moderated this summer after a strong start to the year,โ€ and they anticipate that โ€œa similar trend is likely to occur with NFP job gains.โ€

Currency Hedger No Comments

USD/JPY Price Consolidates near 158.55/38.2% Fibo. before the next leg up

  • USD/JPY is seen consolidating as traders opt to wait for the release of the US NFP report.
  • Bulls await a sustained move above the $38.2% Fibo. before positioning for further gains.
  • Any corrective pullback is likely to find decent support near 157.25, the 23.6% Fibo. level.

The USD/JPY pair extends the range play through the Asian session on Friday, stalling this week’s solid recovery from its lowest level since May, touched in the aftermath of a joint US-Japan intervention. Spot prices currently trade near the top end of the weekly range, around mid-158.00s, as traders keenly await the crucial US Nonfarm Payrolls (NFP) report for a fresh impetus.

In the meantime, persistent geopolitical uncertainties, reviving inflation fears, and bets for at least one interest rate hike by the US Federal Reserve (Fed) act as a tailwind for the US Dollar (USD). The Japanese Yen (JPY), on the other hand, remains depressed on the back of concerns about Japan’s worsening fiscal condition. Moreover, a fall in Japan’s Household Spending for the seventh straight month weakens the case for a Bank of Japan (BoJ) rate hike in September, further weighing on the JPY and acting as a tailwind for the USD/JPY pair.

From a technical perspective, spot prices keep a capped tone near the 38.2% Fibonacci retracement level of a sharp slide from a four-decade high, touched in July. Meanwhile, the Moving Average Convergence Divergence (MACD) now prints in positive territory, hinting at improving short-term momentum on the 4-hour chart. However, the Relative Strength Index (RSI) around 50 suggests a neutral, consolidative backdrop rather than a decisive trend shift, making it prudent to wait for a move beyond the current level before placing fresh bullish bets.

A further move up beyond the 38.2% Fibo., near 158.55, is likely to confront resistance at the 50.0% retracement at 159.61 and the 61.8% level at 160.66, where further rallies could stall. On the downside, initial support appears at the 23.6% retracement at 157.26, ahead of the structural floor near 155.17. A sustained break below 157.26 is likely to open the way for a deeper correction toward that lower zone.

USD/JPY 4-hour chart

Chart Analysis USD/JPY
Currency Hedger No Comments

The CHF weakens as increased risk aversion boosts safe-haven US Dollar

  • USD/CHF gains as escalating Middle East conflict fears drive global safe-haven demand toward USD.
  • Fed rate uncertainty emerges as rising oil prices and yields fuel inflation fears.
  • Cooling Swiss inflation to 0.4% leaves the Swiss National Bank likely keeping rates flat at 0%.

USD/CHF extends its gains for the second successive day, trading around 0.8130 during the Asian hours on Friday. The currency pair appreciates as the US Dollar (USD) gains strength, driven by renewed safe-haven demand amid escalating Middle East tensions.

Market stability has been rattled by growing skepticism regarding the reopening of the strategic Strait of Hormuz. Adding to the geopolitical strain, The Guardian reported that Saudi Arabia intends to extend military operations against Iran-aligned Houthis, in support of the internationally recognized Yemeni government, following attacks on its southern Najran province. Meanwhile, Iran’s parliament is evaluating a draft proposal to prohibit US and Israeli vessels, impose a 20% cargo penalty on hostile nations, and restrict the corridor until the US blockade is lifted.

Meanwhile, rising US Treasury yields and recovering crude oil prices have reignited fears that the Federal Reserve could implement another interest rate hike next month. Despite these inflationary signals, the CME FedWatch Tool currently reflects a 54.5% probability of a 25-basis-point rate increase in September, down from 63.4% last week. Investors and traders are now turning their attention to the upcoming July Nonfarm Payrolls (NFP) report to assess labor market health and gain clearer insights into the Fedโ€™s future monetary policy trajectory.

On the Swiss side, economic indicators present a mixed picture. Switzerlandโ€™s non-seasonally adjusted unemployment rate ticked up to 3.0% in July from 2.9% in June, while youth unemployment (ages 15โ€“24) edged up slightly to 2.8%. Markets will closely watch the release of the July Foreign Currency Reserves and Q3 SECO Consumer Climate data later in the day.

Franc under pressure as muted Swiss inflation keeps SNB on hold

Brown Brothers Harriman highlights that “Swiss July CPI stays muted,” with headline inflation running at just 0.4% year-on-year and core at 0.3% for a fourth consecutive month. With the SNB projecting only modest CPI averages and maintaining its policy rate at 0.00%, strategist Elias Haddad argues this subdued inflation backdrop is likely to keep the Swiss Franc on the defensive, noting it is currently the weakest G10 currency this quarter.

Technical Analysis: USD/CHF holds above nine-day EMA

In the daily chart, USD/CHF is maintaining a modest bullish near-term bias as it holds above both the nine-day and 50-day Exponential Moving Averages (EMAs). The configuration of short- and medium-term EMAs below price suggests a constructive backdrop, while the 14-day Relative Strength Index (RSI) near 54 reinforces a neutral-to-positive momentum tone rather than overbought conditions.

On the topside, immediate resistance appears at the horizontal barrier around the 13-month high of 0.8207. On the downside, initial support is offered by the nine-day EMA at 0.8111, followed by the 50-day EMA at 0.8056, with deeper structural floors seen at nearly a five-month low of 0.7762.

Chart Analysis USD/CHF
USD/CHF: Daily Chart
Currency Hedger No Comments

EUR weakens against USD amid Middle East tensions

  • EUR/USD depreciates as rising geopolitical tensions in the Strait of Hormuz disrupt global markets.
  • Market caution rises as Iran considers banning US and Israeli ships and penalizing hostile cargo until blockades lift.
  • Rebounding oil prices threaten expectations that falling energy costs would ease pressure on the ECB to cut rates.

EUR/USD extends its losses for the second consecutive day, trading around 1.1520 during the Asian hours on Friday. The currency pair faces downward pressure as the US Dollar (USD) gains strength, propelled by renewed safe-haven demand among global investors.

Escalating tensions in the Strait of Hormuz have rattled market stability and created significant skepticism regarding the reopening of this critical shipping route. Market caution remains elevated as Iran’s parliament evaluates a draft proposal that seeks to prohibit US and Israeli vessels, levy a 20% cargo penalty on hostile nations, and maintain restrictions on the corridor until the US blockade is removed.

Adding to the market volatility, rising US Treasury yields and a rebound in crude oil prices have stoked fears that the Federal Reserve might implement another interest rate hike next month. Despite these inflationary signals, the CME FedWatch Tool currently reflects a 54.5% probability of a 25-basis-point rate increase in September, down from 63.4% last week. Investors and traders are now closely eyeing the upcoming July Nonfarm Payrolls (NFP) report to gauge the health of the labor market and better anticipate the Fed’s monetary policy path.

Across the Atlantic, economic indicators in the Euro Area present a challenging backdrop. Eurozone Retail Sales unexpectedly contracted by 0.3% month-on-month in June, missing market projections for a 0.1% growth and almost completely unwinding May’s revised 0.4% gain. On an annual basis, Retail Sales rose by merely 0.7%, the weakest performance since July 2024, falling short of the expected 1.0% expansion and decelerating sharply from May’s 1.9% increase.

Furthermore, the recovery in oil prices could dampen hopes that declining energy costs would alleviate pressure on central banks to keep policy tight. Following the European Central Bank’s (ECB) decision to hold interest rates steady at its most recent meeting, markets expect only one more ECB rate hike by the end of the year, alongside a roughly 40% chance of a second increase.

Kocher flags autumn data focus as geopolitical risks cloud Euro inflation

ECB’s Kocher scores 5.6/10 on FXS Speechtracker, below the historic average of 6.3/10, pointing to a slightly less forceful tone than usual. The emphasis on how quickly geopolitical developments can alter energy prices and the inflation outlook highlights upside risks to Euro-area prices, which leans modestly hawkish despite the softer score.

The commitment that in autumn the ECB Governing Council will base decisions on incoming data to bring Euro-area inflation back to 2% on a sustainable basis reinforces a data-dependent but vigilant stance. Overall, the speech suggests a cautious hawkish bias, with Kocher keeping the door open to renewed tightening or a slower easing path if energy-driven inflation pressures re-emerge.

Currency Hedger No Comments

AUD bulls remains on the sidelines as Iran risks support USD ahead of US NFP

  • AUD/USD is seen consolidating on Friday as traders seem hesitant ahead of the US NFP report.
  • Geopolitical uncertainties and Fed hike bets underpin the USD, capping the upside for the pair.
  • Spot prices remain on track to end the week on a flattish note and look to the RBA next week.

The AUD/USD pair steadies around the 0.7030-0.7025 region during the Asian session on Friday as traders opt to wait for the release of the closely watched US monthly employment details before placing fresh directional bets. Nevertheless, spot prices, for now, seem to have stalled the previous day’s retracement slide from the highest level since June 17 and seem poised to end the week on a flattish note amid mixed cues.

The optimism over a potential US-Iran peace deal seems to have faded amid reports Iran is reviewing a plan โ€Œthat would ban US and Israeli vessels from the Strait of Hormuz. According to the initial draft published by Iranian state news agency Fars on Thursday, other nations that have harmed Iran would not be allowed to transit until compensation is paid. This, in turn, prompts traders to price in the geopolitical risk premium, which supports the safe-haven US Dollar (USD) and caps the AUD/USD pair.

Meanwhile, Iranโ€™s Houthi allies in Yemen struck a Saudi tanker in the Red Sea, fueling concerns about energy supply disruptions through another key route. This led to the overnight spike in crude oil prices and revives inflation fears, bolstering bets for a rate hike by the US Federal Reserve (Fed). The outlook remains supportive of elevated US Treasury bond yields, which is seen as another factor acting as a tailwind for the Greenback and keeping the AUD/USD pair depressed for the second consecutive day.

USD bulls, however, seem hesitant and look to the key US Nonfarm Payrolls (NFP) report for more cues about the Fed’s future policy path. The crucial data will play a key role in influencing the near-term USD price dynamics and provide some impetus to the AUD/USD pair. The market attention will then shift to the Reserve Bank of Australia (RBA) policy meeting next week. Apart from this, further developments surrounding the Middle East crisis would help in determining the near-term trajectory for the pair.

Analysts at Standard Chartered expect the RBA to leave the cash rate unchanged at 4.35% at its 11 August meeting, noting that โ€œQ2 trimmed mean inflation held steady at 0.8% q/q โ€“ as we had expected โ€“ and below the RBAโ€™s prior forecast (0.9%).โ€ They add that this outcome, โ€œtogether with the recent retracement in oil prices, should take the pressure off the RBA to tighten policy further in the near term.โ€

Against that backdrop, Standard Chartered says โ€œour base case remains that the RBA is done with rate hikes in the foreseeable future,โ€ although it cautions that โ€œthe risk to our view is skewed towards another RBA rate hike in Q4, if the central bank remains unconvinced that demand is slowing sufficiently to contain underlying price pressures.โ€

AUD/USD daily chart

Chart Analysis AUD/USD

Technical Analysis

The AUD/USD pair is consolidating between its key moving averages, holding above the 200-day Simple Moving Average (SMA) at 0.6923 while remaining capped by the 100-day SMA at 0.7052. This keeps the near-term bias neutral and hints at a range-bound tone rather than a directional breakout.

Currency Hedger No Comments

The NZD hangs near weekly low after China’s trade data as USD bulls await NFP

  • NZD/USD remains depressed for the second straight day as geopolitical risks underpin the USD.
  • Recovering oil prices revive inflation fears, bolstering Fed hike bets and also supporting the buck.
  • Chinaโ€™s trade data do little to provide any impetus to the Kiwi as the focus remains on the US NFP.

The NZD/USD pair sticks to a negative bias for the second consecutive day and trades near the lower end of its weekly range, around the 0.5865 region, during the Asian session on Friday. Spot prices move little following the release of China’s trade data as traders opt to wait for the crucial US monthly employment details.

In fact, China’s Trade Balance for June, in US Dollar (USD) terms, showed a surplus of $112.5 billion, higher than the $107.0 billion expected, but lower than the prior release of $125.62 billion. Additional details revealed that exports rose 23% YoY, compared to a 27% increase seen in June, while imports climbed 27.5% vs. 36% recorded previously. The data fails to provide any impetus to antipodean currencies, including the New Zealand Dollar (NZD), as geopolitical uncertainties continue to underpin the safe-haven US Dollar (USD) and weigh on the NZD/USD pair.

In fact, a Saudi official said that some Iraqi militia factions, in coordination with Yemen’s Iran-backed Houthis, are planning to attack the kingdom in the very near future, raising the risk of a wider regional conflict. This comes a day after Houthis claimed responsibility for an attack on a Saudi oil tanker in the Gulf of Aden. Furthermore, reports suggest that Iran is reviewing a plan โ€Œthat would ban US and Israeli vessels from the Strait of Hormuz. This led to the overnight rise in oil prices, fueling inflation fears and bolstering US Federal Reserve (Fed) rate hike bets.

Hawkish Fed expectations, in turn, remain supportive of elevated US Treasury bond yields and turn out to be another factor supporting the Greenback. USD bulls, however, seem hesitant to place aggressive bets and look to the crucial US Nonfarm Payrolls (NFP) report for more cues about the Fed’s future policy path. In the meantime, the Reserve Bank of New Zealand’s (RBNZ) hawkish tilt could support the Kiwi and help limit the downside for the NZD/USD pair, warranting some caution before positioning for any further intraday depreciating move.

NZD/USD daily chart

Chart Analysis NZD/USD

Technical Analysis

The NZD/USD pair holds above the 100-day Simple Moving Average (SMA) at 0.5823, suggesting that the underlying demand is still in place despite recent consolidation around the 0.5860 area. A daily close below this level, however, would hint at fading upside momentum and expose deeper retracements toward the mid-0.5700s, while holding above it keeps the door open for a continuation of the advance toward the 0.5900 handle over the coming sessions.