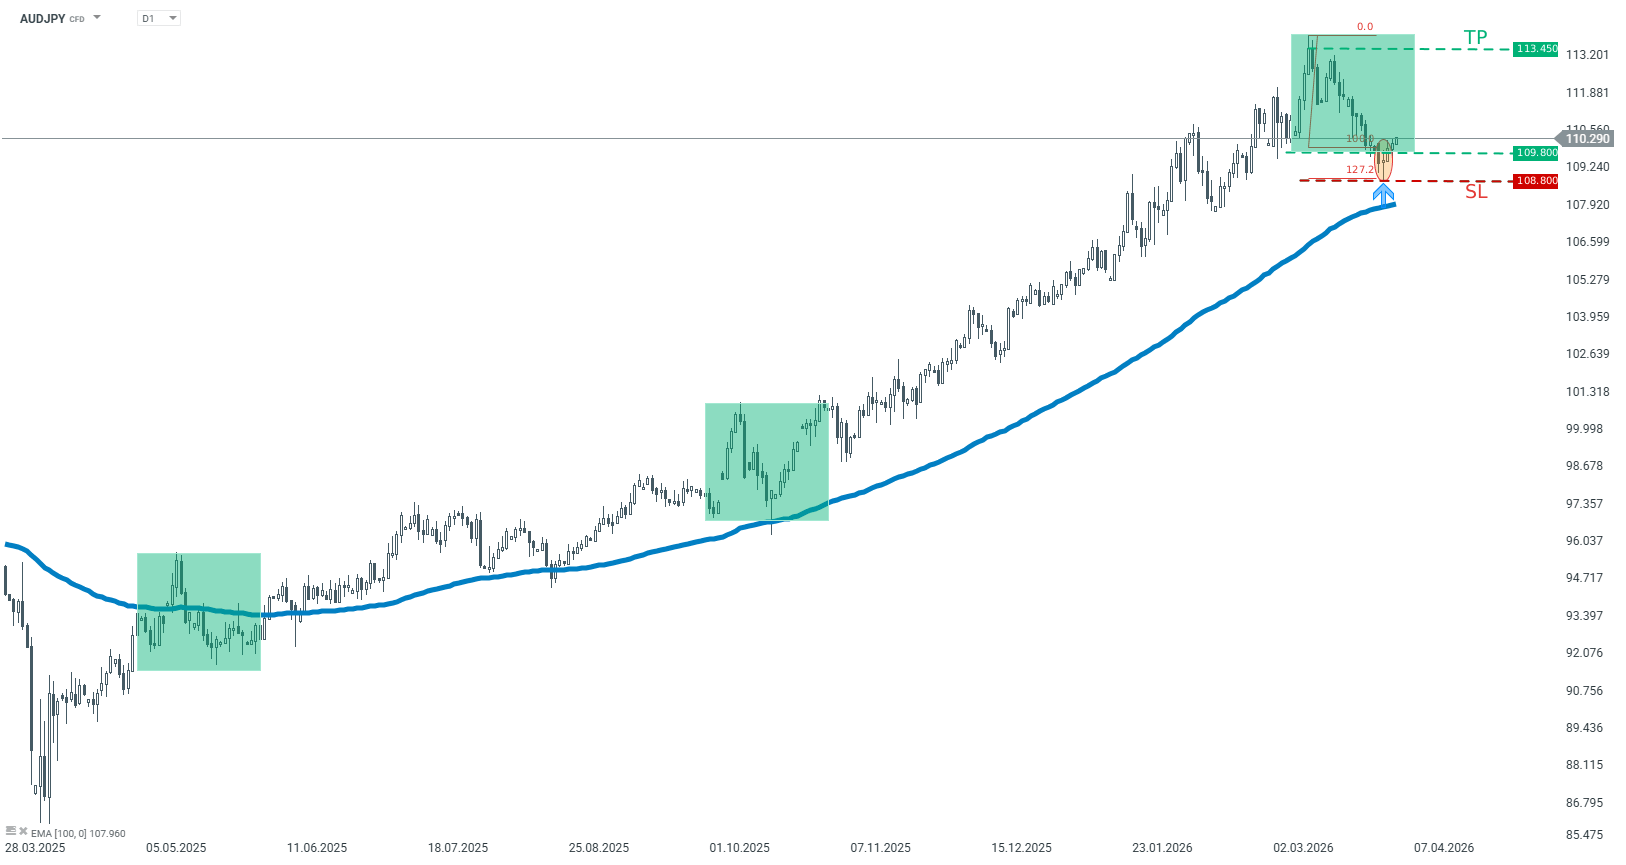
Facts: Pair bounced off the lower limit of the 1:1 structure at 109.80 The main sentiment remains bullish from April 2025
Recommendation: Trade: Long AUDJPY at market price Target: 113.45 Stop: 108.80
Opinion: Looking at the D1 interval on AUDJPY chart, one can see that the price bounced off the key support. The support is marked with the lower limit of 1:1 structure at 109.80. In addition, the price sits above the 100-period moving average from the D1 interval. Taking this into account, another upward impulse is the base case scenario. We recommend going long AUDJPY at market price with a target of 113.45. We also recommend placing a stop loss order at 108.80. Source: xStation5
EUR/GBP flatlines around 0.8720 on Friday after bouncing from 0.8700 support.
The pair has rallied nearly 1% over the last three weeks, despite the risk-off sentiment.
The Euro is likely to require an additional impulse to breach resistance at 0.8740.
EUR/GBP’s reversal from one-month highs at 0.8740 found support above 0.8700 earlier this week, before stalling halfway through the last few days’ range around 0.8720. Technical indicators show waning bullish momentum, while thinned market volumes suggest that further consolidation is the most likely outcome on Friday.
The Euro (EUR) remains on track for a nearly 0.5% weekly gain and is nearly 1% up over the last three weeks. The risk-averse sentiment stemming from the war in Iran has been weighing both currencies against the safe-haven US Dollar (USD). Still, the positive manufacturing activity and the moderate uptick in inflation seen in the Eurozone earlier this week have provided some support to the Euro (EUR), while UK manufacturing PMI failed to convince investors.
Technical Analysis
EUR/GBP’s near-term bias remains mildly bullish, although technical indicators point to a weakening momentum. The 4-hour Relative Strength Index at 58 stays above its midline, but the Moving Average Convergence Divergence (MACD) indicator slips marginally below the zero line, and the MACD line has crossed below the Signal line, which is a bearish sign.
Bears will have to breach Wednesday’s and Tuesday’s lows, at 0.8705 and 0.8676, respectively, to undermine the near-term bullish structure and expose the 0.8630-08635 area, which provided support to the pair on March 23, 24, and 26.
On the upside, bulls are likely to require additional impulse to break resistance at the 0.8740 area (March 3 and April 1 highs), and shift the focus to the key area between 0.8790 and 0.8800, which capped bulls several times in December and early March
Euro Price Today
The table below shows the percentage change of Euro (EUR) against listed major currencies today. Euro was the strongest against the New Zealand Dollar.
USD
EUR
GBP
JPY
CAD
AUD
NZD
CHF
USD
-0.02%
-0.11%
0.00%
0.01%
-0.12%
0.13%
-0.08%
EUR
0.02%
-0.06%
0.02%
0.03%
0.01%
0.13%
-0.06%
GBP
0.11%
0.06%
0.11%
0.08%
0.11%
0.20%
-0.00%
JPY
0.00%
-0.02%
-0.11%
0.00%
-0.01%
0.10%
-0.11%
CAD
-0.01%
-0.03%
-0.08%
-0.00%
-0.01%
0.12%
-0.09%
AUD
0.12%
-0.01%
-0.11%
0.01%
0.00%
0.12%
-0.09%
NZD
-0.13%
-0.13%
-0.20%
-0.10%
-0.12%
-0.12%
-0.21%
CHF
0.08%
0.06%
0.00%
0.11%
0.09%
0.09%
0.21%
The heat map shows percentage changes of major currencies against each other. The base currency is picked from the left column, while the quote currency is picked from the top row. For example, if you pick the Euro from the left column and move along the horizontal line to the US Dollar, the percentage change displayed in the box will represent EUR (base)/USD (quote).
EUR/JPY edges higher to near 184.15 in Friday’s early European session.
The positive outlook of the cross remains intact above the 100-day EMA, with bullish RSI momentum.
The initial support level is located at 183.50; the first upside barrier emerges at 184.80.
The EUR/JPY cross gathers strength around 184.15 during the early European session on Friday. Trading volumes are likely to be thin due to the Good Friday holiday. Meanwhile, hawkish remarks from European Central Bank (ECB) policymakers provide some support to the Euro (EUR) against the Japanese Yen (JPY). ECB Governing Council member Francois Villeroy de Galhau said on Thursday that the central bank’s next interest rate move will very likely be an increase, although it is still too early to say when it will start hiking.
On the other hand, escalations in the Middle East could boost a safe-haven demand, supporting the JPY. US President Donald Trump pressures Iran to make a deal after a military strike destroys a bridge near Tehran. Iran’s foreign minister Abbas Araghchi stated that Washington’s recent strikes on civilian infrastructure will not force the country to back down, adding that such actions “convey the defeat and moral collapse of an enemy in disarray.”
Technical Analysis:
In the daily chart, the near-term bias of EUR/JPY is mildly bullish as price holds above the rising 100-day exponential moving average near 182.10 and consolidates just under the upper Bollinger Band, indicating sustained upside pressure after the recent advance. The Bollinger middle band around 183.50 now tracks below spot and acts as dynamic trend support, while the latest RSI reading just above 54 confirms positive, but not overextended, momentum consistent with a grinding uptrend rather than a climax move.
Immediate support emerges at the 183.50 Bollinger middle band, followed by the 182.50–182.10 area where recent lows converge with the 100-day EMA. A break below this zone would weaken the bullish structure and expose deeper retracement toward 181.50. On the topside, initial resistance stands at the recent upper Bollinger Band region around 184.80, with a daily close above this threshold opening the door toward the 186.00 area where prior band highs cluster and upside risk would intensify.
USD/CHF trades sideways as activity stays muted amid subdued market participation due to the Good Friday holiday.
The US Dollar holds ground on safe-haven demand following recent Iran threats from President Trump.
Swiss inflation rose to 0.3% YoY in March, staying near the SNB’s lower target bound, easing pressure for policy changes.
USD/CHF remains steady after registering over 0.5% gains in the previous day, trading around 0.7980 during the Asian hours. The pair moves little as trading activity may remain subdued due to the Good Friday holiday.
The US Dollar (USD) holds firm against is major peers amid rising safe-haven demand following the recent Iran threats from the US President Donald Trump. US President Donald Trump offered no clarity on steps toward reopening the Strait of Hormuz, warning of intensified military action over the next two to three weeks and issuing strong threats against Iran. Iran’s Foreign Minister Abbas Araghchi responded that recent US strikes on civilian infrastructure would not force a retreat, describing them instead as evidence of an opponent in disarray and moral decline.
Chicago Fed President Austan Goolsbee shared his concern on Thursday over rising oil prices, noting they could complicate efforts to curb inflation, particularly if gasoline costs surge and lift inflation expectations.
Meanwhile, the Dallas Fed president supported the Federal Reserve holding rates steady at the latest FOMC meeting, noting the labor market has stabilized since late 2025, though payroll growth remains weak and “uncomfortable.”
Swiss inflation rose to 0.3% year-over-year (YoY) in March from 0.1%, below the 0.5% forecast but the highest in a year, reflecting rising energy costs linked to Middle East tensions. Price growth remains near the lower bound of the Swiss National Bank’s 0–2% target, reducing pressure for policy changes.
GBP/USD may fall toward the descending channel’s lower boundary around 1.3150.
The 14-day Relative Strength Index hovers in the low-40s, indicating weak and negative momentum.
The pair may find the primary resistance at the nine-day EMA of 1.3273.
GBP/USD holds gains after registering over 0.5% losses in the previous day, trading around 1.3230 during the Asian hours on Friday. The technical analysis of the daily chart indicates an ongoing bearish bias, as the pair remains within the descending channel pattern.
The near-term bias stays mildly bearish as the GBP/USD pair holds below both the nine-day and 50-day Exponential Moving Averages (EMAs), which cap rebounds and confirm a deteriorating short-term trend. Price action has made a sequence of lower highs and lower closes from the 1.35 area, reinforcing downside pressure.
Additionally, the latest 14-day Relative Strength Index (RSI) hovers in the low-40s, showing negative momentum but not yet oversold, which leaves room for further weakness while limiting the risk of an immediate exhaustion low.
The GBP/USD pair may find its primary support at the descending channel’s lower boundary around 1.3150. A break below the channel would expose the 1.3010, the lowest since April 2025, which was recorded in November 2025.
On the upside, the initial barrier lies at the nine-day EMA of 1.3273. Further advances would lead the GBP/USD pair to test the 50-day EMA at 1.3394, followed by the upper descending channel boundary around 1.3440. A sustained break above this confluence resistance would trigger a bullish bias, opening the doors for exploring the area around the 1.3869, the highest level since September 2021, reached on January 27.
GBP/USD: Daily Chart
(The technical analysis of this story was written with the help of an AI tool.)
Pound Sterling Price Today
The table below shows the percentage change of British Pound (GBP) against listed major currencies today. British Pound was the strongest against the New Zealand Dollar.
USD
EUR
GBP
JPY
CAD
AUD
NZD
CHF
USD
-0.00%
-0.11%
0.00%
0.00%
-0.13%
0.10%
-0.05%
EUR
0.00%
-0.07%
0.02%
0.00%
-0.01%
0.09%
-0.05%
GBP
0.11%
0.07%
0.11%
0.08%
0.08%
0.17%
0.02%
JPY
0.00%
-0.02%
-0.11%
-0.01%
-0.03%
0.07%
-0.09%
CAD
-0.01%
-0.01%
-0.08%
0.00%
-0.01%
0.09%
-0.06%
AUD
0.13%
0.01%
-0.08%
0.03%
0.01%
0.09%
-0.06%
NZD
-0.10%
-0.09%
-0.17%
-0.07%
-0.09%
-0.09%
-0.15%
CHF
0.05%
0.05%
-0.02%
0.09%
0.06%
0.06%
0.15%
The heat map shows percentage changes of major currencies against each other. The base currency is picked from the left column, while the quote currency is picked from the top row. For example, if you pick the British Pound from the left column and move along the horizontal line to the US Dollar, the percentage change displayed in the box will represent GBP (base)/USD (quote).
USD/CAD holds firm above 1.3900 on track for its third consecutive weekly gain.
Investors await the US Nonfarm Payrolls report amid holiday-thinned market volumes.
Canada’s trade deficit rose to a six-month high in February.
The US Dollar (USD) keeps the upper hand against its Canadian counterpart on Friday, trading near 1.3925 at the moment of writing, with the 1.3966 year-to-date high at a relatively short distance. The pair is on track for its third consecutive weekly rally, with the Canadian Dollar (CAD) weighed by the risk-off sentiment stemming from the Iran war.
Trading volumes are expected to remain low, with most markets closed on Friday for the Good Friday bank holiday. During the US session, however, the US Nonfarm Payrolls report is likely to attract significant interest and might trigger wild FX movements due to the limited liquidity conditions
US Payrolls are seen bouncing up in March
The market consensus anticipates US net employment to have increased by 60K in March àttyially offsetting the 92K decline posted in February. The positive ADP employment reading seen earlier this week and the strong US ISM Manufacturing Purchasing Managers’ Index (PMI) have contributed to boosting investors’ expectations about March’s payroll figures.
Meanwhile, the war in the Middle East continues, keeping investors’ appetite for risk subdued. The UN Security Council is expected to vote on a proposal by Bahrain authorizing countries to use “all defensive means necessary” to reopen the Strait of Hormuz, an initiative that has been rejected by veto-wielding Chinese representatives.
Data released on Thursday showed that Canada’s Merchandise Trade Balance deficit widened to a six-month high at CAD 5.74 billion i (USD 14.4 billion) in February, as imports increased 8.4% to an all-time high of CAD 72.05 billion, offsetting the 6.4% rise in exports.
Also on Thursday, the President of the Federal Reserve (Fed) of Chicago, Austan Goolsbee, warned that the recent surge in Oil prices might complicate the central bank’s rate-setting activity in a context ot a “low-hire, low-fire” labour market. The impact on the US Dollar, however, was minimal.
AUD/USD gathers strength around 0.6900 in Friday’s early European session.
Westpac analysts expect the RBA to increase the cash rate by 25 basis points in May, June and August 2026.
Traders brace for the US employment data for March later on Friday.
The AUD/USD pair gains ground near 0.6900 during the early European trading hours on Friday. Hawkish tone from the Reserve Bank of Australia (RBA) underpins the Australian Dollar (AUD) against the Greenback. Trading volumes are likely to be thin due to the Good Friday holiday. Traders will keep an eye on the US March jobs report later on Friday.
Market expectations for the May meeting lean toward another potential rate hike due to rising oil prices and a tight labor market. Westpac analysts expect the RBA to deliver three further rate hikes in 2026. This would take the cash rate to 4.85%, a level not seen since November 2008.
On the other hand, escalating conflict in the Middle East, including the effective closure of the Strait of Hormuz, could prompt traders to move into a safe-haven currency such as the US Dollar (USD). US President Donald Trump pressures Iran “to make a deal” after a military strike destroys a bridge near Tehran.
Iran’s foreign minister Abbas Araghchi stated that Washington’s recent strikes on civilian infrastructure will not force the country to back down, adding that such actions “convey the defeat and moral collapse of an enemy in disarray.”
The US employment data for March will be published on Friday. The Nonfarm Payrolls (NFP) are expected to show an increase of 60,000 jobs in March. Meanwhile, the Unemployment Rate is forecast to hold steady at 4.4% during the same period.
USD/JPY holds steady around 159.60 in Friday’s early Asian session.
Persistent tensions in the Middle East underpin the US Dollar, but US tariff threats might cap its upside.
BoJ authorities warned that they may adjust policy if Yen weakness persists.
The USD/JPY pair trades on a flat note near 159.60 during the Asian trading hours on Friday. Trading volumes are likely to be thin due to the Good Friday holiday. All eyes will be on the US March Nonfarm Payrolls (NFP) report, which will be published later on Friday.
Heightened geopolitical tensions in the Middle East drive up oil prices and lift the US Dollar (USD) against the Japanese Yen (JPY). US President Donald Trump pressures Iran to make a deal after a military strike destroys a bridge near Tehran. Meanwhile, Iran’s foreign minister, Abbas Araghchi, stated that Washington’s recent strikes on civilian infrastructure will not force the country to back down, adding that such actions “convey the defeat and moral collapse of an enemy in disarray.”
On the other hand, chaos around U.S. tariff policy might cap the upside for the Greenback. The Trump administration plans to slap up to 100% on certain imported medicines from companies that don’t reach deals with his administration in the coming months, per Bloomberg. A White House statement said that the new levy applies to patented drugs made in countries that lack tariff deals with the US by companies that don’t have most-favored-nation-pricing agreements with the administration.
Fears that Japanese authorities would step in to support the domestic currency could support the JPY and act as a headwind for the pair. Japan’s top currency diplomat, Atsushi Mimura, said on Monday that officials may need to take “decisive” steps if speculative moves persist in the currency market.
To provide the best experiences, we use technologies like cookies to store and/or access device information. Consenting to these technologies will allow us to process data such as browsing behavior or unique IDs on this site. Not consenting or withdrawing consent, may adversely affect certain features and functions.
Functional
Always active
The technical storage or access is strictly necessary for the legitimate purpose of enabling the use of a specific service explicitly requested by the subscriber or user, or for the sole purpose of carrying out the transmission of a communication over an electronic communications network.
Preferences
The technical storage or access is necessary for the legitimate purpose of storing preferences that are not requested by the subscriber or user.
Statistics
The technical storage or access that is used exclusively for statistical purposes.The technical storage or access that is used exclusively for anonymous statistical purposes. Without a subpoena, voluntary compliance on the part of your Internet Service Provider, or additional records from a third party, information stored or retrieved for this purpose alone cannot usually be used to identify you.
Marketing
The technical storage or access is required to create user profiles to send advertising, or to track the user on a website or across several websites for similar marketing purposes.