USD/JPY holds steady around 159.60 in Friday’s early Asian session.
Persistent tensions in the Middle East underpin the US Dollar, but US tariff threats might cap its upside.
BoJ authorities warned that they may adjust policy if Yen weakness persists.
The USD/JPY pair trades on a flat note near 159.60 during the Asian trading hours on Friday. Trading volumes are likely to be thin due to the Good Friday holiday. All eyes will be on the US March Nonfarm Payrolls (NFP) report, which will be published later on Friday.
Heightened geopolitical tensions in the Middle East drive up oil prices and lift the US Dollar (USD) against the Japanese Yen (JPY). US President Donald Trump pressures Iran to make a deal after a military strike destroys a bridge near Tehran. Meanwhile, Iran’s foreign minister, Abbas Araghchi, stated that Washington’s recent strikes on civilian infrastructure will not force the country to back down, adding that such actions “convey the defeat and moral collapse of an enemy in disarray.”
On the other hand, chaos around U.S. tariff policy might cap the upside for the Greenback. The Trump administration plans to slap up to 100% on certain imported medicines from companies that don’t reach deals with his administration in the coming months, per Bloomberg. A White House statement said that the new levy applies to patented drugs made in countries that lack tariff deals with the US by companies that don’t have most-favored-nation-pricing agreements with the administration.
Fears that Japanese authorities would step in to support the domestic currency could support the JPY and act as a headwind for the pair. Japan’s top currency diplomat, Atsushi Mimura, said on Monday that officials may need to take “decisive” steps if speculative moves persist in the currency market.
NZD/USD drifts lower to near 0.5710 in Friday’s Asian session.
China’s RatingDog Services PMI eased to 52.1 in March, weaker than expected.
The US March jobs data will be the highlight on Friday.
The NZD/USD pair extends the decline to a near four-month low around 0.5710 during the Asian trading hours on Friday. The New Zealand Dollar (NZD) softens against the US Dollar (USD) on the downbeat Chinese economic data and heightened geopolitical tensions in the Middle East. Trading volumes are likely to be thin due to the Good Friday holiday.
Data released by RatingDog on Friday showed that China’s Services Purchasing Managers’ Index (PMI) declined to 52.1 in March from 56.7 in February. This figure came in below the market consensus of 53.7. The China-proxy Kiwi edges lower following the weaker Chinese data.
Additionally, escalating tensions between the US and Iran could boost a safe-haven currency such as the Greenback and create a headwind for the pair. US President Donald Trump pressures Iran “to make a deal” after a military strike destroys a bridge near Tehran. Meanwhile, Iran’s foreign minister Abbas Araghchi stated that Washington’s recent strikes on civilian infrastructure will not force the country to back down.
Traders will closely monitor the US March jobs data later on Friday. The US economy is expected to see 60,000 job additions in March, while the Unemployment Rate is estimated to hold steady at 4.4% during the same period. Any signs of a weakening in the US labor market could drag the USD lower in the near term.
GBP/USD gains as markets price in the possibility of two BoE hikes in 2026 amid rising inflation fears.
The US Dollar may strengthen on safe-haven demand amid escalating Iran tensions following Trump’s recent threats.
Trump gave no clarity on reopening Hormuz, warning of intensified military action over the next two to three weeks.
GBP/USD inches higher after registering modest losses in the previous day, trading around 1.3230 during the Asian hours on Friday. Trading activity may remain subdued due to the Good Friday holiday.
The Pound Sterling (GBP) receives some support as markets are pricing in two Bank of England rate hikes in 2026 amid rising energy prices and inflation concerns. However, BoE Governor Andrew Bailey recently warned that expectations may be overstated.
However, the upside of the GBP/USD pair could be limited as the US Dollar (USD) could gain ground amid rising safe-haven demand following the recent Iran threats from US President Donald Trump.
US President Donald Trump offered no clarity on steps toward reopening the Strait of Hormuz, warning of intensified military action over the next two to three weeks and issuing strong threats against Iran. Iran’s Foreign Minister Abbas Araghchi responded that recent US strikes on civilian infrastructure would not force a retreat, describing them instead as evidence of an opponent in disarray and moral decline.
Chicago Fed President Austan Goolsbee expressed concern over rising oil prices, noting they could complicate efforts to curb inflation, particularly if gasoline costs surge and lift inflation expectations.
US Dollar Index holds gains around 100.00 in Friday’s early European session.
Trump pressures Iran to make a deal after a military strike destroys a bridge near Tehran.
The US March jobs data will be in the spotlight later on Friday.
The US Dollar Index (DXY), an index of the value of the US Dollar (USD) measured against a basket of six world currencies, currently trades near 100.00 during the early European trading hours on Friday. The DXY holds positive ground amid fresh concerns over a prolonged conflict in the Middle East. All eyes will be on the US March jobs report, which will be released later on Friday.
US President Donald Trump said on Thursday that the war’s core objectives are “nearing completion” and could wrap up in two to three weeks. He warned he would bomb Iran “back to the Stone Age” if they did not agree to an unconditional surrender.
Meanwhile, Iran’s foreign minister Abbas Araghchi stated that the attack wouldn’t force Tehran to surrender. “It only conveys the defeat and moral collapse of an enemy in disarray,” he said. A prolonged conflict between the US and Iran could prompt traders to seek a safe-haven currency such as the US Dollar in the near term.
Nonetheless, US tariff threats might cap the upside for the DXY. Bloomberg reported on Thursday that Trump signed an executive order that could slap up to 100% on certain imported medicines from companies that don’t reach deals with his administration in the coming months.
Traders await the release of the US March jobs data later on Friday for fresh impetus. The US economy is projected to see 60,000 job additions in March, while the Unemployment Rate is expected to hold steady at 4.4% during the same period. In case of softer-than-expected outcomes, this could weigh on the USD against its rivals.
EUR/USD may fall toward the initial support at the eight-month low of 1.1411.
The 14-day Relative Strength Index near 45 signals subdued momentum.
The pair tests the immediate barrier at the upper descending channel boundary near the nine-day EMA at 1.1544.
EUR/USD remains subdued for the second successive day, trading around 1.1540 during Asian hours on Friday. The daily chart technical analysis indicates a potential bullish reversal as the pair is testing the upper boundary of the descending channel pattern.
However, the near-term bias stays mildly bearish as price holds below both the nine-day and 50-day Exponential Moving Averages (EMAs), which cap recovery attempts and confirm a prevailing downside tone. The short-term average trades under the longer one and flattens, signalling a lack of bullish follow-through after recent rebounds.
The 14-day Relative Strength Index (RSI) momentum indicator around 45 keeps momentum on the soft side, showing sellers retain a slight advantage without reaching oversold extremes.
The EUR/USD pair may navigate the region around the initial support at the eight-month low of 1.1411, recorded on March 13. Further declines would put downward pressure on the pair to test the descending channel around 1.1250.
On the upside, the EUR/USD pair is testing the immediate resistance at the upper descending channel boundary around the nine-day EMA at 1.1544. A break above the channel would strengthen the market bias and support the pair to test the 50-day EMA at 1.1637. Further advances would open the doors for the pair to explore the region around 1.2082, the highest since June 2021, which was recorded on January 27.
EUR/USD: Daily Chart
(The technical analysis of this story was written with the help of an AI tool.)
Euro Price Today
The table below shows the percentage change of Euro (EUR) against listed major currencies today. Euro was the weakest against the Japanese Yen.
USD
EUR
GBP
JPY
CAD
AUD
NZD
CHF
USD
0.04%
-0.06%
-0.05%
0.03%
-0.07%
0.15%
-0.02%
EUR
-0.04%
-0.05%
-0.07%
-0.01%
0.02%
0.10%
-0.05%
GBP
0.06%
0.05%
0.00%
0.06%
0.10%
0.17%
0.00%
JPY
0.05%
0.07%
0.00%
0.06%
0.08%
0.17%
-0.00%
CAD
-0.03%
0.00%
-0.06%
-0.06%
0.03%
0.12%
-0.04%
AUD
0.07%
-0.02%
-0.10%
-0.08%
-0.03%
0.08%
-0.08%
NZD
-0.15%
-0.10%
-0.17%
-0.17%
-0.12%
-0.08%
-0.17%
CHF
0.02%
0.05%
-0.00%
0.00%
0.04%
0.08%
0.17%
The heat map shows percentage changes of major currencies against each other. The base currency is picked from the left column, while the quote currency is picked from the top row. For example, if you pick the Euro from the left column and move along the horizontal line to the US Dollar, the percentage change displayed in the box will represent EUR (base)/USD (quote).
The offshore yuan edged higher to around 6.88 per dollar on Friday, trimming gains from the previous session as market sentiment improved on growing hopes for the reopening of the Strait of Hormuz. Iran and Oman are said to be developing a protocol to “monitor transit” through the strategic waterway, a move aimed at easing regional tensions.
Elsewhere, countries such as India and the Philippines are actively negotiating with Tehran to ensure the safe passage of vessels, while also forming small diplomatic circles and exploring barter-style agreements. Meanwhile, China and Pakistan are advocating for their own multi-point diplomatic plan, as Iran maintains tight control over the shipping lane. Domestically, RatingDog data showed China’s composite PMI fell to 51.5 in March from 55.4 in February 2026, as both manufacturing (50.8 vs 52.1) and services (52.1 vs 56.7) sectors slowed. Over the week, the yuan is poised for a weekly gain, breaking a four-week losing streak.
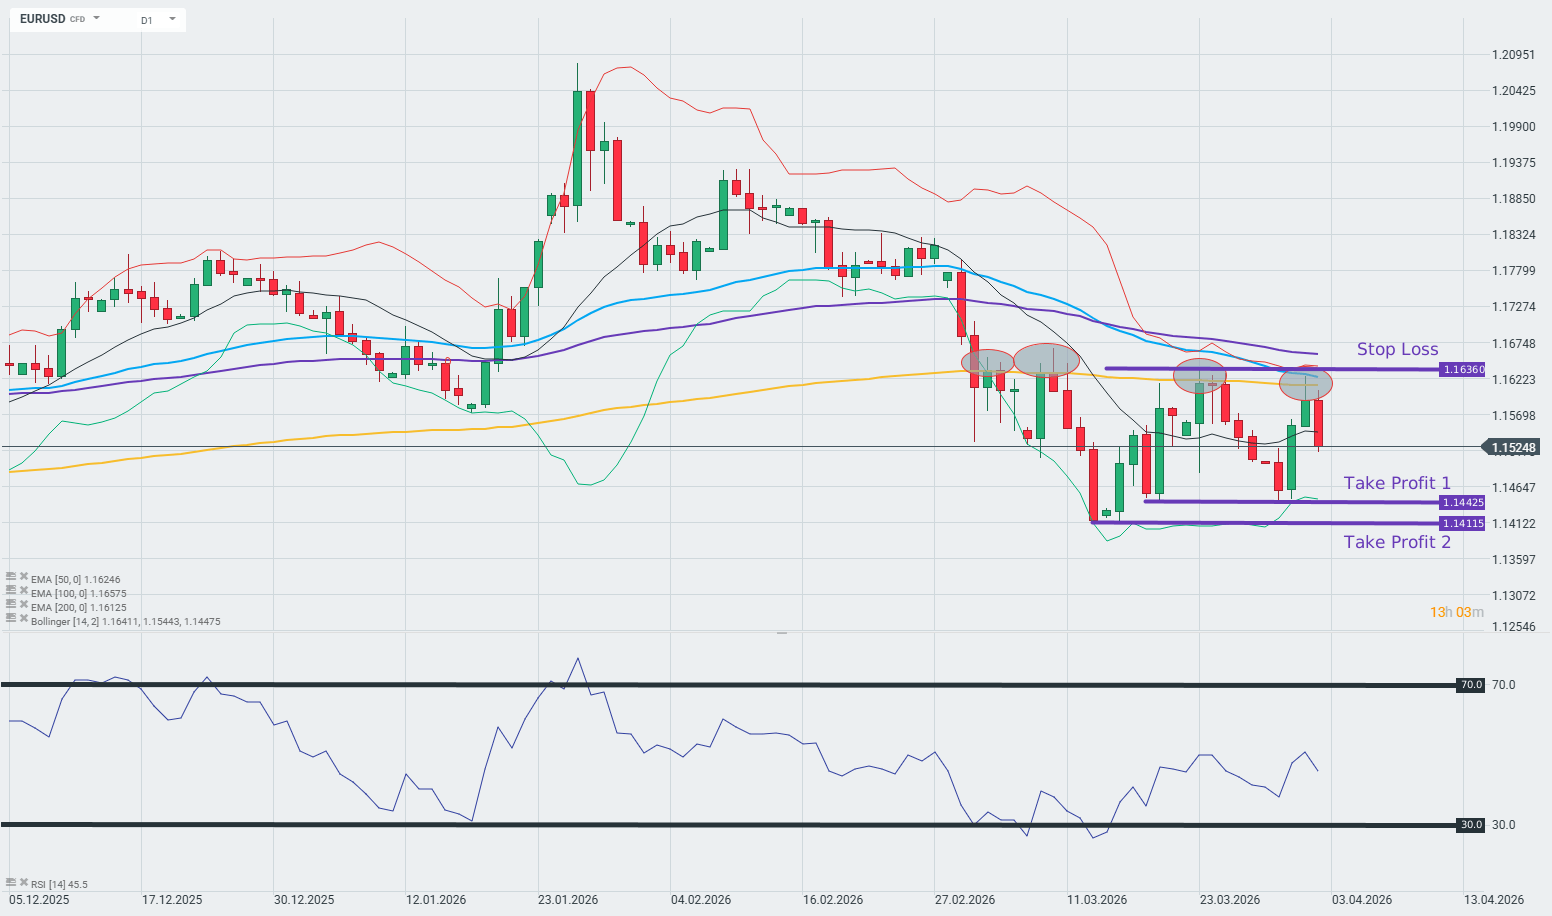
The EUR/USD exchange rate failed to close above the 200-day EMA on yesterday’s daily candle
The price remains below the 50-, 100-, and 200-day exponential moving averages (EMA)
Recommendation:
Trade: Short position on the EUR/USD pair at market price
Take Profit 1: 1.14425
Take Profit 2: 1.14115
Stop: 1.16360
Opinion:
From a technical perspective, the EURUSD pair remains in a structural downtrend, which is a key argument for maintaining short positions. The price consistently remains below the 200-, 100-, and 50-day exponential moving averages (EMA), which form dynamic resistance and confirm the dominance of supply over demand in the medium term. Prices are moving within a bearish flag pattern (a trend continuation pattern), and current attempts at a rebound are being stifled by successive resistance levels marked by the downward-sloping EMAs, which technically indicates further potential for the euro-dollar exchange rate to depreciate.
An additional and significant catalyst for the dollar’s strengthening is the escalation of the armed conflict in the Middle East, directly driven by the Trump administration’s actions. In his Wednesday address to the nation, the president announced that within the next 2–3 weeks, the United States would strike Iran “extremely hard,” promising simultaneous attacks on all Iranian power plants, which—as Trump stated—“will set the country back to the Stone Age.” The escalation of the military operation codenamed “Operation Epic Fury” is generating a classic flight-to-safety effect—primarily toward the dollar—which, combined with the euro-dollar’s technical weakness, creates a consistent environment conducive to the continuation of the downward trend in the EURUSD pair
Methodology and assumptions: This recommendation is based on a technical analysis of the EURUSD chart. Classical technical analysis was used to assess the situation and analyze the trend. The target level—take profit 1—was set at the level of previous price reactions, using price action methodology. Take profit 2, on the other hand, is based on the location of last month’s local low. The protective stop-loss order was set above the most recent local high using price action methodology.
The Overbalance analysis aims to identify three financial instruments, analyzed primarily on the daily/four-hour (D1/H4) timeframe. The analysis uses only the Overbalance methodology, which helps determine where a trend may continue or where it may reverse. Today’s analysis covers three instruments, evaluated solely in terms of 1:1 correction structures.
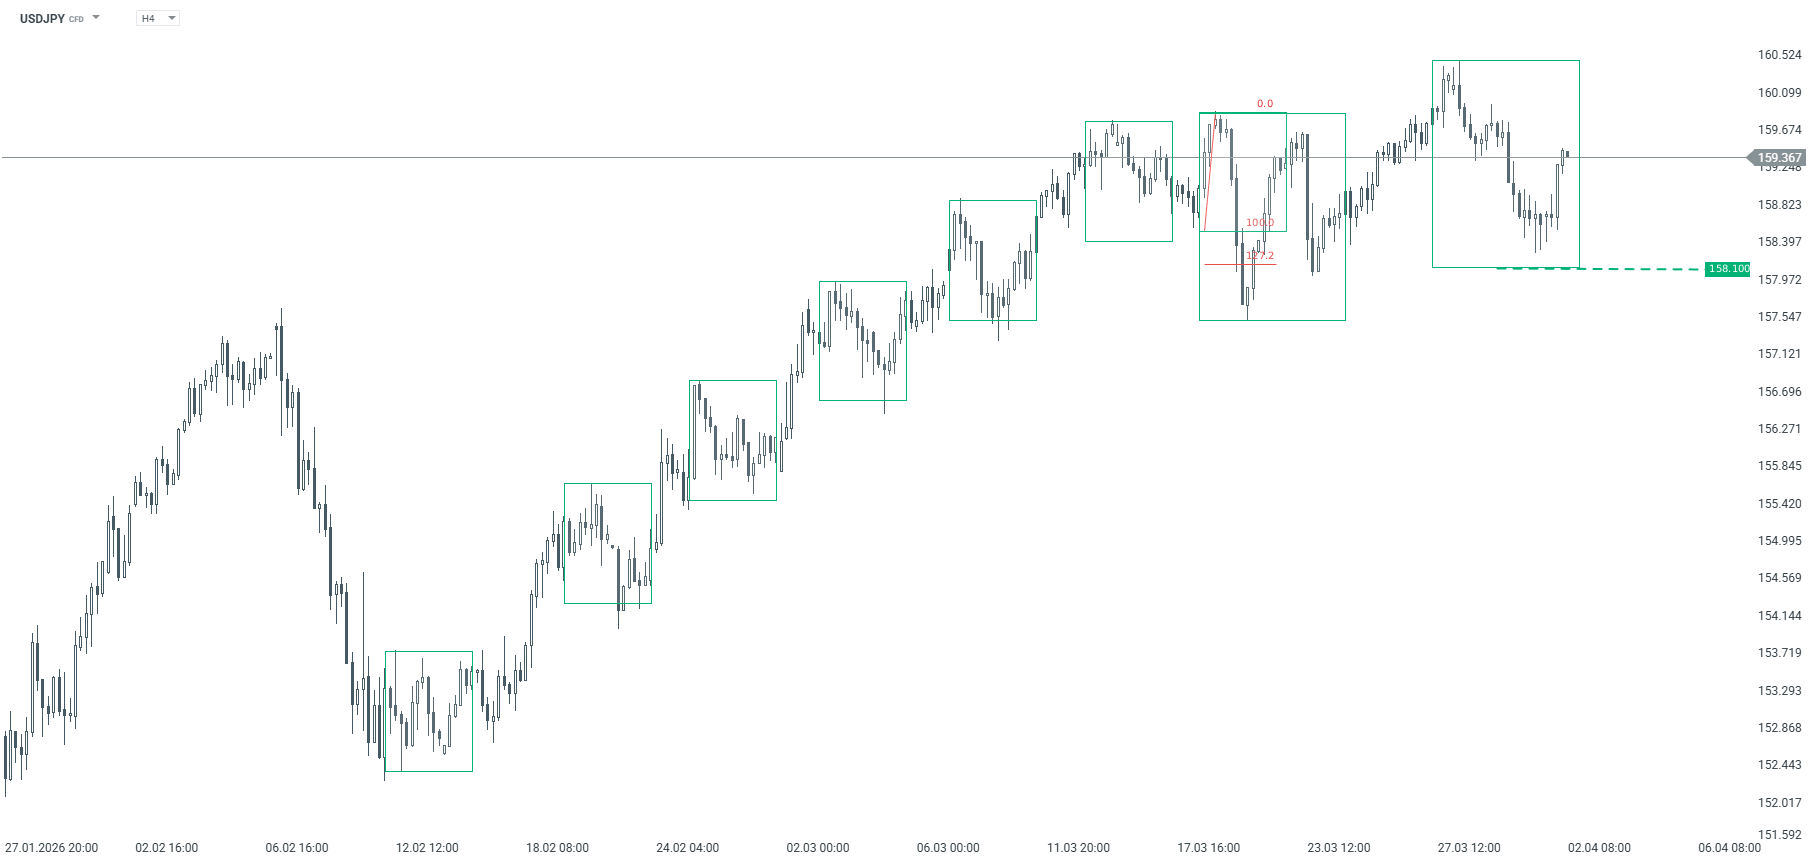
USDJPY Since February 12, the USDJPY has been trading in a strong uptrend. Initially, the movement was controlled by a 1:1 corrective pattern with a range of approximately 140 pips; however, in mid-March, a deeper correction occurred, after which the market established a new high. As a result, the current largest corrective pattern has a range of approximately 240 pips. At this point, the key support level is 158.10, derived from the lower boundary of this pattern. As long as this level holds, the uptrend remains in place. A break below it, however, could open the way for a larger correction or even a trend reversal.
USDJPY – H4 chart. Source: xStation
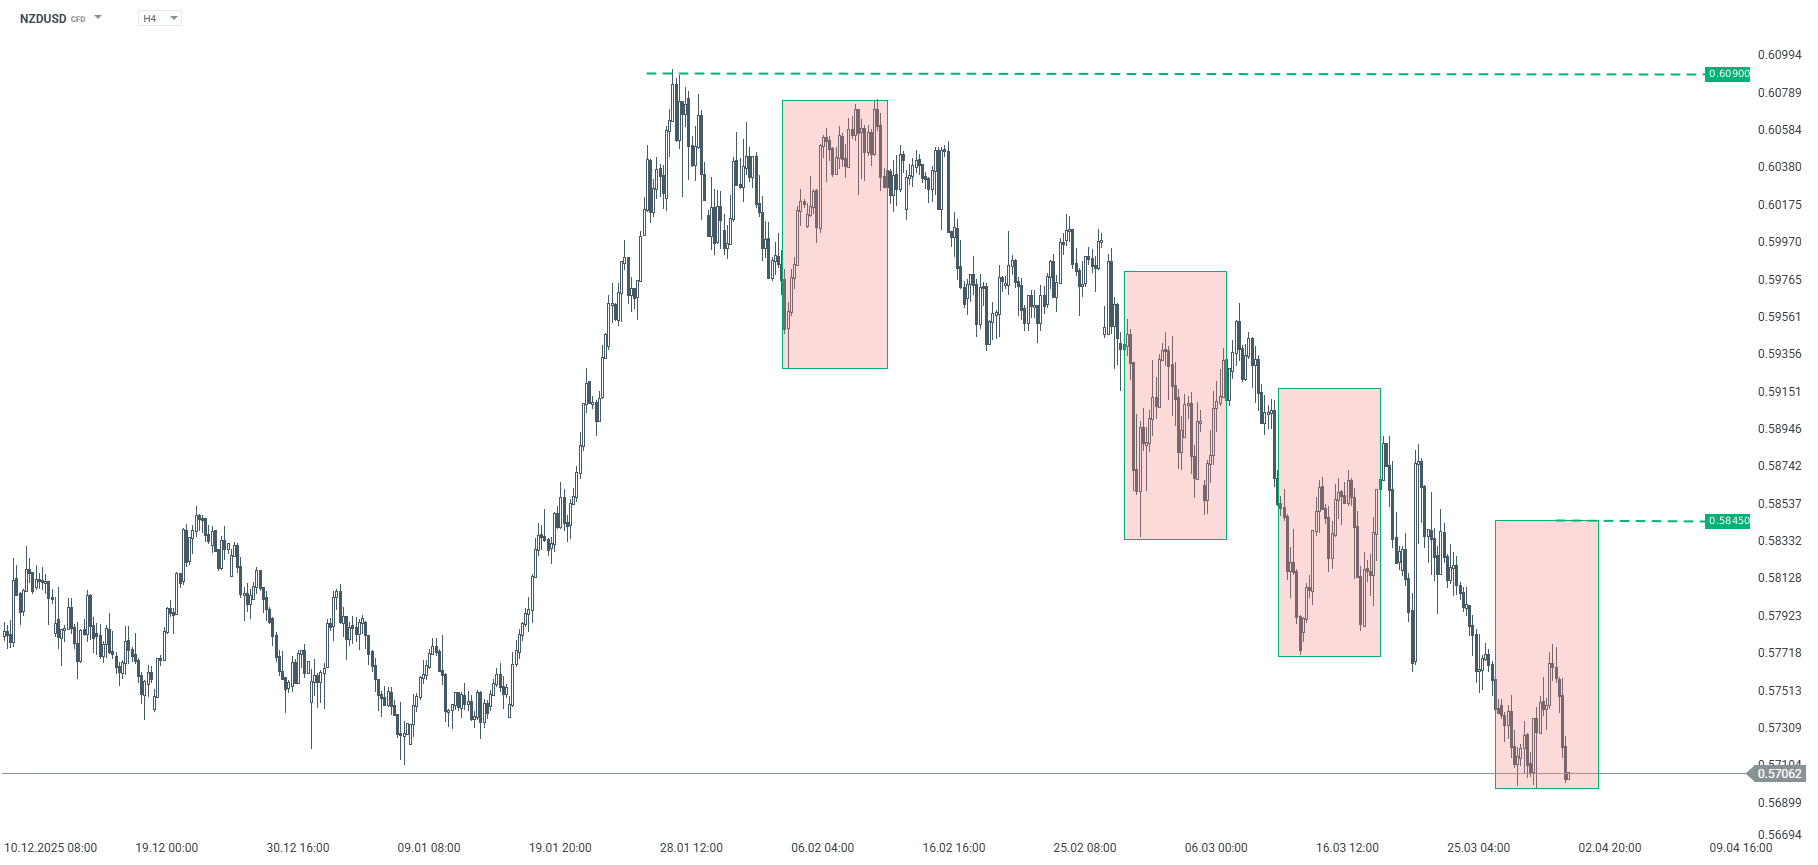
NZDUSD The NZDUSD pair has been trending downward since late January. We are currently seeing an upward corrective move. If the correction continues, the key resistance level remains at 0.5845, where the upper boundary of the 1:1 correction pattern is located. According to the Overbalance methodology, the downtrend remains in effect until this level is negated.
NZDUSD – H4 chart. Source: xStation
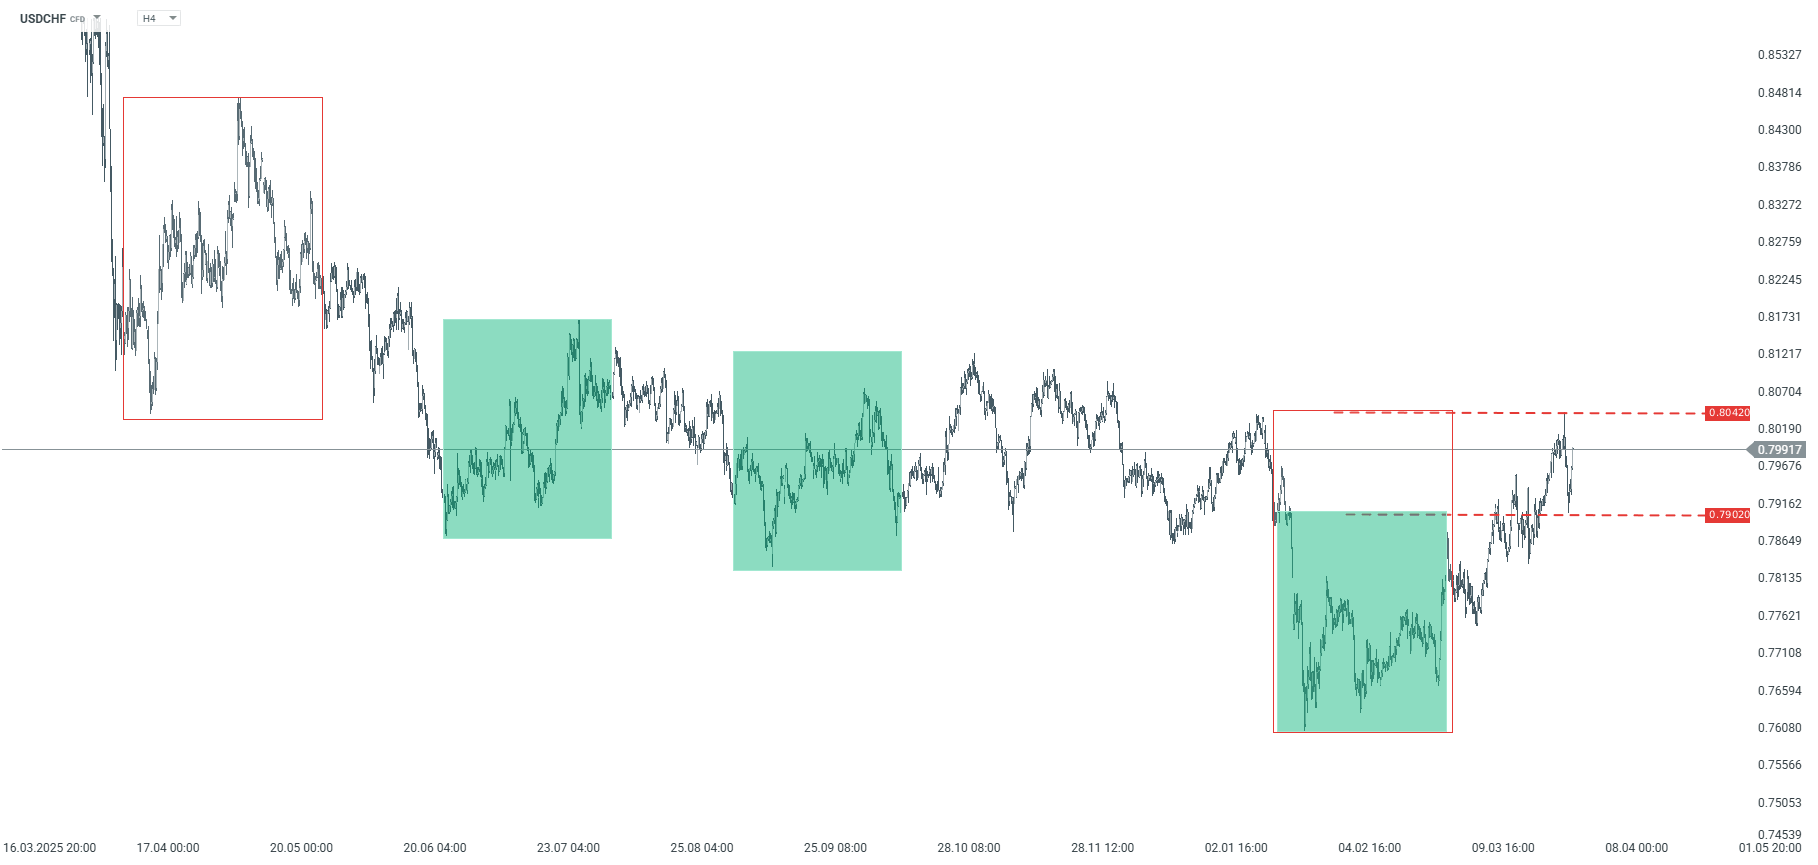
USDCHF Since early January, USDCHF has been in a downtrend. However, an upward correction has been developing since late January, and its range has already exceeded smaller geometric patterns, including the 0.7902 level. Nevertheless, the price has failed to break through the key resistance at 0.8042, where the upper boundary of the largest corrective pattern is located. According to the Overbalance methodology, the downtrend remains in effect until this level is broken. The decline could accelerate after falling below the 0.7902 level, which is the lower boundary of the smaller geometric pattern. Conversely, a break above 0.8042 could lead to a shift to an uptrend.
USDCHF – H4 timeframe. Source: xStation
The material on this page does not constitute financial advice and does not take into account your level of understanding, investment objectives, financial situation or any other specific needs. All information provided, including opinions, market research, mathematical results and technical analyzes published on the Website or transmitted To you by other means, it is provided for information purposes only and should in no way be construed as an offer or solicitation for a transaction in any financial instrument, nor should the information provided be construed as advice of a legal or financial nature on which any investment decisions you make should be based exclusively To your level of understanding, investment objectives, financial situation, or other specific needs, any decision to act on the information published on the Website or sent to you by other means is entirely at your own risk if you In doubt or unsure about your understanding of a particular product, instrument, service or transaction, you should seek professional or legal advice before trading. Investing in CFDs carries a high level of risk, as they are leveraged products and have small movements Often the market can result in much larger movements in the value of your investment, and this can work against you or in your favor. Please ensure you fully understand the risks involved, taking into account investments objectives and level of experience, before trading and, if necessary, seek independent advice.
To provide the best experiences, we use technologies like cookies to store and/or access device information. Consenting to these technologies will allow us to process data such as browsing behavior or unique IDs on this site. Not consenting or withdrawing consent, may adversely affect certain features and functions.
Functional
Always active
The technical storage or access is strictly necessary for the legitimate purpose of enabling the use of a specific service explicitly requested by the subscriber or user, or for the sole purpose of carrying out the transmission of a communication over an electronic communications network.
Preferences
The technical storage or access is necessary for the legitimate purpose of storing preferences that are not requested by the subscriber or user.
Statistics
The technical storage or access that is used exclusively for statistical purposes.The technical storage or access that is used exclusively for anonymous statistical purposes. Without a subpoena, voluntary compliance on the part of your Internet Service Provider, or additional records from a third party, information stored or retrieved for this purpose alone cannot usually be used to identify you.
Marketing
The technical storage or access is required to create user profiles to send advertising, or to track the user on a website or across several websites for similar marketing purposes.