EUR/GBP holds losses around 0.8540, despite a sharp increase in German Industrial Production.
Factory output rose 0.9% in Germany in May, beyond the 0.2% expected by the market.
The Euro has dropped more than 1% in about a week, as markets pare back ECB tightening hopes.
The Euro (EUR) has failed to draw support from the upbeat German industrial figures released earlier on Tuesday and consolidates losses at one-year lows against the British Pound (GBP). The EUR/GBP pair trades at 0.8540, its lowest price since July last year, after falling from levels above 0.8600 last week.
Data released by the German statistics office on Tuesday showed that Industrial Production increased 0.9% in May, more than twice April’s 0.4% rise, and well above the 0.2% increase forecasted by the market analysts.
In the UK, the Lloyds House Price Index, released at the same time, has shown a 0.2% increase in June, following a 0.1% contraction in May, also beating expectations of a 0.1% rise. Year-over-year, housing prices accelerated to a 0.6% growth, from the 0.5% seen in May, according to the Lloyds report.
The Euro loses support from ECB’s monetary policy
The pair has depreciated more than 1% since last week, as soft German consumer price data suggested that inflationary pressures from the Middle East war might have already peaked, easing pressure on the European Central Bank (ECB) to hike interest rates in the near term.
ECB President Christine Lagarde refused to commit to any particular rate path at a central bankers’ summit in Sintra last week. Her comments pointing to levelled risks for growth and inflation and denying second-round effects on inflation, however, suggest that the bank is likely to stand pat in July after June’s rate hike.
This has deprived the Euro of the favourable monetary policy divergence between the ECB and the Bank of England (BoE), which is not expected to change its monetary policy in the coming months.
NZD/USD falls as a steady US Dollar draws support from renewed geopolitical tensions in the Strait of Hormuz.
Traders expect the Fed to keep rates unchanged this month and in September.
ING anticipates the RBNZ will implement a 25-basis-point rate hike to 2.50% this Wednesday.
NZD/USD inches lower for the second successive day, trading around 0.5700 during the Asian hours on Tuesday. The currency pair depreciates as the US Dollar (USD) holds ground, which could be attributed to the renewed geopolitical tensions in the Strait of Hormuz.
Bloomberg reported, citing a United States (US) official, that Iran fired at least two missiles at commercial vessels transiting the strategic waterway late Monday. While two ships sustained significant damage, no casualties were reported. Separately, the UK Maritime Trade Operations (UKMTO) confirmed that a southbound tanker was struck on its port side by an unknown projectile, which ignited a fire on board.
Market participants scaled back expectations for Federal Reserve rate hikes this month and in September. This shift in sentiment followed a cooling employment report that revealed fewer jobs added across April, May, and June than Wall Street had anticipated. Furthermore, a recent drop in crude oil prices, driven by an OPEC+ production boost and a US-Iran peace deal, has alleviated broader inflationary pressures, softening the urgency for an aggressive Fed policy outlook.
Despite a sharp collapse in oil prices, ING anticipates the Reserve Bank of New Zealand (RBNZ) will implement a 25-basis-point “insurance” rate hike to 2.50% on Wednesday. However, the firm cautions that the tightening could be a one-off move, offering little sustained upward momentum for the New Zealand Dollar (NZD).
AUD/USD attracts sellers after a modest Asian session uptick to a two-week high.
The mixed technical setup warrants caution before placing fresh directional bets.
A move beyond the 38.2% Fibo. is needed to back the case for a meaningful upside.
The AUD/USD retreats slightly from the 0.6960 area, or a two-week high, touched during the Asian session on Tuesday, and, for now, seems to have snapped a three-day winning streak. The intraday downtick, however, lacks bearish conviction, warranting caution before confirming that a one-week-old recovery move from a three-month low has run out of steam.
From a technical perspective, the AUD/USD pair, so far, has been struggling to make it through the 38.2% Fibonacci retracement level of the November 2025-May 2026 rally. Furthermore, mixed momentum oscillators make it prudent to wait for a sustained move beyond the said barrier before positioning for an extension of the recent bounce from the very important 200-day Simple Moving Average (SMA) support near 0.6870.
In fact, the Moving Average Convergence Divergence (MACD) has turned slightly positive, hinting at a slight improvement in the upside momentum. However, the Relative Strength Index (RSI) near 42 suggests only modest directional pressure, consistent with a consolidative bias around current levels, warranting some caution for aggressive bullish traders as renewed tensions in the Strait of Hormuz support the US Dollar.
Meanwhile, initial support emerges at the 50% retracement at 0.6853, ahead of a deeper structural floor at the 61.8% Fibo. near 0.6752, with 0.6608 and 0.6425 marking subsequent retracement and cycle-low supports if selling extends. On the topside, a break above the 38.2% Fibo. at 0.6954 would open the way toward the 23.6% retracement barrier at 0.7079, while the cycle high around 0.7282 stands as a more distant objective should bullish momentum gain traction.
AUD/USD daily chart
Australian Dollar Price Last 7 Days
The table below shows the percentage change of Australian Dollar (AUD) against listed major currencies last 7 days. Australian Dollar was the strongest against the Canadian Dollar.
USD
EUR
GBP
JPY
CAD
AUD
NZD
CHF
USD
-0.13%
-0.99%
-0.10%
0.04%
-0.83%
-0.85%
-0.25%
EUR
0.13%
-0.88%
0.04%
0.15%
-0.71%
-0.66%
-0.12%
GBP
0.99%
0.88%
0.93%
1.01%
0.15%
0.21%
0.75%
JPY
0.10%
-0.04%
-0.93%
0.17%
-0.69%
-0.64%
-0.18%
CAD
-0.04%
-0.15%
-1.01%
-0.17%
-0.87%
-0.80%
-0.28%
AUD
0.83%
0.71%
-0.15%
0.69%
0.87%
-0.01%
0.59%
NZD
0.85%
0.66%
-0.21%
0.64%
0.80%
0.01%
0.51%
CHF
0.25%
0.12%
-0.75%
0.18%
0.28%
-0.59%
-0.51%
The heat map shows percentage changes of major currencies against each other. The base currency is picked from the left column, while the quote currency is picked from the top row. For example, if you pick the Australian Dollar from the left column and move along the horizontal line to the US Dollar, the percentage change displayed in the box will represent AUD (base)/USD (quote).
USD/JPY drifts lower during the Asian session, though the downside potential seems limited.
The wide US-Japan rate differential might continue to weigh on the JPY and support the pair.
Economic risks due to Hormuz tensions further warrant some caution for aggressive JPY bulls.
The USD/JPY pair extends the previous day’s late pullback from the vicinity of mid-162.00s and attracts some follow-through sellers during the Asian session on Tuesday. Spot prices drop to the 161.70-161.65 region in the last hour, though the downside remains cushioned in the absence of any intervention by Japanese authorities and a supportive fundamental backdrop.
Reports last week suggested that Japanese officials are abandoning their traditional habit of telegraphing intervention risks and are starting to focus on targeting speculators. The immediate market reaction, however, seems to have faded as no action has been taken yet. Moreover, the wide gap in borrowing costs between Japan and other major economies, including the US, keeps the so-called carry trade in play and continues to undermine the Japanese Yen (JPY) amid economic risks stemming from Middle East tensions.
In fact, a maritime agency reported that an oil tanker was struck by an unidentified projectile while transiting through the critical Strait of Hormuz. This comes on top of the US-Iran standoff over the idea of Iran charging vessels for using the strait and adds to worries that Japan’s economy will remain under strain due to the continued disruption of energy supplies. Moreover, concerns about the sustainability of the fragile US-Iran peace deal benefit the US Dollar’s (USD) relative safe-haven status and support the USD/JPY pair.
On the economic data front, Japan’s nominal wages – or total cash earnings – rose 3.2% in May, slightly slower than a revised 3.6% gain in the previous month. Meanwhile, real wages rose 1.4% from a year earlier to mark a fifth consecutive month of increases, though the growth rate slowed amid re-accelerating consumer inflation. Furthermore, Household Spending in Japan fell for the sixth straight month, by 0.4% YoY in May. This might complicate the BoJ’s policy tightening path and backs the case for further JPY depreciation.
Meanwhile, reduced bets for interest rate hikes by the US Federal Reserve (Fed) act as a headwind for the USD and might keep a lid on any meaningful upside for the USD/JPY pair. Nevertheless, the aforementioned fundamental backdrop suggests that any corrective pullback might still be seen as a buying opportunity and remain limited. Hence, it will be prudent to wait for strong follow-through selling before confirming that spot prices have topped out in the near-term, as traders now look to FOMC Minutes on Wednesday.
Japanese Yen Price Today
The table below shows the percentage change of Japanese Yen (JPY) against listed major currencies today. Japanese Yen was the strongest against the Canadian Dollar.
USD
EUR
GBP
JPY
CAD
AUD
NZD
CHF
USD
-0.03%
-0.04%
-0.16%
0.04%
-0.04%
-0.07%
-0.01%
EUR
0.03%
-0.03%
-0.15%
0.05%
0.00%
-0.03%
0.01%
GBP
0.04%
0.03%
-0.11%
0.09%
0.04%
-0.00%
0.05%
JPY
0.16%
0.15%
0.11%
0.20%
0.13%
0.09%
0.15%
CAD
-0.04%
-0.05%
-0.09%
-0.20%
-0.08%
-0.09%
-0.05%
AUD
0.04%
-0.00%
-0.04%
-0.13%
0.08%
-0.04%
0.02%
NZD
0.07%
0.03%
0.00%
-0.09%
0.09%
0.04%
0.05%
CHF
0.00%
-0.01%
-0.05%
-0.15%
0.05%
-0.02%
-0.05%
The heat map shows percentage changes of major currencies against each other. The base currency is picked from the left column, while the quote currency is picked from the top row. For example, if you pick the Japanese Yen from the left column and move along the horizontal line to the US Dollar, the percentage change displayed in the box will represent JPY (base)/USD (quote).
GBP/USD rises as the US Dollar struggles after soft US data prompts markets to scale back Fed rate hike bets.
Fed policy outlook softens as a cooling employment report and dropping crude oil prices ease inflationary pressures.
The British Pound may face headwinds as markets slash expectations from two interest rate hikes down to just a 70% chance of one.
GBP/USD continues its winning streak for the ninth consecutive day, trading around 1.3390 during the Asian hours on Tuesday. The currency pair rises as the US Dollar (USD) faces headwinds as market participants scale back expectations for Federal Reserve (Fed) rate hikes this month and in September. This shift in sentiment followed a cooling employment report that revealed fewer jobs added across April, May, and June than Wall Street had anticipated.
Furthermore, a recent drop in crude oil prices, driven by an OPEC+ production boost and a US-Iran peace deal, has alleviated broader inflationary pressures, softening the urgency for an aggressive Fed policy outlook.
The Greenback could find baseline support from hawkish remarks by Federal Reserve (Fed) Governor Christopher Waller and resilient domestic economic data.
Waller underscores flexible forward guidance and firm 2% inflation pledge
Fed’s Waller delivers a moderately stronger-than-usual performance, with a 7.1/10 FXS Speechtracker score compared to the established baseline of 6.4/10, emphasizing both the usefulness and the pitfalls of forward guidance. The focus on forward guidance as a “valuable tool” that can accelerate policy transmission, yet becomes a hindrance when too rigid or when facing multiple plausible economic paths, signals a preference for more flexible communication and reinforces the importance of a well-understood reaction function. Waller’s insistence on the credibility of the 2% inflation pledge, rejection of keeping rates low to aid deficit financing, and preference for an inflation target range (without changing the current target) collectively lean hawkish for the Dollar, even without explicit comments on the near-term outlook.
The FXS Fed Sentiment Index rose by 1.83 points to 125.72, confirming a move further into hawkish territory relative to the neutral 100 benchmark. This upward shift, aligned with the above-baseline FXS Speechtracker score, suggests markets will read Waller’s remarks as reinforcing the Fed’s anti-inflation stance and limiting expectations for policy accommodation, a backdrop that tends to support the Dollar against other major currencies.
Although business activity in the United States (US) services sector cooled slightly, it remained firmly in expansionary territory, with the June ISM Services Purchasing Managers’ Index (PMI) printing at 54.0 in line with consensus estimates. Within the sub-components of the report, the Prices Index dipped from 71.3 to 67.7, while the Employment Index saw a notable improvement, climbing out of contractionary territory from 47.9 to 51.2.
On the other side of the equation, the British Pound (GBP) could face its own pressures as markets lowered expectations for Bank of England (BoE) tightening. Investors are now pricing in just a 70% chance of a single rate hike this year, a sharp decline from the two increases anticipated just a few weeks ago.
While BoE Governor Andrew Bailey recently confirmed that inflation remains on track to hit the bank’s 2% target, he acknowledged it would take longer than previously forecast and firmly ruled out any imminent rate cuts.
This cautious approach follows the BoE’s June 18 monetary policy meeting, where officials voted 7-2 to hold the benchmark interest rate at 3.75%. Although the status quo is maintained, the hawkish camp has doubled since April, with two dissenting voters pushing for an immediate hike to 4.00%.
While UK inflation currently sits at 2.8%, the central bank’s internal projections indicate it could bounce back above 3% by autumn due to delayed war-era energy cost pass-throughs, leading major sell-side institutions to forecast the next rate hike around late 2026.
Goldman Sachs has significantly raised its forecasts for the USD/JPY pair, becoming one of the most bearish investment banks on the Japanese currency. The bank’s strategists now expect the exchange rate to rise from their previous 12-month target of 155 to 165 yen per U.S. dollar, which would mark the weakest level for the yen since 1986—nearly 40 years ago.
Key Takeaways
Goldman Sachs raised its 12-month USD/JPY forecast from 155 to 165.
The bank also lifted its 3-month forecast from 160 to 162 and its 6-month target from 158 to 163.
The yen remains close to its weakest levels in four decades, with USD/JPY currently trading around 162.
According to Bloomberg’s survey, Goldman is now among the most bearish institutions on the Japanese currency.
Options markets imply roughly a 72% probability that USD/JPY reaches 165 by June next year.
Hedge funds are holding their largest net short positions in the yen since 2017.
Why Does Goldman Expect Further Yen Weakness?
According to Goldman Sachs FX strategist Karen Reichgott Fishman, three key factors are driving the bank’s revised outlook:
persistently high U.S. Treasury yields,
mounting fiscal pressures in Japan,
and the Bank of Japan’s very gradual pace of interest rate hikes.
At the same time, Goldman acknowledges that the yen already appears significantly undervalued based on its fundamental valuation models. However, that alone is not enough to trigger a sustained recovery. The bank argues that the wide interest rate differential between the United States and Japan, together with the divergence in monetary policy, continues to strongly favor the U.S. dollar.
Carry Trades Remain a Major Driver
Goldman Sachs continues to favor using the yen as the preferred funding currency for carry trades. The strategy is straightforward:
investors borrow low-cost yen,
sell the currency in the FX market,
and invest the proceeds in higher-yielding assets such as U.S. bonds or emerging-market currencies.
As long as the Bank of Japan maintains relatively accommodative financial conditions, carry trades are likely to remain attractive, adding further depreciation pressure on the yen.
Can Japan Stop USD/JPY From Rising?
Goldman remains skeptical about the effectiveness of future currency interventions. Although Japan’s Ministry of Finance has hinted that future interventions could become less predictable, the bank believes even direct yen-buying operations would likely generate only a temporary correction. Unless there is a meaningful decline in U.S. Treasury yields, a more hawkish Bank of Japan, or a significant narrowing of the U.S.-Japan interest rate gap, the fundamental drivers of yen weakness are likely to remain firmly in place.
Markets Are Increasingly Pricing in USD/JPY at 165
One notable aspect of Goldman’s outlook is how closely it aligns with broader market positioning. Currently:
hedge funds hold their largest net short yen positions in eight years,
FX derivatives imply roughly a 72% probability of USD/JPY reaching 165 by the middle of next year,
and an increasing number of investors view shorting the yen as one of the most crowded trades in global currency markets.
While this reinforces the prevailing uptrend, it also increases the risk of sharp corrections should expectations for the Federal Reserve or the Bank of Japan change unexpectedly.
What Could Change the Outlook?
The key near-term event will be the release of this week’s Federal Reserve meeting minutes. Investors will focus primarily on:
signals regarding future Fed rate cuts,
the direction of U.S. Treasury yields,
upcoming Bank of Japan policy decisions,
and the possibility of intervention by Japanese authorities.
A hawkish set of Fed minutes could strengthen the U.S. dollar further, putting renewed pressure on both the yen and the euro. Conversely, weaker U.S. economic data could lower Treasury yields and provide temporary relief for non-dollar currencies.
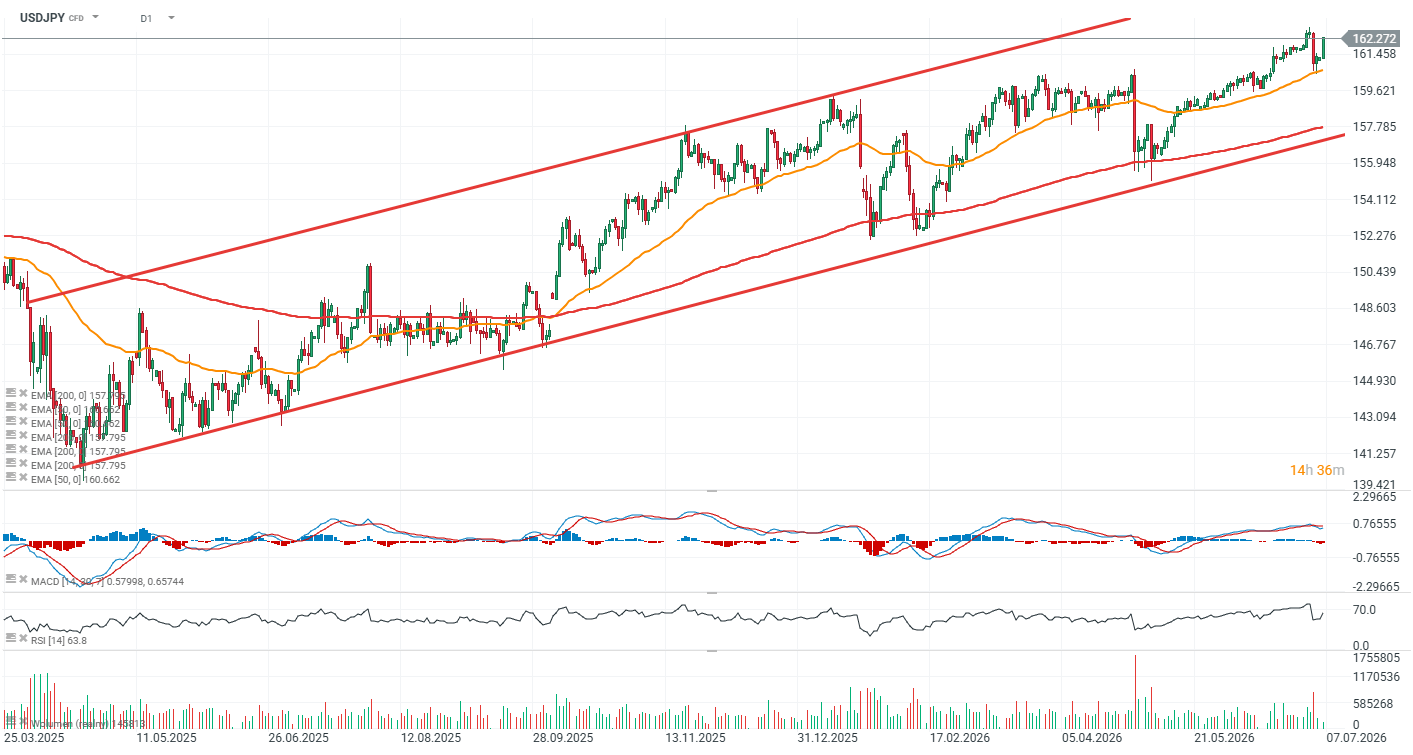
USD/JPY Technical Analysis (D1)
USD/JPY remains in a strong uptrend and continues to trade within a well-defined ascending price channel. The lower boundary of the channel is currently located near 158, a level that was last tested in May. In the short term, resistance is seen around 162.8 , corresponding to the pair’s recent swing highs. A sustained break above this level could reinforce bullish momentum, while a rejection may trigger another pullback toward the lower boundary of the ascending channel. 165 level i now probably the strongest resistance zone.
EUR/JPY could test the upper boundary of the symmetrical triangle around 185.90.
The 14-day Relative Strength Index is at 51, hinting at neutral-to-firm momentum.
Initial support aligns with the 50-day EMA of 184.91.
EUR/JPY gains ground for the second successive day, trading around 185.00 during the Asian hours on Monday. The currency cross holds a constructive near-term bias as it trades above the nine-period and 50-period Exponential Moving Averages (EMAs).
The volume-weighted average price (VWAP) is reinforcing underlying demand around 184.31. The 14-day Relative Strength Index (RSI) hovers near 51, reflecting neutral-to-firm momentum as the spot price solidifies above key dynamic support levels.
The technical analysis of the daily chart suggests that the EUR/JPY cross is remaining within the symmetrical triangle, indicating that both buyers and sellers are becoming increasingly aggressive, squeezing the price into a tighter and tighter range. Neither side has taken control yet, creating a temporary balance of power.
Further advances would support the EUR/JPY cross to test the upper boundary of the symmetrical triangle around 185.90. A break above the triangle would cause the bullish emergence and expose the all-time high of 187.95, which was recorded on April 17.
On the downside, initial support lies at the 50-day EMA of 184.91, followed by the nine-day EMA at 184.71. Further declines would expose the symmetrical triangle’s lower boundary around 183.60, followed by the four-month low of 181.87, recorded on March 16, and the six-month low of 180.81.
EUR/JPY: Daily Chart
Euro Price Today
The table below shows the percentage change of Euro (EUR) against listed major currencies today. Euro was the strongest against the New Zealand Dollar.
USD
EUR
GBP
JPY
CAD
AUD
NZD
CHF
USD
0.02%
0.05%
0.29%
0.07%
0.13%
0.37%
0.11%
EUR
-0.02%
0.03%
0.26%
0.05%
0.12%
0.38%
0.09%
GBP
-0.05%
-0.03%
0.22%
-0.02%
0.04%
0.32%
0.07%
JPY
-0.29%
-0.26%
-0.22%
-0.23%
-0.16%
0.06%
-0.12%
CAD
-0.07%
-0.05%
0.02%
0.23%
0.05%
0.31%
0.07%
AUD
-0.13%
-0.12%
-0.04%
0.16%
-0.05%
0.26%
0.04%
NZD
-0.37%
-0.38%
-0.32%
-0.06%
-0.31%
-0.26%
-0.26%
CHF
-0.11%
-0.09%
-0.07%
0.12%
-0.07%
-0.04%
0.26%
The heat map shows percentage changes of major currencies against each other. The base currency is picked from the left column, while the quote currency is picked from the top row. For example, if you pick the Euro from the left column and move along the horizontal line to the US Dollar, the percentage change displayed in the box will represent EUR (base)/USD (quote).
AUD/USD kicks off the new week on a weaker note, snapping a two-day winning streak.
The mixed technical setup warrants caution before placing aggressive directional bets.
A convincing break below the 200-day SMA is needed to confirm a negative outlook.
The AUD/USD pair meets with a fresh supply during the Asian session on Monday and, for now, seems to have snapped a two-day winning streak to the 0.6950 region, or a one-and-a-half-week high touched on Friday. Spot prices currently trade around the 0.6920 area, down 0.20% for the day, as tensions over the Strait of Hormuz drive some safe-haven flows towards the US Dollar (USD).
The AUD/USD pair fails near the 38.2% Fibonacci retracement level of the November 2025-May 2026 rally, stalling its recovery from a technically significant 200-day Simple Moving Average (SMA), or a three-month low set last week. The latter is near the 50% retracement level, suggesting a constructive near-term bias as long as these supports remain intact. Moreover, the Moving Average Convergence Divergence (MACD) histogram has turned slightly positive, hinting at recovering upside momentum.
However, the Relative Strength Index (RSI) near 39 still reflects only modest demand after the recent pullback. Hence, it will be prudent to wait for some follow-through buying and a sustained strength beyond the 38.2% Fibo. hurdle near 0.6950 before traders start positioning for any further near-term appreciating move for the AUD/USD pair. The 23.6% retracement at 0.7077 could act as the next notable barrier if buyers extend the advance.
On the downside, immediate support is seen at the 200-day SMA around 0.6869, followed by the 50.0% retracement near 0.6851. A convincing break below this area would expose deeper Fibonacci supports at 0.6750 and 0.6607 before the broader base around 0.6424.
(The technical analysis of this story was written with the help of an AI tool.)
AUD/USD daily chart
US Dollar Price Today
The table below shows the percentage change of US Dollar (USD) against listed major currencies today. US Dollar was the strongest against the New Zealand Dollar.
USD
EUR
GBP
JPY
CAD
AUD
NZD
CHF
USD
0.01%
0.05%
0.28%
0.06%
0.15%
0.34%
0.09%
EUR
-0.01%
0.04%
0.26%
0.05%
0.14%
0.33%
0.09%
GBP
-0.05%
-0.04%
0.22%
-0.02%
0.06%
0.30%
0.07%
JPY
-0.28%
-0.26%
-0.22%
-0.23%
-0.13%
0.04%
-0.11%
CAD
-0.06%
-0.05%
0.02%
0.23%
0.07%
0.29%
0.07%
AUD
-0.15%
-0.14%
-0.06%
0.13%
-0.07%
0.22%
-0.00%
NZD
-0.34%
-0.33%
-0.30%
-0.04%
-0.29%
-0.22%
-0.23%
CHF
-0.09%
-0.09%
-0.07%
0.11%
-0.07%
0.00%
0.23%
The heat map shows percentage changes of major currencies against each other. The base currency is picked from the left column, while the quote currency is picked from the top row. For example, if you pick the US Dollar from the left column and move along the horizontal line to the Japanese Yen, the percentage change displayed in the box will represent USD (base)/JPY (quote).
To provide the best experiences, we use technologies like cookies to store and/or access device information. Consenting to these technologies will allow us to process data such as browsing behavior or unique IDs on this site. Not consenting or withdrawing consent, may adversely affect certain features and functions.
Functional
Always active
The technical storage or access is strictly necessary for the legitimate purpose of enabling the use of a specific service explicitly requested by the subscriber or user, or for the sole purpose of carrying out the transmission of a communication over an electronic communications network.
Preferences
The technical storage or access is necessary for the legitimate purpose of storing preferences that are not requested by the subscriber or user.
Statistics
The technical storage or access that is used exclusively for statistical purposes.The technical storage or access that is used exclusively for anonymous statistical purposes. Without a subpoena, voluntary compliance on the part of your Internet Service Provider, or additional records from a third party, information stored or retrieved for this purpose alone cannot usually be used to identify you.
Marketing
The technical storage or access is required to create user profiles to send advertising, or to track the user on a website or across several websites for similar marketing purposes.