
The Indian rupee hovered around 94.7 per dollar, extending its recent losses as rising US Treasury yields strengthened the greenback and weighed on Asian currencies. Higher bond yields dampened demand for emerging-market assets, while renewed dollar buying and weaker regional currencies kept pressure on the rupee. Market sentiment remained cautious after stronger-than-expected US labor market data reinforced expectations that the Federal Reserve could keep interest rates higher for longer. Investors are now awaiting additional US employment data for further clues on the Fed’s policy outlook. Meanwhile, higher oil prices added another headwind for the currency, as firmer crude prices typically increase India’s import bill and demand for dollars. Oil gained support after a Qatari official said US envoys in Doha would not hold high-level talks with Iran, casting doubt on near-term diplomatic progress and reducing expectations of a potential increase in Iranian oil supplies.

South Korean Won Weakens Toward 17-Year Low
The South Korean won weakened to around 1,557 per dollar, approaching its weakest level since March 2009 near 1,560 touched earlier in June, as persistent foreign selling of local equities and broad demand for the US dollar weighed on the currency. Overseas investors remained net sellers of Korean stocks for an eighth consecutive session, extending a wave of capital outflows as global funds trimmed exposure to Korean technology shares. The won also came under pressure from a firmer US dollar after stronger-than-expected US labor market data pushed Treasury yields higher and reinforced expectations that the Federal Reserve could raise interest rates later this year. Meanwhile, South Korea reported record trade data for June, with exports surging 70.9% year-on-year to $102.25 billion, marking the first time monthly shipments exceeded $100 billion. The trade surplus widened to a record $36.15 billion, as semiconductor exports nearly tripled to $44.82 billion on robust AI-driven demand.

Offshore Yuan Falls on China Growth Concerns
The offshore yuan weakened to around 6.79 per dollar on Monday, reversing gains from the previous session as renewed concerns over China’s economic outlook weighed on sentiment. A private survey showed that the Manufacturing PMI eased to a three-month low of 51.7 from 51.8 in May. The reading followed stronger-than-expected official data showing the Manufacturing PMI rising to 50.3 in June from 50.0 in May, above forecasts of 50.1. Sentiment was also weighed down by an assessment from Goldman Sachs, which noted a more cautious tone among local clients regarding China’s near-term growth outlook, alongside concerns over weak consumer confidence, persistent labor market pressures, and the prolonged property downturn. The yuan’s weakness came even as the PBOC set the daily midpoint at 6.8067 per dollar, its strongest fixing in more than three years. Meanwhile, the EU’s trade chief and China’s commerce minister began talks in Brussels aimed at easing trade tensions.

Technical Analysis – EUR/USD
Since mid-April, the EUR/USD pair has been trending downward. Recently, new lows were set and the March lows were broken, confirming the dominance of the supply side. We are currently observing a local upward correction. The price is approaching a key short-term resistance level at 1.1430, where, among other things, the lows from mid-March of this year are located.
This is the first zone where increased selling activity may emerge. If the 1.1430 level were to be broken through on a sustained basis, the next significant resistance level would be around 1.1466, where the upper boundary of the 1:1 geometry and the 100-period moving average—marked in blue on the chart—are located. A bounce off both the 1.1430 and 1.1466 levels could trigger another downward wave.
Only a sustained break above the 1.1466 zone could invalidate the current setup and increase the chances of a larger upward correction. For now, however, the base case scenario remains a continuation of the downtrend.
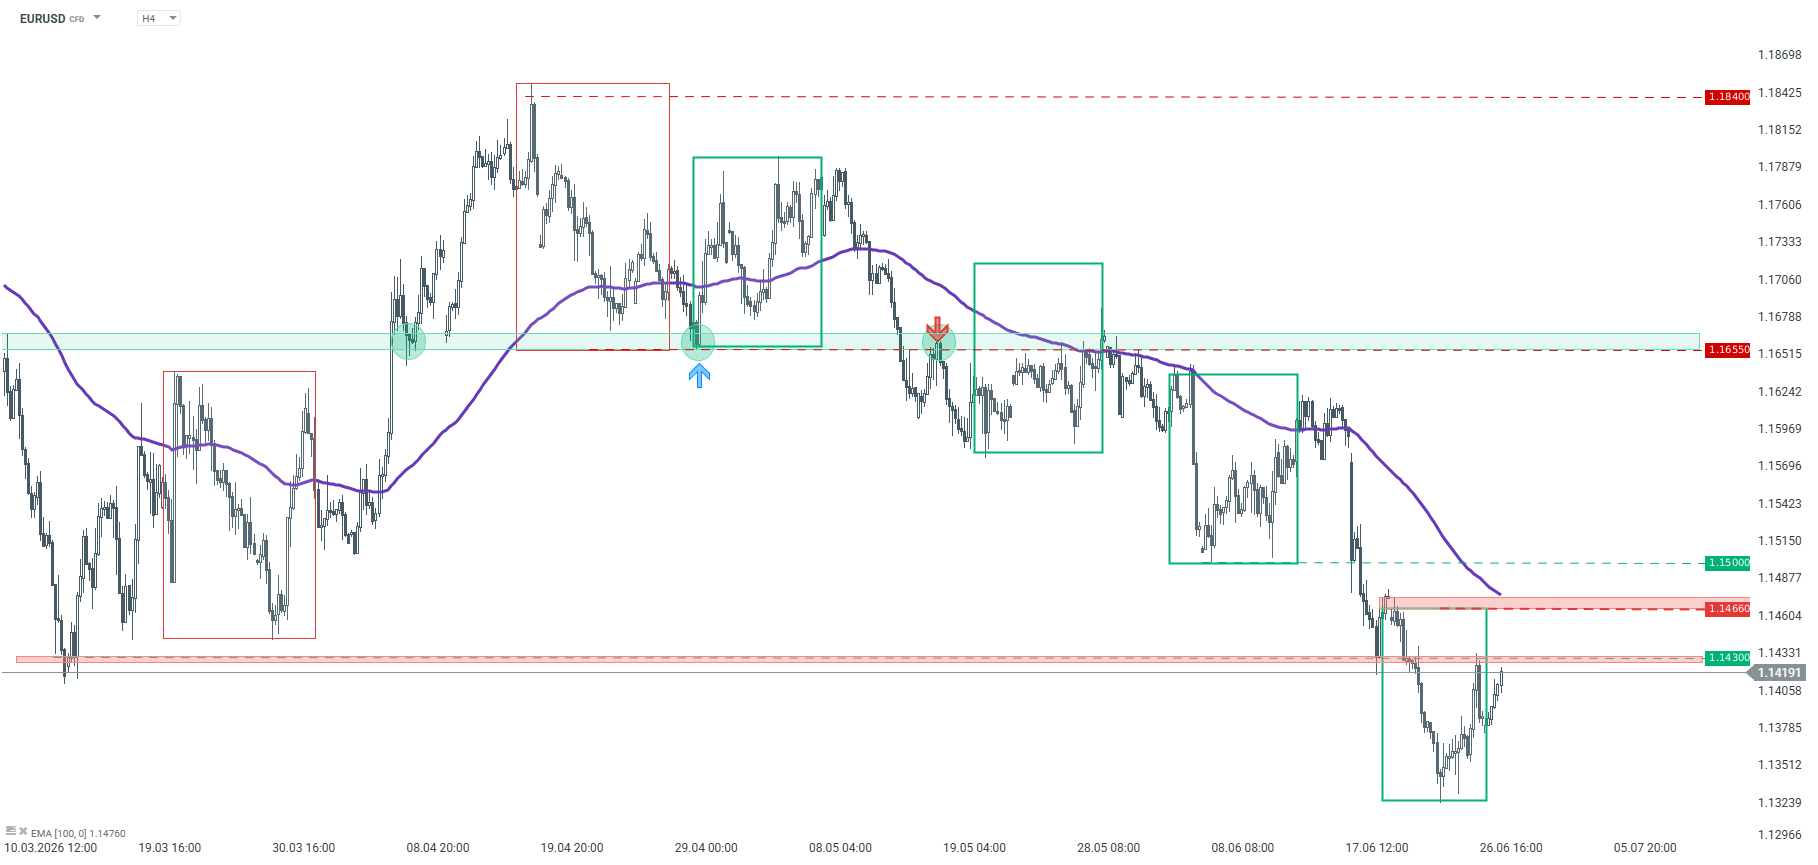
EURUSD – H4 timeframe. Source: xStation5

Indian Rupee ticks down against US Dollar, US data in focus
- The Indian Rupee edges down against the US Dollar as investors shift focus to an array of US data.
- Lower oil prices continue to limit the downside in the Indian Rupee.
- FIIs turned out to be net sellers on Monday.
The Indian Rupee (INR) opens slightly lower against the US Dollar (USD) on Tuesday. The USD/INR pair edges up to near 94.65 as the US Dollar trades firmly amid caution surrounding the United States (US) Nonfarm Payrolls (NFP) data for June, which will be released on Thursday.
At press time, the US Dollar Index (DXY), which gauges the Greenback’s value against six major currencies, trades 0.2% higher to near 101.32.
US NFP to be key trigger for global markets
The US NFP data always holds significant importance for the Federal Reserve’s (Fed) interest rate expectations. However, this time, its impact is expected to be higher as remarks from new Fed Chairman Kevin Warsh in his monetary policy conference this week showed that he would refrain from delivering forward-looking statements.
“Absent, also, is so-called forward guidance—which we agreed was not well suited to the current policy conjuncture,” according to the transcript of Fed Chairman Warsh’s Press Conference.
According to estimates, the US economy created 110K fresh jobs, lower than 172K in May. The Unemployment Rate remains steady at 4.3%.
In Tuesday’s session, investors will focus on the US JOLTS Job Openings data for May, which will be published at 14:00 GMT. The data is expected to show that employers posted 7.3 million fresh jobs, lower than 7.618 million in April.
This week, investors will also focus on the US ADP Employment Change and the ISM Manufacturing PMI data for June, which will be released on Wednesday.
Lower oil prices continue to offer support to Indian Rupee
Oil prices remaining lower due to the maintenance of a ceasefire between the US and Iran continue to support the Indian Rupee.
Currencies from economies, such as India, which rely heavily on oil imports to meet their energy needs, tend to outperform when oil prices remain lower.
Meanwhile, Iran continues to demand recognition of its authority near the Strait of Hormuz, a critical chokepoint to almost 20% of global energy supply, for which it is in talks with Oman.
On Monday, Iranian Deputy Foreign Minister Kazem Gharibabadi stated in a post on X, formerly known as Twitter, that Tehran has concluded a meeting with Oman in which it reviewed current issues related to the Hormuz, and also exchanged views on the future management of the waterway.
FIIs remain net sellers in Indian stock market on Monday
Foreign Institutional Investors (FIIs) continue to pare their stake in the Indian stock market even as lower oil prices have improved India Inc.’s earnings projections. On Monday, FIIs remained net sellers, offloading their stake worth Rs. 1,350.10 crore.
Technical Analysis: USD/INR trades in tight range inside Descending Triangle
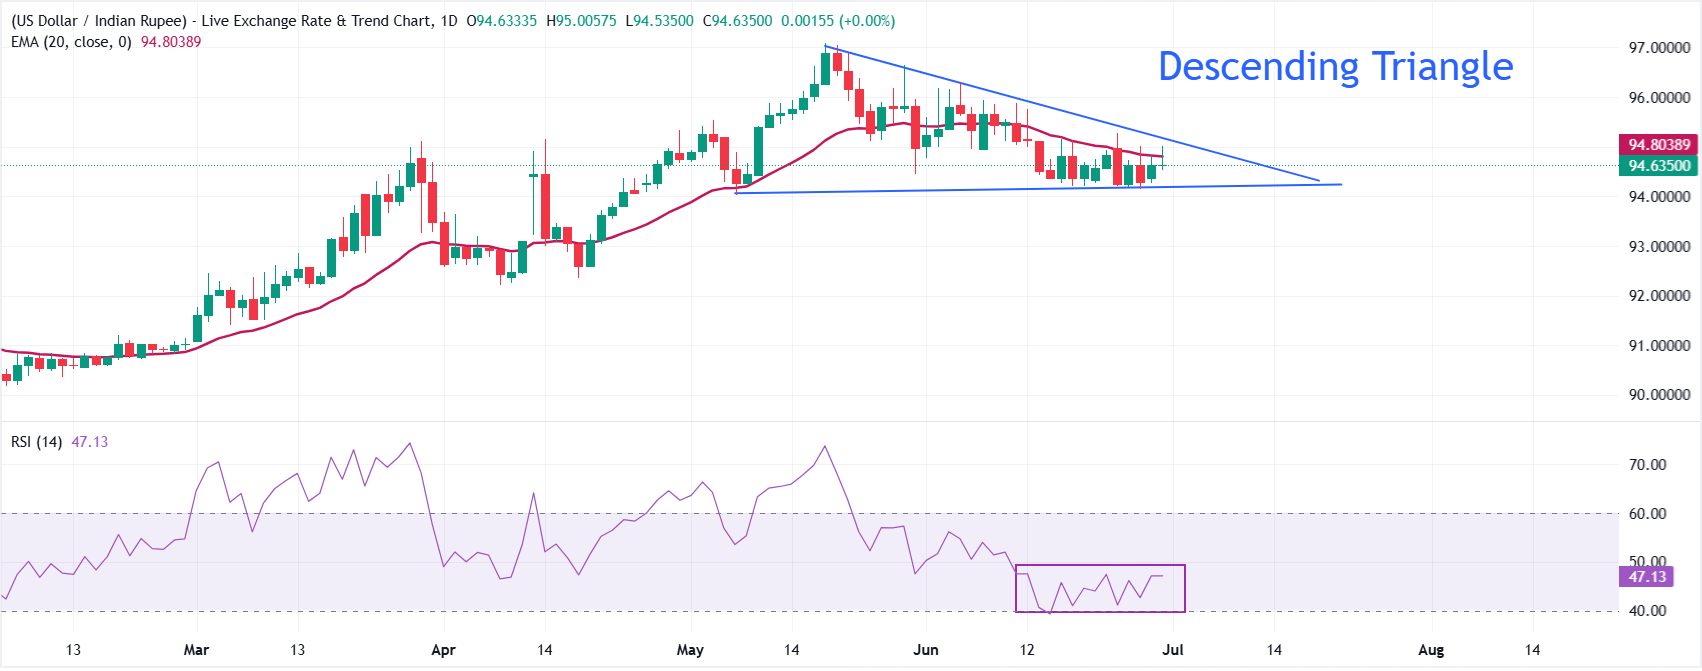
USD/INR trades at around 94.65, keeping a bearish near-term tone as it holds beneath the 20-period Exponential Moving Average (EMA) at 94.80 and the downward-sloping border of the Descending Triangle formation, whose break level sits at 95.18.
The exchange rate has slipped back into the lower half of the recent range, while the Relative Strength Index (RSI) at 47 suggests neutral-to-soft momentum rather than outright oversold conditions, hinting that downside pressure persists but without capitulation.
On the topside, immediate resistance is seen at the 20-period EMA at 94.80, followed by the downtrend-line break level at 95.1822, with the origin of that bearish line near 97.0285 acting as a more distant cap. On the downside, the horizontal border of the above-mentioned chart pattern at around 94.00 is the key support zone; a break below that would expose the pair to the April 15 high at 93.47.

GBP/USD Price – Retreats from one-week top as USD firms; 1.3300 holds the key
- GBP/USD meets with a fresh supply and snaps a three-day winning streak to a one-week high.
- The US-Iran uncertainty and elevated Fed rate hike expectations help revive the USD demand.
- The mixed technical setup warrants some caution before placing aggressive directional bets.
The GBP/USD pair attracts some sellers during the Asians session on Tuesday and reverses a part of the previous day’s strong move up to a one-week top. Spot prices, for now, seem to have snapped a three-day winning streak and currently trade around the 1.3235-1.3230 region, down nearly 0.20% for the day.
The US Dollar (USD) regains some positive traction amid mixed signals on US-Iran talks and firming expectations that the US Federal Reserve (Fed) will hike interest rates in 2026. Furthermore, the UK political uncertainty ahead of a leadership contest is seen as undermining the British Pound (GBP) and exerting some downward pressure on the GBP/USD pair.
From a technical perspective, the recent repeated failures near the 200-period Simple Moving Average (SMA) on the 4-hour chart favor bearish traders. Moreover, spot prices retain a negative bias below the 1.3300 mark, though momentum indicators suggest that upside attempts could persist while the broader structure is still constrained by the overhead supply zone.
In fact, the Relative Strength Index (RSI) hovers near 54 while the Moving Average Convergence Divergence (MACD) histogram remains modestly positive. Hence, any further decline is more likely to find a decent support near the 1.3200 mark, below which the GBP/USD pair could aim to retest the year-to-date low, around the 1.3140 region, and decline further.
On the topside, initial resistance is located near the 1.3300 round figure, which is followed by the 200-period SMA at 1.3366. A sustained strength above this barrier would start to ease the broader bearish bias and open the way for a more convincing recovery phase, though a failure would leave the GBP/USD pair vulnerable to resume its downtrend.
(The technical analysis of this story was written with the help of an AI tool.)
GBP/USD 4-hour chart
US Dollar Price Today
The table below shows the percentage change of US Dollar (USD) against listed major currencies today. US Dollar was the strongest against the Euro.
| USD | EUR | GBP | JPY | CAD | AUD | NZD | CHF | |
|---|---|---|---|---|---|---|---|---|
| USD | 0.28% | 0.19% | 0.16% | 0.16% | 0.21% | -0.02% | 0.24% | |
| EUR | -0.28% | -0.09% | -0.15% | -0.16% | -0.08% | -0.31% | -0.05% | |
| GBP | -0.19% | 0.09% | -0.04% | -0.08% | 0.02% | -0.21% | 0.03% | |
| JPY | -0.16% | 0.15% | 0.04% | 0.00% | 0.05% | -0.16% | 0.07% | |
| CAD | -0.16% | 0.16% | 0.08% | -0.00% | 0.03% | -0.17% | 0.08% | |
| AUD | -0.21% | 0.08% | -0.02% | -0.05% | -0.03% | -0.20% | 0.07% | |
| NZD | 0.02% | 0.31% | 0.21% | 0.16% | 0.17% | 0.20% | 0.23% | |
| CHF | -0.24% | 0.05% | -0.03% | -0.07% | -0.08% | -0.07% | -0.23% |
The heat map shows percentage changes of major currencies against each other. The base currency is picked from the left column, while the quote currency is picked from the top row. For example, if you pick the US Dollar from the left column and move along the horizontal line to the Japanese Yen, the percentage change displayed in the box will represent USD (base)/JPY (quote).

USD/CAD Price – Holds gains above 1.4200, bullish trend intact despite overbought signals
- USD/CAD gains momentum to near 1.4235 in Tuesday’s early European session.
- The pair keep the bullish vibe, but further consolidation cannot be ruled out with the overbought RSI.
- The first upside barrier emerges at 1.4310; the initial support level to watch is 1.4169.
The USD/CAD pair trades in positive territory around 1.4235 during the early European trading hours on Tuesday. The growing chances of Federal Reserve (Fed) interest rate hikes and optimism about the US economy provide some support to the US Dollar (USD) against the Canadian Dollar (CAD).
The key US jobs data for June will be in the spotlight later on Thursday. This report could give traders a greater sense of how accurately markets are pricing the chances of Fed rate hikes this year. Money markets showed traders fully expect one rate hike this year, with a roughly 50% chance of a second, according to LSEG data.
Crude oil prices have edged lower following a 60-day interim ceasefire agreement between the US and Iran. Traders will closely monitor the US-Iran peace talks in Doha, Qatar, later in the day. Positive developments surrounding the ceasefire deal could drag the crude oil prices lower. It is worth noting that Canada is a major oil-exporting country, and lower crude oil prices generally have a negative impact on the Canadian Dollar (CAD).
Technical Analysis:
In the daily chart, USD/CAD remains in a bullish near-term bias as spot holds above the 100-day Simple Moving Average (SMA) and the Bollinger middle band, reinforcing an underlying uptrend. The Relative Strength Index (14) stands at 82.4 sits in overbought territory, hinting that the latest advance could be stretched.
On the topside, immediate resistance is located at the Bollinger upper band at 1.4310, where buyers may hesitate to extend gains. On the downside, initial support is seen at the June 26 low of 1.4169, followed by the Bollinger middle band around 1.4068, before deeper demand emerges at the lower band near 1.3825 and the 100-day SMA at 1.3793, which together mark a more substantial structural floor.
