- DXY printed a fresh 13-month high this week after a hawkish FOMC pushed markets toward pricing a 2026 rate hike.
- The move is driven by rate differentials, not a growth scare, as the Fed out-hawks a stalling field of peers.
- Next week’s combined GDP and PCE print is the validation test for the rally.
The US Dollar Index (DXY) spent the back half of this week doing something most desks had written off six months ago: rallying on the prospect of a Federal Reserve (Fed) rate hike. The index pushed to a fresh 13-month high before easing back; the move owed less to safe-haven flight than to a cold read on rate differentials. With the Federal Open Market Committee (FOMC) leaning hawkish at its June meeting, the Greenback has become the cleanest way to play the only major central bank still willing to tighten into an energy shock.
A yield gap, not a panic
Underneath the geopolitical noise, the Dollar’s bid is a yield story. The Fed has parked itself in a higher-for-longer posture while the field around it has stalled or blinked. The Bank of England (BoE) and the Swiss National Bank (SNB) both held this week, with the Greenback taking its largest gains against the Pound and the Franc. Even the European Central Bank (ECB), which delivered its first hike since 2023, is tightening defensively into a contracting economy rather than a strong one; that distinction is the entire trade.
Warsh pulls the guidance rug
New Fed Chair Kevin Warsh used his first meeting to do less, not more. The Committee held at 3.75% as expected; the updated dot plot told the real story, with the rate projections revised higher across the board and the median now embedding a hike bias for the year. Warsh himself declined to signal the next move, leaning instead on the line that inflation has sat above target for years and that restoring price stability comes first. Markets took the hint and ran: pricing on CME FedWatch now leans toward a hike by the autumn, with inflation forecasts revised higher on the back of the Middle East conflict. A central bank that refuses to promise cuts, in a world where everyone else is cornered, is a powerful tailwind for its currency.
The number that settles it
Every bar of this rally is implicitly long the hawkish-Fed thesis, which means next week hands the Dollar its first real audit. Thursday delivers a rare double-header at 12:30 GMT: the third estimate of first-quarter Gross Domestic Product (GDP) lands alongside the May Personal Consumption Expenditures Price Index (PCE), the Fed’s preferred inflation gauge. The growth print is seen confirming 1.6%, down from the initial 2.0%; the spotlight therefore falls on PCE. Core PCE is already pencilled in to accelerate to 0.3% MoM from 0.2%, which means even an in-line print stamps reacceleration onto core inflation; an upside surprise, coming after May headline Consumer Price Index (CPI) leapt above 4% YoY, would cement the hike pricing and send the index back to test its highs. A soft one would expose how much good news is already in the price.
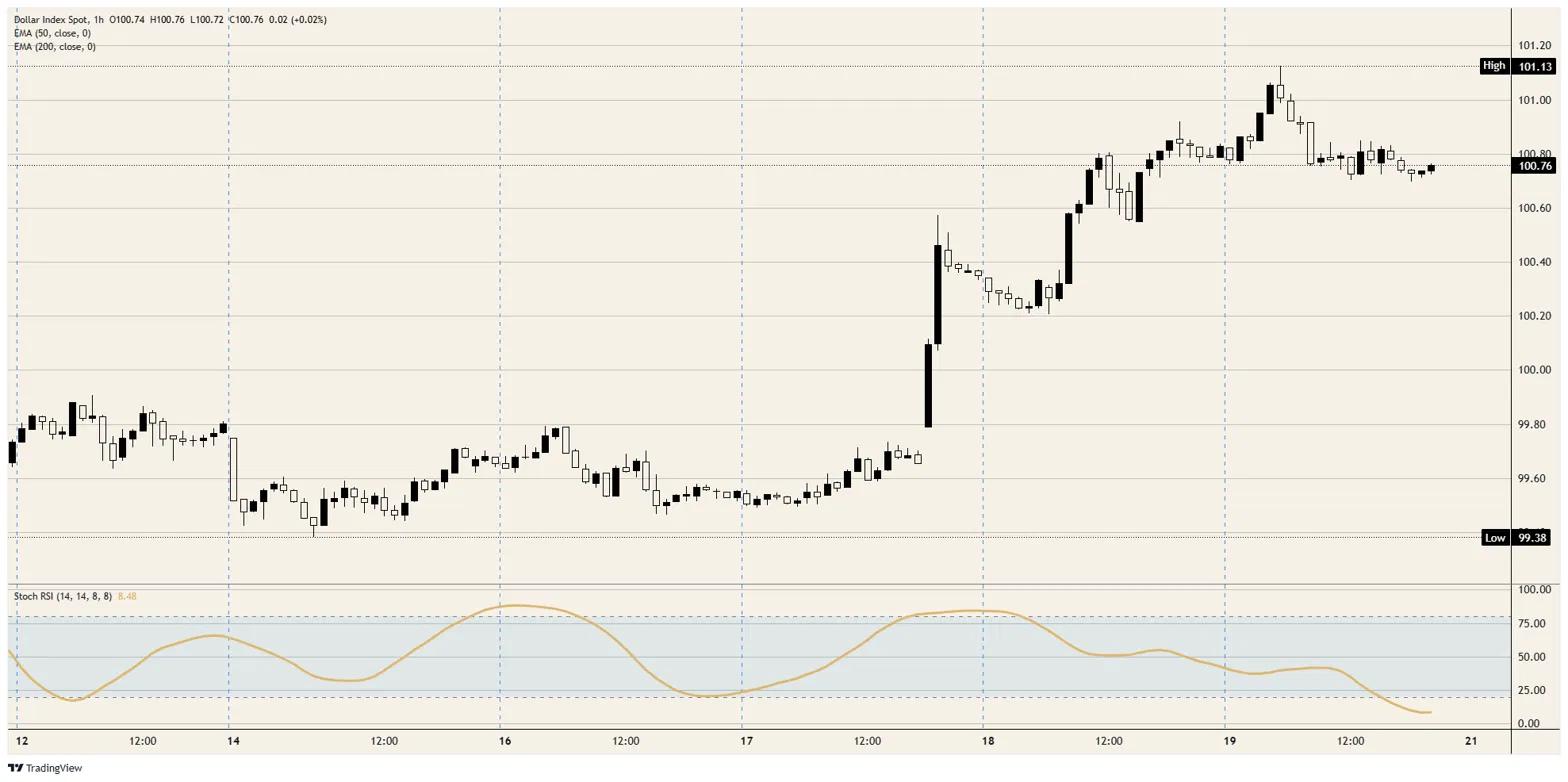
Resistance: The 101.00 round figure caps the immediate upside, with this week’s 13-month peak just above it; a clean break opens room toward 102.00.
Support: Initial support sits near 100.50, then the psychological 100.00 handle; below that, the 50-day and 200-day Exponential Moving Average (EMA) cluster near 99.00 marks where the trend would come into question. The hourly Stochastic Relative Strength Index (Stoch RSI) is washed out near oversold, which argues the current dip is a pause rather than a turn.
Bias: Bullish while the index holds above 100.00 and the hawkish-Fed narrative survives next week’s data. A hot PCE keeps the path toward 102.00 open; a downside inflation surprise is the one catalyst that turns this stretched-but-intact rally into a deeper pullback toward 99.00.
US Dollar Index hourly chart