Currency Hedger No Comments

Canadian Dollar weakens despite higher oil prices

  • USD/CAD rises as the US Dollar holds gains amid renewed geopolitical tensions in the Strait of Hormuz.
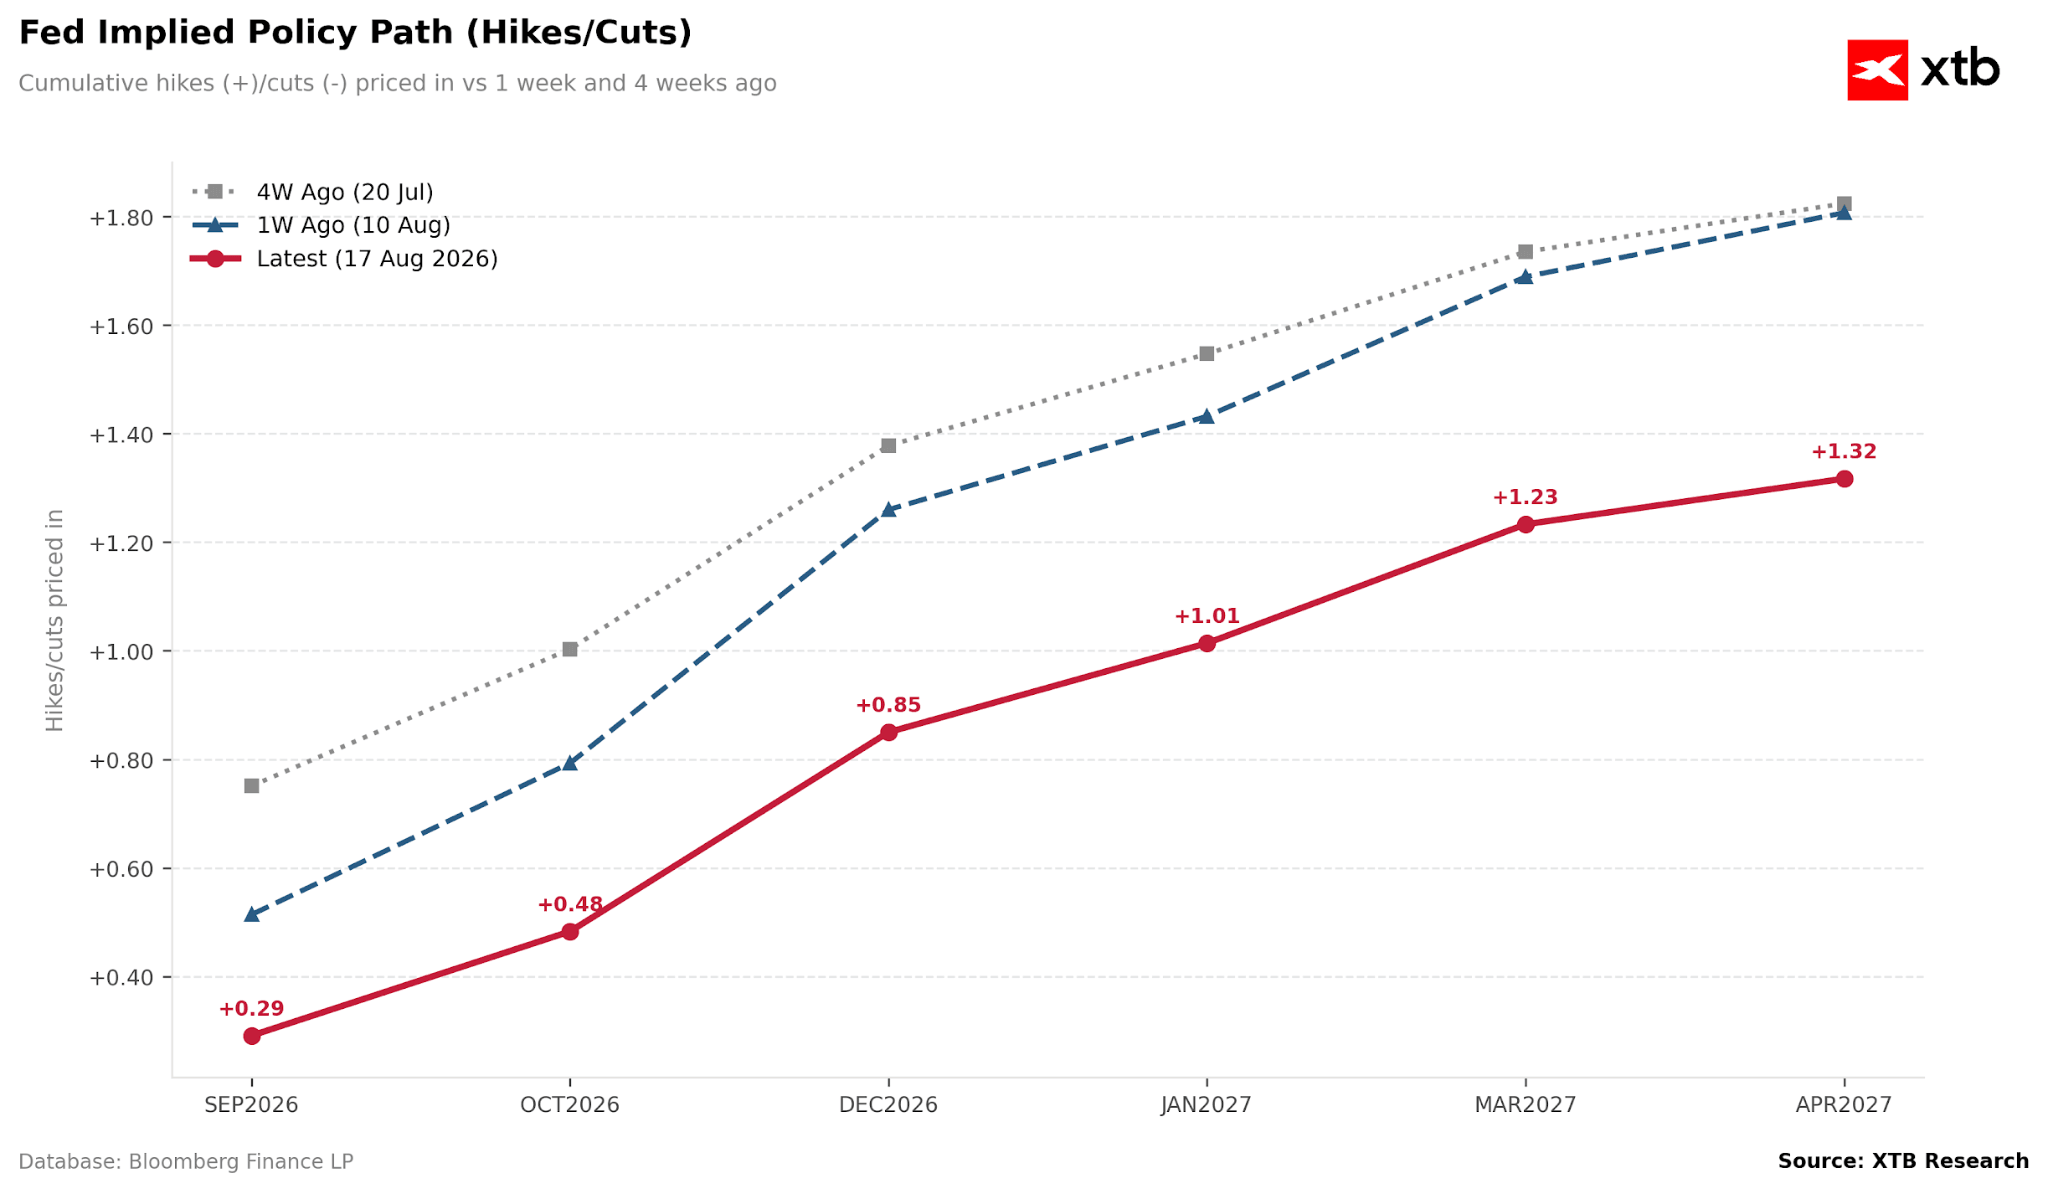
  • The Greenbackโ€™s upside could be restrained as traders price out any Fed rate hike for this month and September.
  • The commodity-linked Canadian Dollar may gain support from higher oil prices.

USD/CAD gains ground for the third successive day, trading around 1.4210 during the European hours on Tuesday. The pair appreciates as the US Dollar (USD) holds ground, which could be attributed to the renewed geopolitical tensions in the Strait of Hormuz.

However, the upside of the Greenback could be restrained as traders price out any Federal Reserve rate hikes this month and in September. This shift in sentiment followed a cooling employment report that revealed fewer jobs added across April, May, and June than Wall Street had anticipated.

Furthermore, a recent drop in crude oil prices, driven by an OPEC+ production boost and a US-Iran peace deal, has alleviated broader inflationary pressures, softening the urgency for an aggressive Fed policy outlook.

The upside of the USD/CAD pair could be capped as the commodity-linked Canadian Dollar (CAD) gains support from higher oil prices. Although Canada is a major crude exporter, lower oil prices diminish foreign capital inflows, ultimately weighing on the loonie dollar.

West Texas Intermediate (WTI) oil price gains ground after registering modest losses in the previous day, trading around $69.40 per barrel at the time of writing. Crude oil prices received a temporary boost following reports that Iran fired at least two missiles at commercial vessels transiting the strategic waterway late Monday.

While two ships sustained significant damage, no casualties were reported. Separately, the UK Maritime Trade Operations (UKMTO) confirmed that a southbound tanker was struck on its port side by an unknown projectile, which ignited a fire on board.

Currency Hedger No Comments

USD/CHF Price – Resistance at 0.8075 remains in focus as dips find buyers

  • USD/CHF remains bid above 0.8050, with 0.8075 resistance under pressure.
  • The Swiss Franc remains on the back foot after the downbeat Swiss employment report released on Monday.
  • Technically, the pair is in an A-B-C correction, following a 5-wave bullish cycle.

The US Dollar (USD) trades higher for the second consecutive day against the Swiss Franc (CHF). Downdside attempts remain shallow so far, amid a calm market mood, and the immediate trend shows a mild bullish stance, with resistance at the 0.8075 area under pressure.

On the macroeconomic front, data from the Swiss National Bank revealed that Foreign Currency Reserves rose to CHF759 billion in June, from CHF 711 billion in May. 

The Swissie, however, remains weighed by the downbeat employment figures released on Monday, which showed that the Unemployment Rate rose to a five-year high of 3.1%. Later in the day, the US ISM Services Purchasing Managers Index (PMI) met expectations with solid growth in activity, while the S&P Global Services PMI revealed an unexpected slowdown.

Technical Analysis: Looking for direction above 0.8050

Chart Analysis USD/CHF

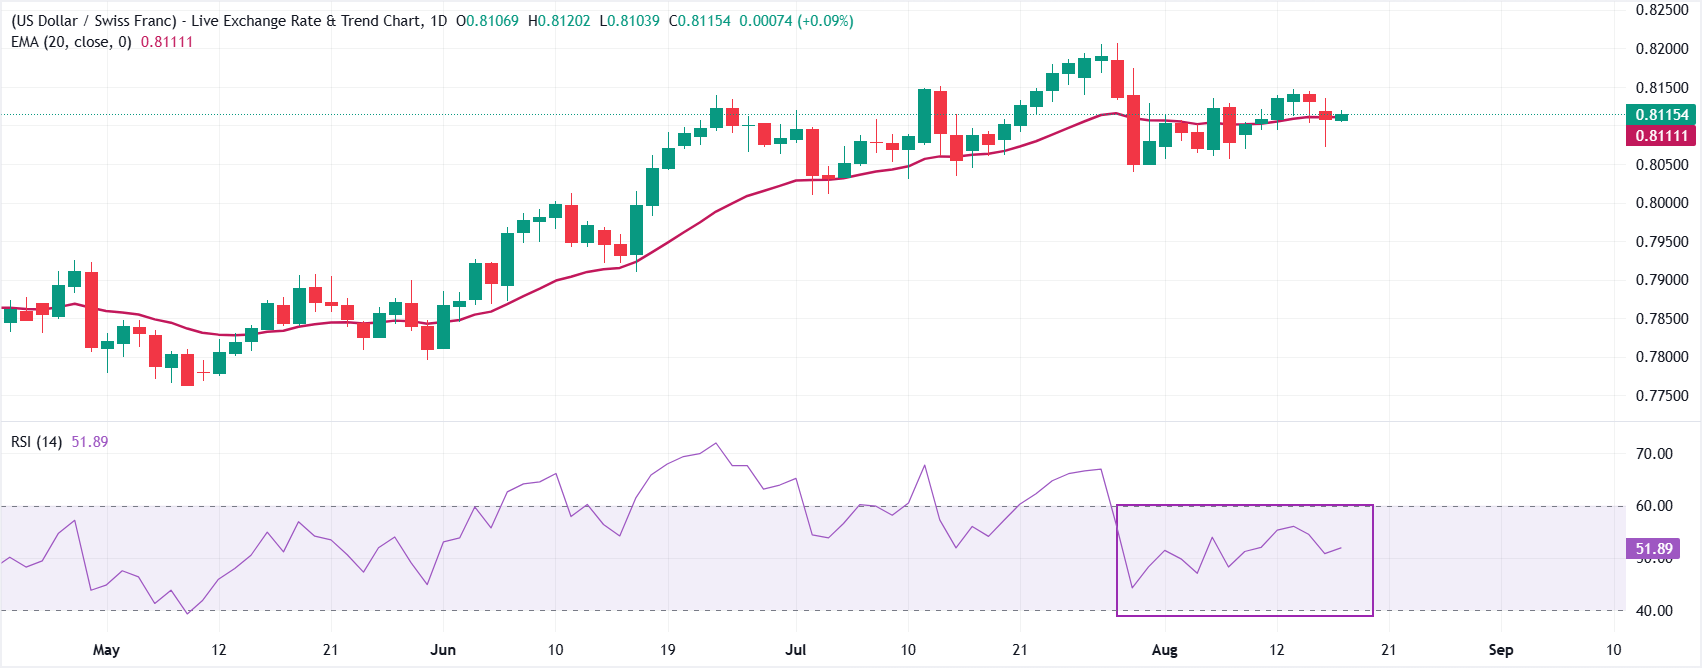
USD/CHF is in a corrective phase after completing a 5-wave (Elliot Wave) bullish cycle, with momentum indicators showing mixed signals. The daily chart reflects a constructive Relative Strength Index (14), near 58, while the Moving Average Convergence Divergence (MACD) has slipped marginally into negative territory.

Bulls need to break resistance around 0.8075 (June 26, 30 lows and July 6 high) to confirm the completion of the corrective phase, and shift focus towards the late June and early July highs, between 0.8120 and 0.8135.

On the downside, a bearish reaction below 0.8045 session lows would add pressure towards Friday’s trading floor at the 0.8010 area. If this level gives way, an A-B=C-D correction would target the 61.8% Fibonacci retracement off the bullish run, just above 0.7900.

Swiss Franc Price This week

The table below shows the percentage change of Swiss Franc (CHF) against listed major currencies this week. Swiss Franc was the strongest against the Japanese Yen.

USDEURGBPJPYCADAUDNZDCHF
USD0.10%-0.23%0.37%0.17%-0.06%0.39%0.43%
EUR-0.10%-0.36%0.26%0.04%-0.13%0.25%0.28%
GBP0.23%0.36%0.50%0.39%0.23%0.61%0.63%
JPY-0.37%-0.26%-0.50%-0.24%-0.32%0.02%0.02%
CAD-0.17%-0.04%-0.39%0.24%-0.10%0.27%0.24%
AUD0.06%0.13%-0.23%0.32%0.10%0.38%0.41%
NZD-0.39%-0.25%-0.61%-0.02%-0.27%-0.38%0.02%
CHF-0.43%-0.28%-0.63%-0.02%-0.24%-0.41%-0.02%

The heat map shows percentage changes of major currencies against each other. The base currency is picked from the left column, while the quote currency is picked from the top row. For example, if you pick the Swiss Franc from the left column and move along the horizontal line to the US Dollar, the percentage change displayed in the box will represent CHF (base)/USD (quote).

Currency Hedger No Comments

Offshore Yuan Extends Fall

The offshore yuan depreciated to around 6.80 per dollar on Tuesday, extending losses from the previous session and hitting a one-week low as investors weighed the latest outlook for China’s economy. The World Bank projected China’s economic growth to slow to 4.4% in 2026 and 4.3% in 2027, citing a prolonged property market downturn and subdued consumer spending. Meanwhile, the government also set its 2026 GDP growth target at 4.5%โ€“5.0%, the lowest since 1991 and the first downward revision since 2023, after maintaining a target of around 5% over the previous three years. Separately, the PBoC announced measures to strengthen Hong Kong’s role as an offshore yuan hub. These include more than doubling the RMB Business Facility to 500 billion yuan, raising the annual Southbound Bond Connect quota to 800 billion yuan from 500 billion yuan, and pledging support for more yuan-denominated commodity products following the launch of a new gold clearing system in Hong Kong backed by major banks.

Currency Hedger No Comments

EUR/USD Price – Turns broadly sideways below 20-day EMA

  • EUR/USD edges down to near 1.1433 as the US Dollar ticks higher.
  • The FOMC Minutes of the June meeting will be the major driver for the US Dollar this week.
  • The ECB seems to be following the Fedโ€™s footsteps, refusing to deliver remarks on the monetary policy outlook.

The EUR/USD pair trades marginally lower at around 1.1433 during the European trading session on Tuesday. The major currency pair faces slight selling pressure as the US Dollar (USD) edges up, while investors await the release of the Federal Open Market Committee (FOMC) minutes of the June policy meeting on Wednesday.

At press time, the US Dollar Index (DXY), which gauges the Greenbackโ€™s value against six major currencies, trades slightly higher to near 100.92.

Investors keep an eye on the FOMC Minutes to identify reasons probably responsible for restricting policymakers from delivering forward guidance on monetary policy decisions.

In the June monetary policy press conference, Fed Chairman Kevin Warsh said that policymakers agreed that the โ€œso-called forward guidance is not well suited to the current policy conjuncture.

Like the Fed, officials from the European Central Bank (ECB) also appear not in favor of delivering remarks regarding the monetary policy outlook.

Over the weekend, ECB Governing Council member Emmanuel Moulin also denied providing cues regarding the central bankโ€™s decision in July, while speaking at the Rencontres Economiques conference in Aix-en-Provence. โ€œWe are not doing forward guidance so I wonโ€™t say what we will do in July,โ€ Moulin said.

EUR/USD technical analysis

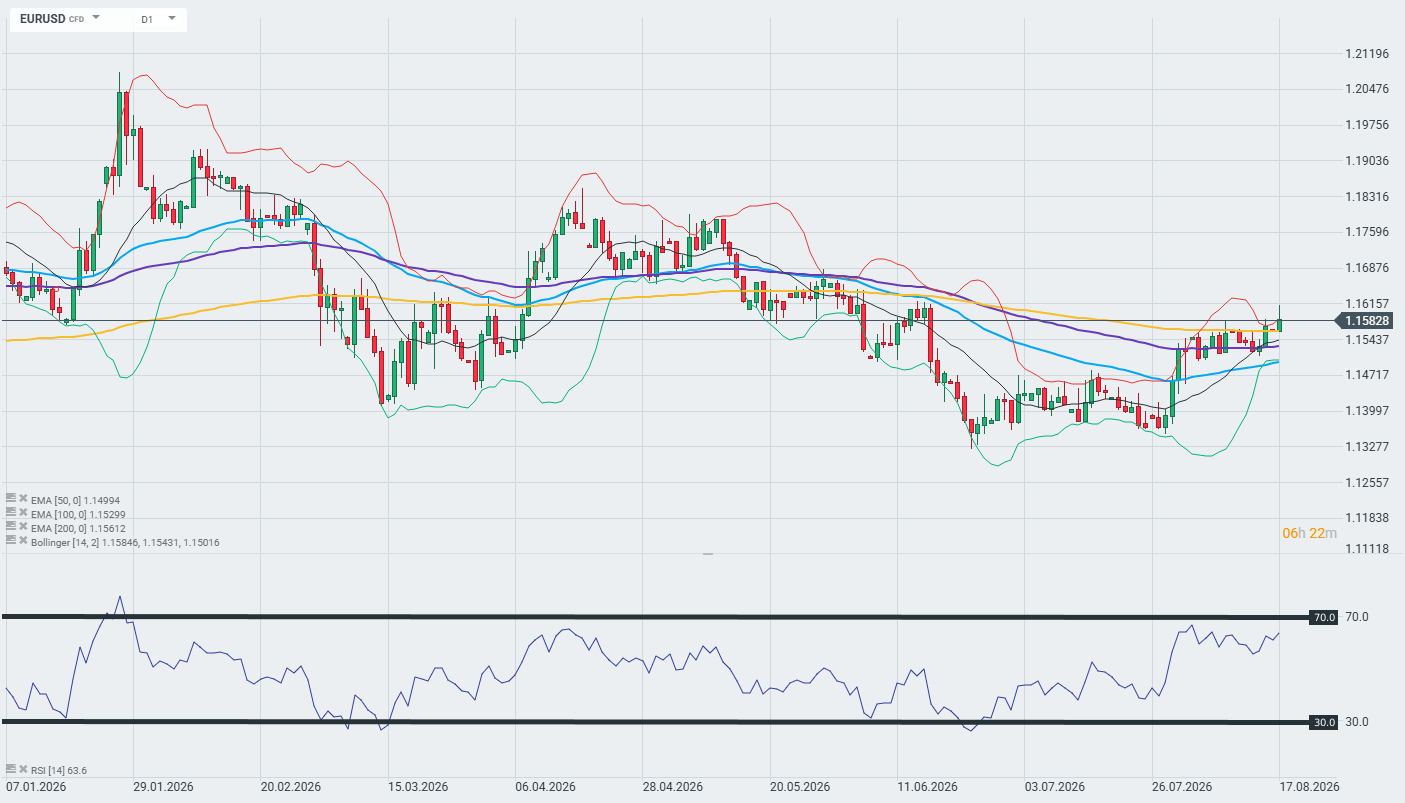
EUR/USD trades lower at around 1.1430, keeping a bearish near-term tone as the pair holds beneath the 20-day exponential moving average (EMA) at 1.1460. The fact that price remains under this short-term trend gauge suggests rallies are still being capped, while the Relative Strength Index (14) at 41.9 stays below the neutral 50 line, hinting at lingering downside pressure rather than a decisive recovery.

On the topside, immediate resistance is located at the 20-day EMA around 1.1460, and a sustained break above this level would be needed to ease the current bearish bias and open the way for a stronger rebound. Looking up, the pair could advance to the psychological level of 1.1500 if it breaks above the moving average.

On the downside, the yearly low around 1.1330 will be the key support zone; a break below it would expose the pair to the 29 May 2025 low at 1.1210.

Currency Hedger No Comments

NZD remains subdued as US Dollar gains on renewed Hormuz tensions

  • NZD/USD falls as a steady US Dollar draws support from renewed geopolitical tensions in the Strait of Hormuz.
  • Traders expect the Fed to keep rates unchanged this month and in September.
  • ING anticipates the RBNZ will implement a 25-basis-point rate hike to 2.50% this Wednesday.

NZD/USD inches lower for the second successive day, trading around 0.5700 during the Asian hours on Tuesday. The currency pair depreciates as the US Dollar (USD) holds ground, which could be attributed to the renewed geopolitical tensions in the Strait of Hormuz.

Bloomberg reported, citing a United States (US) official, that Iran fired at least two missiles at commercial vessels transiting the strategic waterway late Monday. While two ships sustained significant damage, no casualties were reported. Separately, the UK Maritime Trade Operations (UKMTO) confirmed that a southbound tanker was struck on its port side by an unknown projectile, which ignited a fire on board.

Market participants scaled back expectations for Federal Reserve rate hikes this month and in September. This shift in sentiment followed a cooling employment report that revealed fewer jobs added across April, May, and June than Wall Street had anticipated. Furthermore, a recent drop in crude oil prices, driven by an OPEC+ production boost and a US-Iran peace deal, has alleviated broader inflationary pressures, softening the urgency for an aggressive Fed policy outlook.

Despite a sharp collapse in oil prices, ING anticipates the Reserve Bank of New Zealand (RBNZ) will implement a 25-basis-point “insurance” rate hike to 2.50% on Wednesday. However, the firm cautions that the tightening could be a one-off move, offering little sustained upward momentum for the New Zealand Dollar (NZD).

Currency Hedger No Comments

AUD/USD – Eases from two-week top; 38.2% Fibo. near 0.6955 holds the key

  • AUD/USD attracts sellers after a modest Asian session uptick to a two-week high.
  • The mixed technical setup warrants caution before placing fresh directional bets.
  • A move beyond the 38.2% Fibo. is needed to back the case for a meaningful upside.

Theย AUD/USDย retreats slightly from the 0.6960 area, or a two-week high, touched during the Asian session on Tuesday, and, for now, seems to have snapped a three-day winning streak. The intraday downtick, however, lacks bearish conviction, warranting caution before confirming that a one-week-old recovery move from a three-month low has run out of steam.

From a technical perspective, the AUD/USD pair, so far, has been struggling to make it through the 38.2%ย Fibonacciย retracement level of the November 2025-May 2026 rally. Furthermore, mixed momentum oscillators make it prudent to wait for a sustained move beyond the said barrier before positioning for an extension of the recent bounce from the very important 200-day Simple Moving Average (SMA) support near 0.6870.

In fact, the Moving Average Convergence Divergence (MACD) has turned slightly positive, hinting at a slight improvement in the upside momentum. However, the Relative Strength Index (RSI) near 42 suggests only modest directional pressure, consistent with a consolidative bias around current levels, warranting some caution for aggressive bullish traders as renewed tensions in the Strait of Hormuz support the US Dollar.

Meanwhile, initial support emerges at the 50% retracement at 0.6853, ahead of a deeper structural floor at the 61.8% Fibo. near 0.6752, with 0.6608 and 0.6425 marking subsequent retracement and cycle-low supports if selling extends. On the topside, a break above the 38.2% Fibo. at 0.6954 would open the way toward the 23.6% retracement barrier at 0.7079, while the cycle high around 0.7282 stands as a more distant objective should bullish momentum gain traction.

AUD/USD daily chart

Chart Analysis AUD/USD

Australian Dollar Price Last 7 Days

The table below shows the percentage change of Australian Dollar (AUD) against listed major currencies last 7 days. Australian Dollar was the strongest against the Canadian Dollar.

USDEURGBPJPYCADAUDNZDCHF
USD-0.13%-0.99%-0.10%0.04%-0.83%-0.85%-0.25%
EUR0.13%-0.88%0.04%0.15%-0.71%-0.66%-0.12%
GBP0.99%0.88%0.93%1.01%0.15%0.21%0.75%
JPY0.10%-0.04%-0.93%0.17%-0.69%-0.64%-0.18%
CAD-0.04%-0.15%-1.01%-0.17%-0.87%-0.80%-0.28%
AUD0.83%0.71%-0.15%0.69%0.87%-0.01%0.59%
NZD0.85%0.66%-0.21%0.64%0.80%0.01%0.51%
CHF0.25%0.12%-0.75%0.18%0.28%-0.59%-0.51%

The heat map shows percentage changes of major currencies against each other. The base currency is picked from the left column, while the quote currency is picked from the top row. For example, if you pick the Australian Dollar from the left column and move along the horizontal line to the US Dollar, the percentage change displayed in the box will represent AUD (base)/USD (quote).

Currency Hedger No Comments

Japanese Yen strengthens amid looming intervention risks; lacks bullish conviction

  • USD/JPY drifts lower during the Asian session, though the downside potential seems limited.
  • The wide US-Japan rate differential might continue to weigh on the JPY and support the pair.
  • Economic risks due to Hormuz tensions further warrant some caution for aggressive JPY bulls.

The USD/JPY pair extends the previous day’s late pullback from the vicinity of mid-162.00s and attracts some follow-through sellers during the Asian session on Tuesday. Spot prices drop to the 161.70-161.65 region in the last hour, though the downside remains cushioned in the absence of any intervention by Japanese authorities and a supportive fundamental backdrop.

Reports last week suggested that Japanese officials are abandoning their traditional habit of telegraphing intervention risks and are starting to focus on targeting speculators. The immediate market reaction, however, seems to have faded as no action has been taken yet. Moreover, the wide gap in borrowing costs between Japan and other major economies, including the US, keeps the so-called carry trade in play and continues to undermine the Japanese Yen (JPY) amid economic risks stemming from Middle East tensions.

In fact, a maritime agency reported that an oil tanker was struck by an unidentified projectile while transiting through the critical Strait of Hormuz. This comes on top of the US-Iran standoff over the idea of Iran charging vessels for using the strait and adds to worries that Japan’s economy will remain under strain due to the continued disruption of energy supplies. Moreover, concerns about the sustainability of the fragile US-Iran peace deal benefit the US Dollar’s (USD) relative safe-haven status and support the USD/JPY pair.

On the economic data front, Japan’s nominal wages – or total cash earnings – rose 3.2% in May, slightly slower โ€‹than a revised 3.6% gain in the previous month. Meanwhile, real wages rose 1.4% from a year earlier to mark a fifth consecutive month โ€‹of increases, though the growth rate slowed amid โ€Œre-accelerating consumer inflation. Furthermore, Household Spending in Japan fell for the sixth straight month, by 0.4% YoY in May. This might complicate the BoJ’s policy tightening path and backs the case for further JPY depreciation.

Meanwhile, reduced bets for interest rate hikes by the US Federal Reserve (Fed) act as a headwind for the USD and might keep a lid on any meaningful upside for the USD/JPY pair. Nevertheless, the aforementioned fundamental backdrop suggests that any corrective pullback might still be seen as a buying opportunity and remain limited. Hence, it will be prudent to wait for strong follow-through selling before confirming that spot prices have topped out in the near-term, as traders now look to FOMC Minutes on Wednesday.

Japanese Yen Price Today

The table below shows the percentage change of Japanese Yen (JPY) against listed major currencies today. Japanese Yen was the strongest against the Canadian Dollar.

USDEURGBPJPYCADAUDNZDCHF
USD-0.03%-0.04%-0.16%0.04%-0.04%-0.07%-0.01%
EUR0.03%-0.03%-0.15%0.05%0.00%-0.03%0.01%
GBP0.04%0.03%-0.11%0.09%0.04%-0.00%0.05%
JPY0.16%0.15%0.11%0.20%0.13%0.09%0.15%
CAD-0.04%-0.05%-0.09%-0.20%-0.08%-0.09%-0.05%
AUD0.04%-0.00%-0.04%-0.13%0.08%-0.04%0.02%
NZD0.07%0.03%0.00%-0.09%0.09%0.04%0.05%
CHF0.00%-0.01%-0.05%-0.15%0.05%-0.02%-0.05%

The heat map shows percentage changes of major currencies against each other. The base currency is picked from the left column, while the quote currency is picked from the top row. For example, if you pick the Japanese Yen from the left column and move along the horizontal line to the US Dollar, the percentage change displayed in the box will represent JPY (base)/USD (quote).

Currency Hedger No Comments

GBP gains as easing Fed hike bets weigh on US Dollar

  • GBP/USD rises as the US Dollar struggles after soft US data prompts markets to scale back Fed rate hike bets.
  • Fed policy outlook softens as a cooling employment report and dropping crude oil prices ease inflationary pressures.
  • The British Pound may face headwinds as markets slash expectations from two interest rate hikes down to just a 70% chance of one.

GBP/USD continues its winning streak for the ninth consecutive day, trading around 1.3390 during the Asian hours on Tuesday. The currency pair rises as the US Dollar (USD) faces headwinds as market participants scale back expectations for Federal Reserve (Fed) rate hikes this month and in September. This shift in sentiment followed a cooling employment report that revealed fewer jobs added across April, May, and June than Wall Street had anticipated.

Furthermore, a recent drop in crude oil prices, driven by an OPEC+ production boost and a US-Iran peace deal, has alleviated broader inflationary pressures, softening the urgency for an aggressive Fed policy outlook.

The Greenback could find baseline support from hawkish remarks by Federal Reserve (Fed) Governor Christopher Waller and resilient domestic economic data.

Waller underscores flexible forward guidance and firm 2% inflation pledge

Fedโ€™s Waller delivers a moderately stronger-than-usual performance, with a 7.1/10 FXS Speechtracker score compared to the established baseline of 6.4/10, emphasizing both the usefulness and the pitfalls of forward guidance. The focus on forward guidance as a โ€œvaluable toolโ€ that can accelerate policy transmission, yet becomes a hindrance when too rigid or when facing multiple plausible economic paths, signals a preference for more flexible communication and reinforces the importance of a well-understood reaction function. Wallerโ€™s insistence on the credibility of the 2% inflation pledge, rejection of keeping rates low to aid deficit financing, and preference for an inflation target range (without changing the current target) collectively lean hawkish for the Dollar, even without explicit comments on the near-term outlook.

The FXS Fed Sentiment Index rose by 1.83 points to 125.72, confirming a move further into hawkish territory relative to the neutral 100 benchmark. This upward shift, aligned with the above-baseline FXS Speechtracker score, suggests markets will read Wallerโ€™s remarks as reinforcing the Fedโ€™s anti-inflation stance and limiting expectations for policy accommodation, a backdrop that tends to support the Dollar against other major currencies.

Although business activity in the United States (US) services sector cooled slightly, it remained firmly in expansionary territory, with the June ISM Services Purchasing Managersโ€™ Index (PMI) printing at 54.0 in line with consensus estimates. Within the sub-components of the report, the Prices Index dipped from 71.3 to 67.7, while the Employment Index saw a notable improvement, climbing out of contractionary territory from 47.9 to 51.2.

On the other side of the equation, the British Pound (GBP) could face its own pressures as markets lowered expectations for Bank of England (BoE) tightening. Investors are now pricing in just a 70% chance of a single rate hike this year, a sharp decline from the two increases anticipated just a few weeks ago.

While BoE Governor Andrew Bailey recently confirmed that inflation remains on track to hit the bank’s 2% target, he acknowledged it would take longer than previously forecast and firmly ruled out any imminent rate cuts.

This cautious approach follows the BoE’s June 18 monetary policy meeting, where officials voted 7-2 to hold the benchmark interest rate at 3.75%. Although the status quo is maintained, the hawkish camp has doubled since April, with two dissenting voters pushing for an immediate hike to 4.00%.

While UK inflation currently sits at 2.8%, the central bank’s internal projections indicate it could bounce back above 3% by autumn due to delayed war-era energy cost pass-throughs, leading major sell-side institutions to forecast the next rate hike around late 2026.