

The Indian rupee weakened to 95.7 per dollar, retreating from recent gains to its lowest level in over four weeks, as renewed tensions in the Middle East sent crude oil prices sharply higher. Sentiment deteriorated amid renewed concerns over India’s trade balance after Iran expanded its attacks to Qatar and the UAE following fresh US strikes on Iran. US President Donald Trump declared that the ceasefire was over, fueling fears of further supply disruptions. Brent crude surged more than 4% to $79.28 per barrel, increasing pressure on the rupee. Investors also monitored the Reserve Bank of India’s response, with market participants expecting the central bank to continue supporting the currency through dollar sales as higher oil prices threaten to fuel inflation. Meanwhile, traders closely watched the impact of rising oil-driven inflation concerns on US Treasury yields as markets assessed the implications of the latest strikes and counter-strikes on global energy supplies.

Offshore Yuan Slips on Stronger Dollar
The offshore yuan weakened to around 6.78 per dollar on Monday, retreating from a near three-week high reached in the previous session as escalating tensions in the Middle East boosted demand for safe-haven assets. The US dollar strengthened as surging oil prices revived expectations that the Federal Reserve may need to keep monetary policy tighter for longer, following a weekend of intensified clashes between the US and Iran and continued uncertainty over shipping through the Strait of Hormuz. However, the yuan’s losses were partly tempered by the People’s Bank of China’s midpoint fixing of 6.7972 per dollar, its strongest since February 10, 2023, although it was set 122 pips weaker than Reuters’ estimate. Investors are now awaiting a raft of key Chinese economic data due later this week, including trade figures, Q2 GDP, industrial production, retail sales, and unemployment data.

Canadian Dollar edges lower as US launches new wave of strikes against Iran
- USD/CAD drifts higher to around 1.4165 in Monday’s Asian session.
- The US launched a new wave of strikes against Iran aimed at ‘degrading’ the military.
- The BoC is likely to hold the rate steady on Wednesday.
The USD/CAD pair gains traction to near 1.4165, snapping the four-day losing streak during the Asian trading hours on Monday. The US Dollar (USD) strengthens against the Canadian Dollar (CAD) amid lingering tensions regarding the US-Iran conflict. The US June Consumer Price Index (CPI) inflation report will be the highlight later on Tuesday.
The US military carried out multiple attacks across Iran, saying they were aimed at “degrading” Tehran’s ability to disrupt commercial vessels in the Strait of Hormuz, per Bloomberg. The Islamic Revolutionary Guard Corps (IRGC) then launched retaliatory drone and missile assaults on US allies across the Middle East, including Kuwait, Jordan, Qatar, Bahrain, and Jordan.
Over the weekend, Iran stated that the Strait of Hormuz would now be closed “until further notice.” Signs of escalating tensions in the Middle East could boost a safe-haven currency such as the Greenback against the CAD in the near term.
On the other hand, a stronger-than-expected Canadian jobs report could provide some support to the Loonie. Data released by Statistics Canada on Friday showed that Canada’s economy added 18.2K jobs in June, continuing the momentum in the job market seen the month before. This figure followed a rise of 87.8K in May and was above the market consensus of 10K. The Unemployment Rate fell to 6.5% in June from 6.6% in May, better than the expectation of 6.6%.
The Bank of Canada (BoC) is anticipated to hold its overnight rate at 2.25% at its July policy meeting on Wednesday and keep it there well into next year as price pressures remain largely contained and the economy gradually recovers, a Reuters poll showed.

EUR/JPY Price Edges higher above 184.50, but stays capped by clustered resistance
- EUR/JPY gains momentum to near 184.65 in Monday’s Asian session.
- The cross keeps a bearish vibe in the near term, with the RSI holding below the midline.
- The first upside barrier emerges in the 184.80-184.85 zone; the initial support level is seen at 183.53.
The EUR/JPY cross trades in positive territory around 184.65 during the Asian trading hours on Monday. However, the potential upside for the cross might be limited as heightened geopolitical tensions in the Middle East could boost a safe-haven currency.
Furthermore, speculation over domestic asset shifts could underpin the Japanese Yen (JPY) against the Euro (EUR). Japan’s Finance Minister Satsuki Katayama said on Friday that the government is pursuing measures that would include the Government Pension Investment Fund (GPIF) to make “substantially greater investments in Japanese financial assets. Analysts said this move could offer greater support to the battered currency than intervention.
Technical Analysis:
In the daily chart, EUR/JPY keeps a mildly bearish near-term tone as spot holds beneath the 100-day Simple Moving Average (SMA) and the Bollinger Bands’ 20-day middle line. The pair is drifting in the lower half of the recent volatility envelope, with the lower Bollinger band acting as the next downside reference, while the Relative Strength Index (RSI) at 47.6 hovers just under the neutral 50 line, hinting at subdued, consolidative downside pressure rather than a strong trend.
On the topside, initial resistance emerges in the 184.80-184.85 zone, representing the Bollinger 20-day middle band and the 100-day SMA. A daily close above this clustered band would be needed to ease the current downside bias and expose the upper Bollinger band near 186.12. On the downside, the first notable support is the lower Bollinger band at 183.53, where buyers could attempt to slow the decline; a break below this level would reinforce the bearish bias and open the door to a deeper corrective slide.

EUR/USD – Flag breakdown supports more downside towards 1.1325
- EUR/USD trades lower at around 1.1390 as the US Dollar strengthens.
- Increased aggression between the US and Iran has improved the US Dollar’s safe-haven demand.
- Investors await Fed Chair Warsh’s testimony and the US CPI data.
The Euro (EUR) holds opening losses at around 1.1390 against the US Dollar (USD) during the mid-Asian trading session on Monday. The major currency pair faces selling pressure as the US Dollar starts the week on a strong note due to an increase in the appeal of safe-haven assets.
At press time, the US Dollar Index (DXY), which gauges the Greenback’s value against six major currencies, trades 0.2% higher to near 101.15.
Escalating military actions between the United States (US) and Iran over Tehran showing dominance over the Strait of Hormuz, a critical chokepoint to almost 20% of global energy supply, have forced investors to shift to the safe-haven fleet and have de-anchored inflation expectations.
To get cues regarding the current status of US inflation, investors will pay close attention to the Consumer Price Index (CPI) data for June, which will be released on Tuesday.
This week, investors will also focus on Federal Reserve (Fed) Chair Kevin Warsh’s two-day testimony before Congress starting on Tuesday.
Technical Analysis:
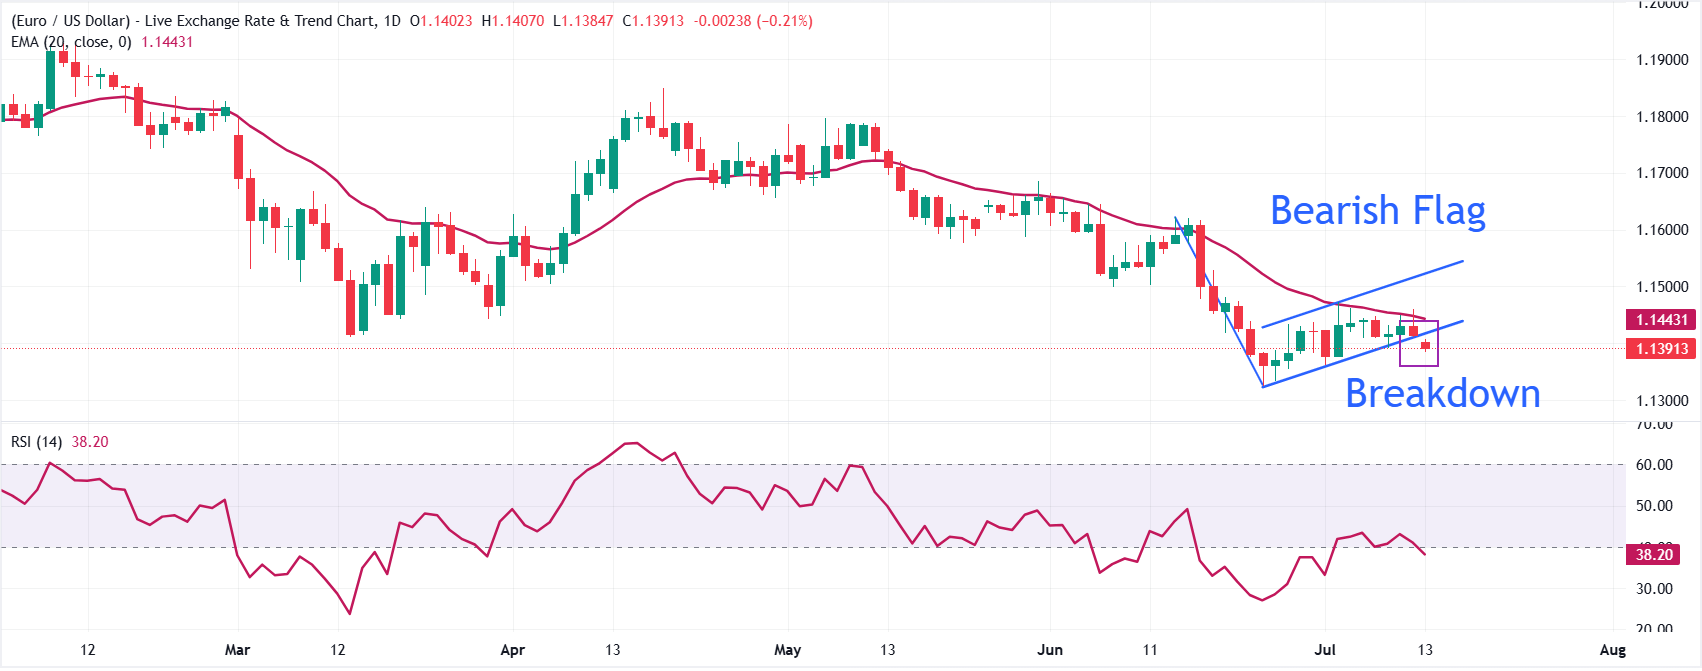
EUR/USD trades lower at around 1.1390, keeping a bearish near-term tone as spot holds beneath the 20-period Exponential Moving Average (EMA) at 1.1443 and a breakdown of the Bearish Flag formation.
The Relative Strength Index (14) hovers near 38, hinting at persistent but not extreme downside momentum.
On the topside, initial resistance is aligned with the lower boundary of the parallel channel near 1.1424, followed by the 20-period EMA at 1.1443, with the channel top around 1.1530 acting as a stronger cap if a rebound extends. On the downside, major support levels are the June 24 low at 1.1324, followed by 1.1300.

Swiss Franc weakens as US Dollar rises on safe-haven demand
- USD/CHF gains as the US Dollar gains on increased safe-haven demand.
- US CENTCOM launched fresh Sunday strikes to weaken Iran’s capability to target civilian vessels in the waterway.
- Swiss weak data permits SNB rate cuts or currency interventions to weaken the Franc.
USD/CHF gains ground for the second successive day, trading around 0.8100 during the Asian hours on Monday. The pair appreciates as the US Dollar rises on increased safe-haven demand amid heightened geopolitical tensions in the Middle East. According to Bloomberg, the US Central Command (CENTCOM) launched additional strikes on Sunday evening, aimed at weakening Iran’s capability to target civilian vessels navigating the waterway.
Reuters reported that US forces have hit more than 300 Iranian targets over a three-night span, including 140 on Saturday alone, while Washington and Tehran issued conflicting declarations regarding whether the strait remains open to maritime traffic.
Additionally, the US Dollar receives support from escalating US-Iran missile strikes, which pushed oil higher and sparked fears of inflation and higher Federal Reserve (Fed) interest rates. The US Consumer Price Index (CPI) inflation data will be eyed on Tuesday for further clues on the Federal Reserve’s (Fed) policy outlook. The headline CPI is expected to decline by 0.1% MoM in June, while the core CPI is projected to show a rise of 0.3% during the same period.
Traders expect the Fed to deliver one more interest-rate increase before the year concludes. Meanwhile, all eyes will be on Fed Chair Kevin Warsh as he makes his first official appearance before the US Congress this Tuesday.
Switzerland’s consumer confidence index dropped to -36 in June 2026, down from -32 in June 2025 and slightly worse than the market forecast of -35. With domestic sentiment deeply negative and Swiss inflation remaining highly contained, flatlining month-on-month at just 0.5% annually in June, the Swiss National Bank (SNB) faces zero pressure to raise interest rates. If anything, weak data keeps the door wide open for the SNB to cut interest rates or intervene in the foreign exchange market to intentionally weaken the franc. This makes the CHF less attractive to yield-seeking investors.

Australian Dollar Hovers Near 3-Month Lows
The Australian dollar hovered around $0.693, extending the previous week’s roughly 0.2% loss to trade near three-month lows as persistent Middle East tensions weighed on global risk sentiment. The US launched another wave of strikes on Iran over the weekend in response to an attack on a container ship in the Strait of Hormuz, while Tehran retaliated by targeting US military facilities across the Middle East. Meanwhile, hawkish rhetoric from the Reserve Bank of Australia helped limit the Aussie’s losses. RBA Assistant Governor Sarah Hunter said last week that the board will act as needed to return inflation to its target, warning some tightening may be required if the oil shock lifts inflation expectations. Markets currently price around a 60% chance of one more rate hike later this year, up from roughly 40% previously, though futures imply only a 19% odds of an August move. Traders now await key employment and inflation data due later this month for fresh clues on the policy outlook.

Dollar Gains on Fresh US-Iran Strikes
The dollar index climbed above 101 on Monday, rising for the second straight session as escalating tensions in the Middle East fueled safe-haven demand for the currency. The US and Iran exchanged fresh missile strikes over the weekend amid ongoing disputes over shipping through the Strait of Hormuz, pushing oil prices higher and reinforcing expectations of interest-rate hikes to contain inflation. Investors are also awaiting key US inflation data this week for further clues on the Federal Reserve’s policy outlook. Markets currently expect the Fed to deliver one rate increase before the end of the year. Minutes from the Fed’s June meeting, released last week, showed that a few policymakers saw a case for raising rates, though they ultimately supported keeping policy unchanged. Meanwhile, Fed Chair Kevin Warsh is scheduled to make his first appearance before the US Congress on Tuesday and Wednesday.
