Currency Hedger No Comments

New Zealand Dollar slips under safe-haven US Dollar surge

  • Safe-haven US Dollar gains on Middle East tensions despite Iran-Oman Strait of Hormuz shipping deal.
  • Mixed US economic data shows weak ADP payrolls but steady ISM Services PMI growth.
  • Softer New Zealand jobs data limits aggressive rate hike expectations ahead of September RBNZ meeting.

NZD/USD extends its losses for the second successive day, trading around 0.5870 during the European hours on Thursday. The pair depreciates as the US Dollar (USD) gains support from renewed safe-haven demand following an Israeli airstrike in southern Lebanon. The attack, which killed one person and injured 11, marked one of Israelโ€™s deadliest bombings since the June ceasefire began. Israel’s military issued a displacement order roughly 30 minutes prior to the strike, stating it was targeting and destroying Hezbollah infrastructure in response to the groupโ€™s violation of the ceasefire terms.

However, the Greenback could encounter headwinds as market participants weigh reports of a new maritime agreement between Iran and Oman. The two nations are finalizing a joint statement on a shipping route through the Strait of Hormuz, raising expectations for an increase in Middle Eastern energy flows. Although Tehran emphasized that the temporary two-to-four-month route does not mark a full reopening of the strategic waterway, the development has somewhat eased supply disruption fears.

US ADP private-sector payrolls rose by just 44,000 in July, a sharp drop from June’s revised 95,000 and well below the market forecast of 70,000. Conversely, the ISM Services PMI showed steady momentum, ticking up slightly to 54.1 in July from 54.0 in June, though it narrowly missed the expected 54.5 mark. Investors are now turning their attention toward upcoming economic drivers, specifically Thursday’s Initial Jobless Claims and Friday’s pivotal Nonfarm Payrolls (NFP) report.

Meanwhile, the New Zealand Dollar (NZD) faces challenges as a softer-than-expected labor market report reinforced expectations that any further interest rate increases would likely be gradual rather than aggressive. Nevertheless, markets continue to price in a quarter-point rate hike in September, following indications from the Reserve Bank of New Zealand’s (RBNZ) latest meeting that further policy tightening may be required to reduce monetary stimulus and bring inflation under control.

NZD and local yields slump as solid jobs data highlight lingering slack

Strategists at Brown Brothers Harriman observe that the New Zealand Dollar and local yields have come under pressure even as headline labour data surprise to the upside. They note that โ€œNZD and NZ yields slumpโ€ after โ€œNew Zealandโ€™s solid Q2 job and wage growthโ€ revealed underlying slack in the labour market. According to BBH, โ€œemployment surged 0.5% q/q vs. 0.1% in Q1, well above consensus and RBNZ projection of 0.1%, while private regular wages were up 0.7% q/q (consensus & RBNZ: 0.6%) vs. 0.5% in Q1,โ€ with these stronger readings masking ongoing labour market slack that continues to weigh on the currency and rates.

Technical Outlook: NZD/USD maintains a constructive bullish tone near 0.5900

In the daily chart, NZD/USD trades at 0.5870, maintaining a constructive bullish tone as spot holds above both the nine-day and 50-day Exponential Moving Averages (EMAs) at 0.5858 and 0.5810. The alignment of the shorter EMA above the longer one reinforces a nascent uptrend, while the 14-day Relative Strength Index (RSI) near 61 suggests firm but not yet overbought bullish momentum.

On the topside, initial resistance emerges at 0.5995, ahead of a stronger barrier at 0.6094, where sellers could attempt to cap further gains. On the downside, immediate support is provided by the nine-day EMA, followed by the 50-day EMA; a deeper setback would expose the horizontal floors at 0.5580 and 0.5486, levels that would need to hold to preserve the current bullish bias.

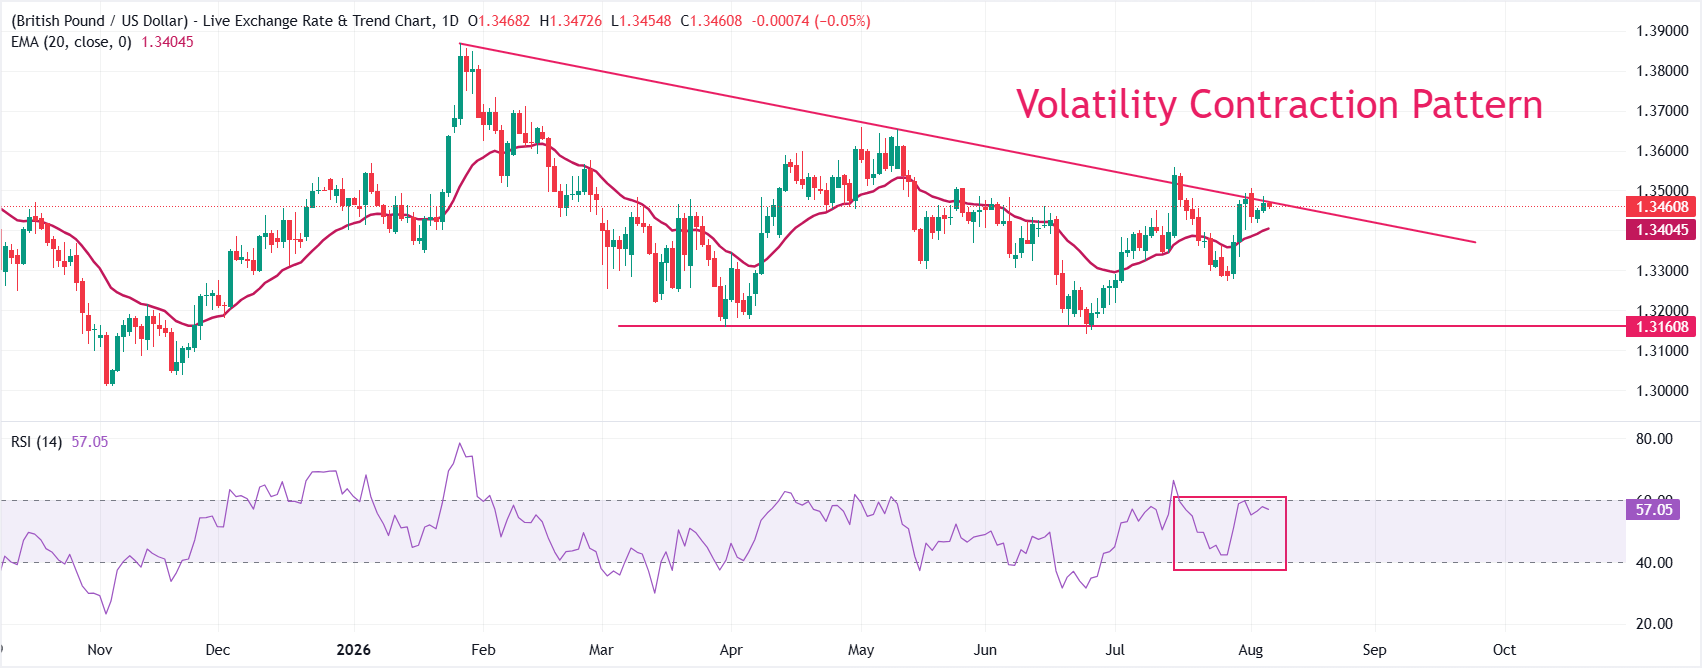
Chart Analysis NZD/USD
NZD/USD: Daily Chart
Currency Hedger No Comments

GBP/USD Price Forecast: Gathers strength for VCP breakout

  • GBP/USD edges down to near 1.3460 while investors shift their focus to the US NFP data.
  • The US official employment data will have a significant impact on the Fedโ€™s monetary policy outlook.
  • The Cable appears to be gathering strength for a decisive breakout of the VCP pattern.

The British Pound (GBP) trades marginally lower at around 1.3460 against the US Dollar (USD) during the European trading session on Thursday. The GBP/USD pair is expected to trade sideways as investors await the United States (US) Nonfarm Payrolls (NFP) data for July, which will be released on Friday.

US payrolls seen posting modest July gain as Deutsche Bank flags participation risks

Economists at Deutsche Bank expect Fridayโ€™s July payrolls report to show a further, if modest, improvement in hiring. They look for “employment growth of +65k, modestly above Juneโ€™s +57k reading”.

On the labor marketโ€™s slack, Deutsche Bank forecasts that “the unemployment rate is forecast to remain at 4.2%, although risks are skewed towards a rounding up to 4.3% if labor force participation rebounds after last monthโ€™s sharp decline.” Wage and hours data are expected to be steady, with “average hourly earningsโ€ฆ expected to increase by +0.3% month-on-month, unchanged from June, while average hours worked are forecast to hold at 34.3 hours.”

Investors will pay close attention to the US NFP data as it will influence market expectations for the Federal Reserveโ€™s (Fed) monetary policy outlook.

Ahead of the US NFP data for July, the ADP Employment Change data remained weaker-than-projected. On Wednesday, the ADP reported that the private sector created 44K jobs in July, fewer than estimates of 70K and the prior release of 98K.

Technical Analysis

GBP/USD trades at around 1.3460, keeping a mildly bullish near-term bias as spot holds above the 20-day exponential moving average (EMA) at 1.3404, but struggles to achieve a decisive breakout of the downward-sloping border of the Volatility Contraction Pattern (VCP) at around 1.3471.

The Relative Strength Index (RSI) around 57 shows constructive but not overextended momentum, suggesting scope for further gains as long as price stays supported on dips above the EMA.

On the topside, immediate resistance is located at the former trend line break price at 1.3471, and a decisive move above this barrier would open the way for a continuation of the recent upside. Looking up, the July 15 high at 1.3558 is the key hurdle. On the downside, initial support is seen at the 20-day EMA at 1.3404, followed by the July 28 low at 1.3274.

Currency Hedger No Comments

Australian Dollar eases from highs as the impact from Trade Balance figures fade

  • AUD/USD edges down from three-week lows at 0.7064 but maintains its near-term positive bias intact.
  • Australian Trade Balance showed an unexpected surplus in June as commodity exports surged.
  • The US Dollar is failing to find support from macroeconomic data this week.

The Australian Dollar (AUD) posts moderate losses against the US Dollar (USD) on Thursday, retreating to the 0.7040 area from three-week highs at 0.7064 on Wednesday. The pair, however, maintains its near-term bullish structure, with investors biding their time ahead of Fridayโ€™s key US Nonfarm payrolls report and awaiting clarity on the US-Iran negotiations.

Data from Australia released on Thursday was supportive, as Juneโ€™s Trade Balance revealed an unexpected surplus, with commodity exports jumping to four-year highs. Australiaโ€™s foreign trade posted an AUD 1.929 million surplus, against expectations of an AUD 1.1 million deficit, and following a downwardly revised deficit of AUD 2.367 million in May.

In the US, on the contrary, the ADP Employment Change disappointed on Wednesday, showing 44K net employment creation in July, less than half of Juneโ€™s  98K and well below the 70K market consensus. Later on Wednesday, the US ISM Services Purchasing Managersโ€™ Index showed healthy growth, but also short of the market expectations, with prices jumping and employment falling.

Dollar bulls remain capped as markets eye US payrolls

INGโ€™s FX strategists highlight that โ€œnews of a deal between Iran and Oman to open a safe shipping route in the Strait of Hormuz has kept the FX market in risk-on mode, favouring a rotation from the Dollar to higher-beta currencies.โ€ However, they stress that โ€œG10 moves have been contained this week, likely because tomorrowโ€™s US payrolls report remains the key catalyst and a notoriously difficult one to predict,โ€ keeping traders wary of aggressive positioning.

ING also points out that โ€œmarkets are also waiting for the next headlines on US-Iran negotiations.โ€ In their view, โ€œthere appears to be little pessimism left in FX markets, and positive headlines on that topic may not generate sustainable USD weakness.โ€ With โ€œpayrolls looming tomorrow,โ€ the bank expects that โ€œa wait-and-see stance may keep volatility contained and the Dollar broadly range-bound.โ€

Currency Hedger No Comments

USD/CHF Poised to extend gains beyond 0.8100 amid bullish setup

  • USD/CHF regains positive traction and snaps a two-day losing streak amid a modest USD uptick.
  • The formation of an ascending channel favors bulls and backs the case for further appreciation.
  • Corrective pullbacks could be bought into and remain limited near the trend-channel support.

The USD/CHF pair attracts some buyers near the 0.8060 region on Thursday amid a modest US Dollar (USD) uptick. Spot prices, for now, seem to have snapped a two-day losing streak and trade around the 0.8080-0.8085 region during the first half of the European session, up nearly 0.15% for the day.

From a technical perspective, the move up along an upward-sloping channel points to a well-established bullish trend. Adding to this, the recent breakout above the 0.8000 psychological mark supports prospects for a further near-term appreciation of the USD/CHF pair. Meanwhile, the Relative Strength Index (14) sits near a neutral 48.7, hinting at balanced momentum.

Moreover, the Moving Average Convergence Divergence (MACD) remains slightly negative, which only mildly tempers the constructive tone. Nevertheless, the setup suggests room for further gains before encountering a more significant cap. The USD/CHF pair is placed closer to the middle of the structure, with overhead supply defined by the channel top at 0.8219,

A daily close above this level would signal an acceleration of the uptrend and open the way to fresh highs within the broader bullish channel environment. On the downside, initial demand is located at the channel bottom around 0.7936, where a break would expose deeper support at the prior structural base near 0.7692 and would weaken the current bullish narrative.

USD/CHF daily chart

Chart Analysis USD/CHF
Currency Hedger No Comments

RBI leaves the Repo Rate unchanged at 5.25% in August, as expected

The Reserve Bank of Indiaโ€™s (RBI) Monetary Policy Committee (MPC) announced on Wednesday that it held the benchmark Repo Rate steady at 5.25% following the conclusion of the August monetary policy meeting.

The decision came in line with the market expectations.

Speeches from RBI Governor Sanjay Malhotra

West asia conflict continues to challenge global economy.Crude oil prices, currencies, financial markets remain volatile.

Global economic environment has become increasingly unstable.

MPC retains policy stance at ‘neutral.’

Headline inflation has edged up above target.

Higher inflation mostly on account on fuel, food with little signs of generalisation of price pressures so far.

Domestic economic activity has exhibited resilience.

There is need for greater clarity on inflation before taking policy action.

Supply side pressures from west asia conflict have eased somewhat.

Inflation not getting broad based, expected to decline after peaking in Q3FY27.

MPC underscored it will maintain close vigil, stay resolute on aligning inflation to target.

Investment activity remains steady.

Indian economy performed better than expected in Q1FY27.

Q3 FY27 CPI inflation seen at 5.9% (previously at 5.9%).

Q4 FY27 real GDP growth seen at 6.8%.

Q4 FY27 CPI inflation seen at 5.5%.

USD/INR reaction to the RBI interest rate decision

The Indian Rupee (INR) catches fresh offers and extends lower in an immediate reaction to the RBI interest rate decision. The USD/INR pair currently trades at 95.05, down 0.04% on the day. 


This section below was published on August 5 at 00:30 GMT as a preview of the Reserve Bank of India (RBI) interest rate decision.

  • The RBI is set to leave policy rates unchanged on Wednesday.
  • The Reserve Bank of India might retain the data-dependent approach for the monetary policy outlook.
  • Investors will closely track comments on FCNR deposits, inflation and the economic outlook.

The Reserve Bank of India (RBI) is set to announce its bi-monthly monetary policy decision on Wednesday at 10:00 AM IST (04:30 GMT), another meeting coming at a time when uncertainty remains high over the duration and economic fallout of the ongoing Middle East conflict.

RBI seen on hold as inflation remains within target band

Analysts at Commerzbank expect the Reserve Bank of India to maintain its current policy stance, noting that the RBI is โ€œexpected to leave the benchmark repurchase rate unchanged at 5.25% at its next meeting on 5 August.โ€ While they acknowledge that โ€œinflation risks remain tilted to the upside due to higher global commodity prices and a weaker monsoon season,โ€ Commerzbank highlights that the June Consumer Price Index (CPI) print โ€œrose 4.4% yoy, which was within RBI’s 2-6% target range,โ€ reinforcing the case for policy continuity in the near term.

The RBI is also expected to leave the Standing Deposit Facility (SDF) and the Marginal Standing Facility (MSF) rates unchanged at 5% and 5.5%, respectively.

According to the latest Reuters poll, 68 of the 72 economists expect the RBI to leave its policy rates at their current levels.

So far this year, the RBI has maintained the status quo at all three policy meetings and has kept rates unchanged since cutting the Repo Rate by 25 basis points (bps) to 5.25% in the December 2025 meeting.

What happened in the last meeting?

In the June policy meeting, the Indian central bank raised its inflation forecast, after leaving policy rates steady, for FY26-27 to 5.1% Year-on-Year (YoY) from 4.6% projected earlier, citing that higher input prices such as base metals, plastic and rubber, and rising commercial Liquefied Petroleum Gas (LPG) prices are putting upward pressure on overall prices.

The RBI also lowered its real Gross Domestic Product (GDP) growth forecast for the current year to 6.6% from its prior expectations of 6.9%.

On the monetary policy outlook, RBI Governor Sanjay Malhotra said that it is โ€œprudent to wait for greater clarity to emergeโ€ and the central bank will remain โ€œdata-dependentโ€.

Key things to watch

Investors will pay close attention to commentary from RBI Governor Malhotra regarding inflation and the economic outlook on the back of the ongoing geopolitical crisis.

In the last meeting, RBI Governor Malhotra acknowledged heightened global uncertainty amid geopolitical risks, and said that the extended disruption in global supply chains and higher energy prices have prompted risks both to inflation and growth. However, he assured that the economy is able to โ€œwithstand these shocks with minimum painโ€.

In an interview with Businessline, released last week, RBI Governor Malhotra made clear that price stability is their key priority, but policymakers donโ€™t see any signs of price pressures entrenching. โ€œOur primary mandate is inflation and price stability. Therefore, we will do whatever is required first, to keep price stability and then, to see to what extent we can support growth,โ€ Malhotra said.

Investors will also focus on commentary about Indiaโ€™s interest rate outlook. Analysts at Axis Bank say, “The MPC is โ€‹likely to shift language acknowledging risks of firmer inflation and policy action ahead, while maintaining a data-dependent approach.โ€

Financial markets would also be keen to know the performance of Foreign Currency Non-resident (FCNR) deposits, which were announced in the June meeting, aiming to increase the inflow of foreign funds to support forex reserves. The tool allows commercial banks to raise funds via foreign currency deposits whose โ€Œfull hedging cost is borne by the RBI.

India flows recover as DBS flags stronger debt, equity and FCNR(B) momentum

Analysts at DBS Group Research highlight that โ€œthe flows picture is, meanwhile, on the mend,โ€ pointing to a โ€œresumption in portfolio inflows into equity and debt markets as well as positive cues on the swap schemes.โ€ They note that โ€œJuly saw debt markets attract more than $2bn in inflows, bringing FYTD debt inflows to $7.7bn, while equities recorded $1.5bn worth flows following consecutive months of outflows.โ€

In addition, DBS cites comments from RBI Governor Malhotra, who said in an interview that โ€œbanks had mobilized a cumulative $32bn via the swap windows to-date, already surpassing the scale of inflows raised back in 2013.โ€ Against this backdrop, DBS reiterates that โ€œwe expect the scale of the FCNR(B) deposits, in particular, to pick up in second half of the schemeโ€™s validity period, as KYC/compliance requirements are completed,โ€ and cautions that โ€œat the current run-rate, our conservative estimate of $45-50bn of total inflows under the special schemes could be overshot.โ€

USD/INR technical outlook points to a mild bearish bias

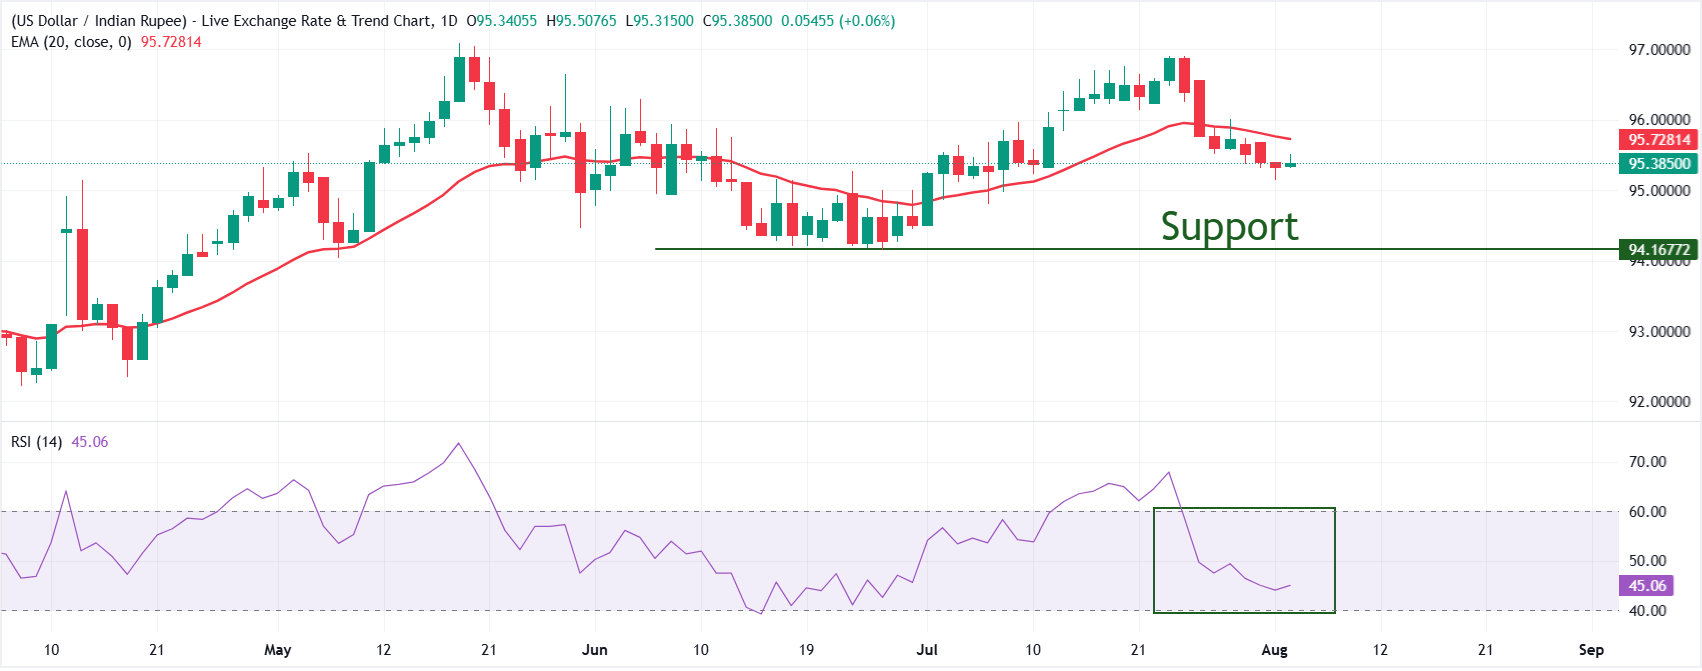
USD/INR retains a mildly bearish near-term bias as it holds below the 20-day Exponential Moving Average (EMA) at 95.72. The short-term trend structure suggests the pair is capped by this dynamic resistance, while the 14-day Relative Strength Index (RSI) at 45 keeps momentum in a neutral-to-bearish zone, hinting at a lack of strong buying conviction after the recent pullback from the 96.00 area.

On the topside, immediate resistance is defined by the 20-day EMA at 95.73, and a daily close above this barrier would be needed to extend the recovery towards 96.00. On the downside, major sup

Currency Hedger No Comments

USD/JPY Price – 200-day SMA caps rebound after intervention-led selloff

  • USD/JPY edges higher as the Japanese Yen gives back part of its intervention-led gains.
  • The pair has slipped below all major moving averages, turning the near-term bias bearish.
  • RSI signals oversold conditions, while the 200-day SMA at 158 offers immediate resistance.

USD/JPY trades modestly higher on Tuesday despite a softer US Dollar (USD), as the impact of recent intervention fades and the Japanese Yen (JPY) comes under pressure again. At the time of writing, the pair trades around 157.60, recovering after briefly falling toward 155 on Monday, its lowest level since May 6.

Analysts at Societe Generale argue that a lasting recovery in the Yen will hinge on the domestic growth story rather than policy theatrics, maintaining that โ€œwhat will trigger a durable yen rally will be a rise in consensus forecasts of Japanese growth, rather than more, bigger intervention, coordinated or otherwise.โ€

They add that โ€œmore, or faster BoJ rate hikes wonโ€™t solve the problem either, unless the Japanese growth outlook makes them appear realistic,โ€ cautioning that โ€œif Japanese growth remains weak, higher JGB yields will increasingly be unhelpful for the yen.โ€

In contrast, strategists at BBH focus on the near-term impact of recent official action, noting that โ€œthe coordinated US-Japan intervention โ€“ and officialsโ€™ warning that they stand ready to act again โ€“ significantly raises the cost of fighting a stronger yen and puts a much firmer ceiling on USD/JPY.โ€

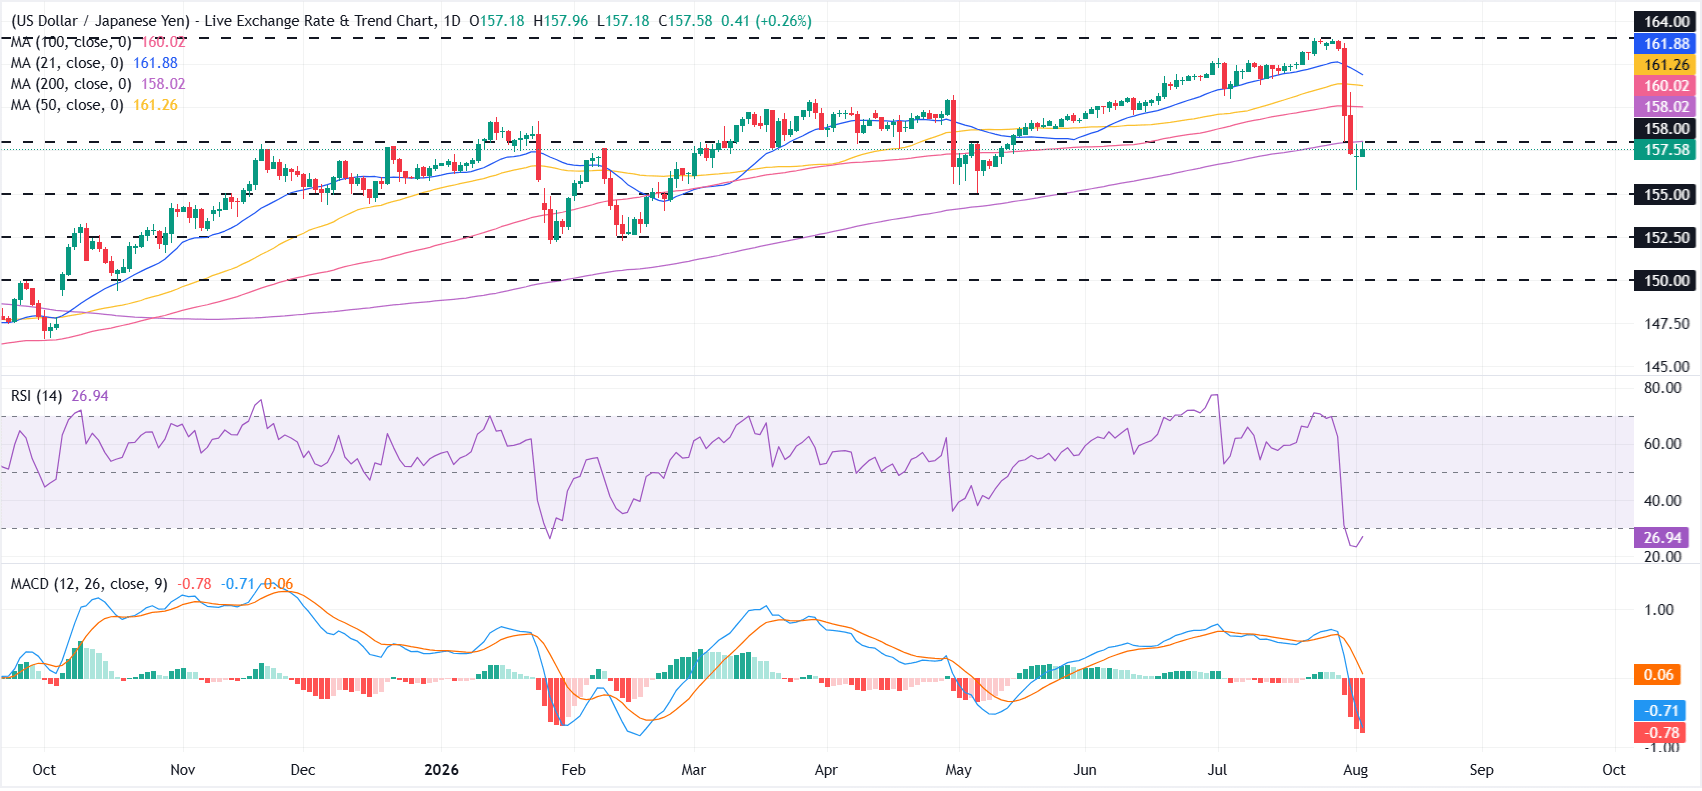
From a technical perspective, the intervention-driven pullback in USD/JPY has weakened the near-term bullish structure, with the pair slipping below key moving averages.

On the daily chart, the 200-day Simple Moving Average (SMA) at 158 offers immediate resistance. Further up, the 100-day SMA at 160 guards the path toward the 50-day SMA at 161.26 and the 21-day SMA at 161.89, ahead of a more distant structural hurdle at 164.

The Relative Strength Index (RSI) at 27 signals oversold conditions, while the Moving Average Convergence Divergence (MACD) remains below zero, reflecting the recent shift in momentum to the downside.

On the downside, the 155.00 psychological mark offers immediate support. A decisive break below this level could expose the 152.50 area, with the 150.00 psychological mark emerging as the next major downside target.

Currency Hedger No Comments

Canadian Dollar hangs near one-week low as weak oil prices counter USD downtick

  • USD/CAD attracts buyers for the fourth straight day, though it lacks follow-through amid mixed cues.
  • Sliding oil prices undermine the Loonie, while receding geopolitical risks weigh on the safe-haven USD.
  • Prospects for at least one Fed rate hike in 2026 favor USD bulls as traders look to the US macro data.

The USD/CAD pair trades with a positive bias for the fourth straight day and currently hovers around the 1.4070 region, or a nearly one-week high set the previous day. Spot prices, however, lack bullish conviction amid a combination of diverging forces, which warrants caution before positioning for an extension of the recent bounce from sub-1.4000 levels or the lowest since June 17.

Renewed hopes of a potential US-Iran deal to reopen the Strait of Hormuz drag crude oil prices to a nearly four-week low and undermine the commodity-linked Loonie, which, in turn, is seen supporting the USD/CAD pair. Meanwhile, weaker oil prices ease inflation fears and temper US Federal Reserve (Fed) rate hike expectations. Adding to this, receding geopolitical tensions weigh on the safe-haven US Dollar (USD) and cap the upside for the currency pair.

In the latest developments surrounding the Middle East crisis, Axios reported that the US, Iran, and Oman are closing in on an agreement to reopen the Strait of Hormuz. This comes on top of US Treasury Secretary Scott Bessent’s comments that the US could reach a deal with Iran to reopen the strategic waterway by Wednesday and move toward a more normalized position in this conflict. The remarks fueled optimism over a diplomatic resolution to end the US-Iran war.

Traders, however, are still pricing in a greater chance that the US central bank will raise borrowing costs by the end of this year amid signs that the US labor market is beginning to find its footing and looming inflation risks. Adding to this, Kansas City Fed President Jeff Schmid and Philadelphia Fed President Anna Paulson backed the case for higher interest rates to fight inflation. This should limit deeper USD losses and support prospects for further USD/CAD appreciation.

Traders now look to Wednesday’s US economic docket โ€“ featuring the release of the ADP report on private-sector employment and ISM Services PMI. Apart from this, the incoming geopolitical headlines and speeches from influential FOMC members would drive the USD demand. This, along with oil price dynamics, should provide some impetus to the USD/CAD pair. The focus, however, remains glued to the crucial monthly jobs report from the US and Canada, due on Friday.

Currency Hedger No Comments

Swiss Franc gains as easing risk aversion weighs on US Dollar

  • Easing tensions in the Strait of Hormuz reduced safe-haven demand for the US Dollar, causing the pair to depreciate.
  • The US, Iran, and Oman are expected to close an interim deal to reopen the Strait of Hormuz, targeting a Wednesday announcement.
  • BBHโ€™s Elias Haddad says low Swiss inflation and a steady SNB keep weighing on the Franc, G10’s weakest currency this quarter.

USD/CHF extends its losses for the second successive day, trading around 0.8080 during the Asian hours on Wednesday. The pair depreciates as the US Dollar (USD) loses ground as safe-haven demand recedes amid growing diplomatic momentum surrounding a potential agreement to reopen the Strait of Hormuz.

Axios reported that the United States (US), Iran, and Oman are closing in on an interim agreement to reopen the Strait of Hormuz, with the US aiming for a Wednesday announcement. The report also stated that the deal under discussion sets up a 60-day temporary arrangement between Oman and Iran in the Hormuz Strait, a critical chokepoint to almost 20% of global energy supply, which could be extended.

However, the US Dollar could find minor support from a recovery in the benchmark 10-year US Treasury yield after it dipped toward 4.61% on Tuesday. That initial decline in yields was driven by falling energy prices, which helped cool inflation fears and tempered expectations of a hawkish response from the Federal Reserve (Fed).

Schmid flags AI-driven inflation risks, backing tighter Fed stance despite resilient growth

Fedโ€™s Schmid delivered a modestly more hawkish message than relative to the historical average, with a 7.3/10 FXS Speechtracker score versus a 7/10 baseline, stressing that the current policy stance is โ€œnot tightโ€ and that tighter monetary policy is required to return inflation to the 2% target. The emphasis on AI-related investment as a fresh inflation driver, the warning that recent disinflation is too tentative to confirm an easing trend, and the view that inflation remains โ€œtoo highโ€ and โ€œworrisomeโ€ all reinforce a bias toward further restraint even as growth and the labor market are described as resilient and roughly balanced. By highlighting the PCE gauge as the preferred inflation metric and cautioning that energy relief may be temporary, the speech leans clearly toward guarding against upside price risks rather than validating imminent rate cuts.

The FXS Fed Sentiment Index slipped by 0.96 points to 145.80, signaling a slight pullback in perceived hawkishness following the speech. However, with the FXS Fed Sentiment Index still far above the neutral 100 line, the Fed remains firmly in hawkish territory despite the marginal softening, consistent with the elevated FXS Speechtracker reading and Schmidโ€™s focus on persistent inflation risks.

Analysts at Brown Brothers Harriman note that Swiss price pressures remain very subdued, with July inflation coming in โ€œin line with consensus.โ€ They highlight that โ€œheadline CPI printed at 0.4% y/y vs. 0.5% in June while core CPI remained at 0.3% y/y for a fourth straight month,โ€ reinforcing the Swiss National Bankโ€™s assessment of only modest inflation over the forecast horizon and helping to keep the policy rate anchored at 0.00%. In this context, Elias Haddad at BBH argues that the persistently low inflation backdrop and steady SNB stance continue to weigh on the Swiss Franc, which has been the weakest G10 currency so far this quarter.