Currency Hedger No Comments

USD/INR surrenders some gains, remains close to record highs

  • The Indian Rupee recovers slightly from its record lows of around 95.35 against the US Dollar.
  • Oil prices hit a fresh over seven-week high as US President Trump vows to prolong the blockade on Iran.
  • More Fed members call for a shift from easing bias.

The Indian Rupee (INR) claws back some of its early losses against the US Dollar (USD) during afternoon market hours in India on Thursday after plummeting to record lows. The USD/INR pair corrects slightly to near 95.10 as the US Dollar turns upside down, but is still close to its all-time high 95.35. The pair rallied in the opening as oil prices gained sharply, following remarks from United States (US) President Donald Trump that Washington’s naval blockade on Iran will remain intact.

Trump warns prolong naval blockade on Iran

On late Wednesday, US President Trump announced that he has rejected the recent peace proposal from Iran to reopen the Strait of Hormuz, a vital passage for almost 20% of global energy supply, whose closure has prompted the supply crisis and has boosted oil prices, which could have delayed negotiations regarding Tehranโ€™s nuclear ambitions.

US President Trump said thatย Washington will continue the naval blockade of Iran until he secures a deal with Tehran to address the countryโ€™s nuclear program.

At the press time, the WTI Oil price ticks lower to near $105.00 after facing slight profit booking near its fresh over seven-week high of $107.35 posted earlier in the day.

Currencies from economies, such as India that rely heavily on oil imports to meet their energy needs, tend to underperform in a high oil price environment.

Fed sees current policy stance as appropriate

The US Dollar gives back its early losses and slides lower; however, its outlook remains upbeat, following remarks fromย Fedย Chair Jerome Powell that the โ€œnumber of officials who would support a move away from an easing bias has increasedโ€.

As of writing, the US Dollar Index (DXY), which tracks the Greenbackโ€™s value against six major currencies, trades 0.18% lower to near 98.80.

On Wednesday, the Fed left interestย ratesย steady in the range of 3.50%-3.75%, with an 8-4 majority. One member dissented in favor of a rate cut, while three dissented against the inclusion of an easing bias, according to the monetary policy statement.

In the press conference,ย Fedย Chair Powell warned that the central bank is vigilant to โ€œrisks on both sides of our mandateโ€, adding, โ€œDevelopments in the Middle East are contributing to uncertainty.โ€

FIIs continue to dump their stake in Indian stock market

Foreign Institutional Investors (FIIs) remain net sellers in the Indianย stockย market amid surging oil prices, which have raised concerns about India Inc.’s earnings projections. Overseas investors have remained net sellers in all previous eight trading days, and have offloaded their stake worth Rs. 22,863.50

Technical Analysis: USD/INR sees more upside towards 96.00

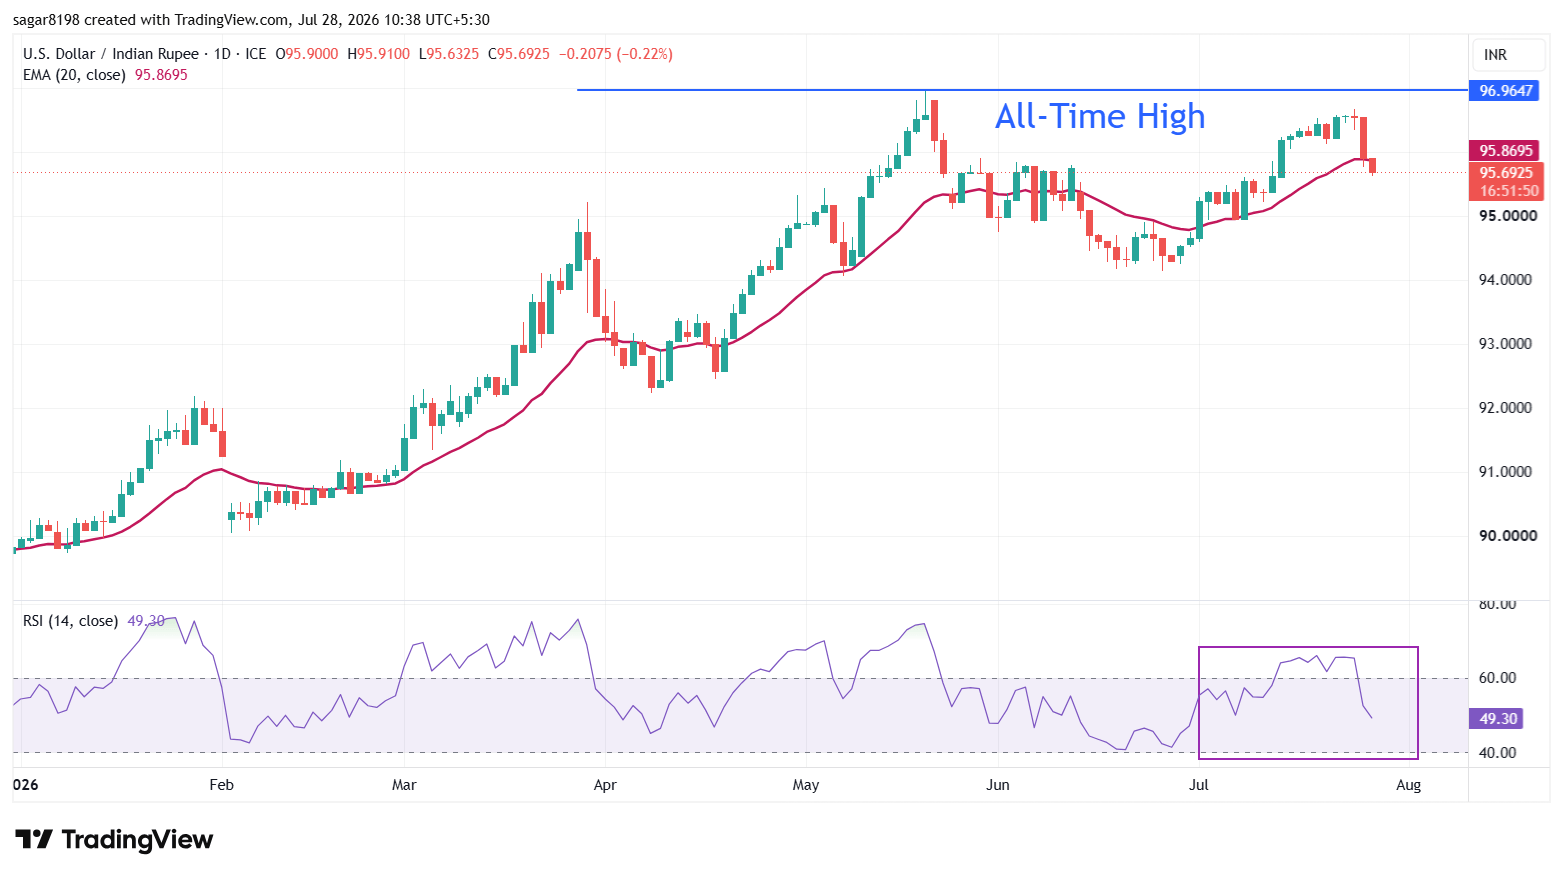
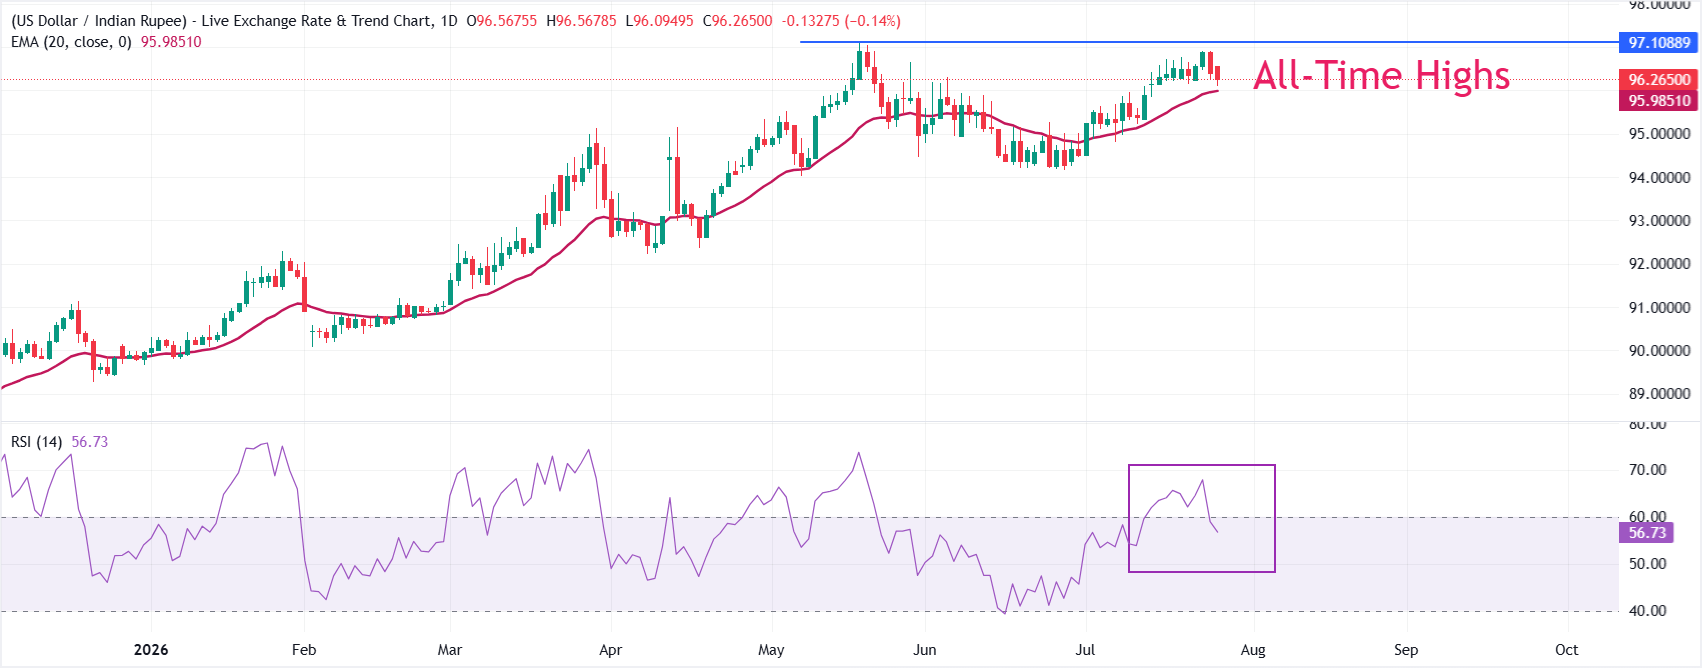
USD/INRย posts a fresh all-time high near 95.35 during the day on Thursday. The pair holds a firm bullish bias as spot remains well above the 20-period Exponential Moving Average (EMA) at 93.83, keeping the short-term uptrend intact.

The Relative Strength Index (RSI) hovers near 65.77, indicating strong but not yet extreme upside momentum, which suggests buyers still retain control, though the risk of overextension is building.

On the downside, initial support is aligned with the 20-EMA around 93.81, where a deeper pullback would be expected to attract dip buyers and maintain the broader advance while it holds. A daily close below this dynamic floor would hint at fading upside pressure and open the door to a more extended correction toward prior price congestion levels not yet tested in the current leg. Looking up, the price has entered uncharted territory and will likely extend its rally towards 96.00.

Currency Hedger No Comments

EUR/USD nears 1.1700 despite high Eurozone inflation and low growth data

  • EUR/USDย returns to levels near 1.1700 following Eurozone GDP and inflation figures.
  • The HICP accelerated to 3% in the 12 months to April.
  • The focus now shifts to the ECB’s monetary policy decision.

The Euro (EUR) is picking up against US Dollar (USD) on Thursday, returning to levels right below 1.1700 at the time of writing, despiteย Eurozoneย macroeconomic data, which has confirmed the picture of a sluggish economy and soaring inflationary pressures.

Eurozone’s Preliminary Harmonized Index of Consumer Prices (HICP) figures have shown that inflation surged to a 3% year on-on-year rate, its highest level since September 2023, from 2.6% in March and above the 2.9% anticiparted by the market consensus. Excluding food and energy prices, the Core HICP eased to a 2.2% y-o-y rate from 2.3% in March.

At the same time,ย Gross Domestic Productย (GDP) figures released by Eurostat revealed that economic growth slowed down to a 0.1% growth in Q1, from 0.2% in the last quarter of 2025, against expectations of a steady 0.2% growth.

These figures pose a significant challenge for theย European Central Bankย (ECB), which is expected to disclose its monetary policy decision later on Thursday. The bank is widely expected to leave its benchmark rate unchanged, but it will have to fine-tune its monetary policy to fight inflation without crushing an ailing growth.

The Fed moves away from monetary easing

On Wednesday, theย Fedย leftย ratesย on hold at the 3.50%-3.75% band, as expected, yet with the most divided committee since 1992, as three policymakers argued that the โ€œeasing biasโ€ phrase is no longer appropriate given the spike in energy prices.

The market has priced out the chance of a Fed rate cut this year, according to the CME FedWatch Tool, and now prices in a nearly 50% chance of a rate hike in June next year. This has given US Treasury yields a fresh boost, providing additional support for the US Dollar.

Beyond that, Fed Chairman Jerome Powell, who ends his term on May 15, affirmed that he will remain at the bank as Governor, due to the legal actions taken against him by US President Donald Trump. Powell will replace Stephen Miran, who was appointed by Trump in 2025 and voted for a rate cut on Wednesday, and is likely to counter pressure from the administration on the next Chair, Kevin Warsh, to ease monetary policy.

Technical Analysis: Euro hoversa above a key support zone

EUR/USD Chart Analysis

EUR/USDย remains under pressure with price action supported above a cluster of supports, above 1.1645, which held bears several times in mid-April and whose upper limit is the neckline of a bearish “Head & Shoulders” (H&S) pattern at 1.1675.

Technical indicators on the 4-hour show a neutral-to-bearish trend. The Relative Strength Index (RSI) remains below the 50 level, highlighting moderate downside pressure, and the Moving Average Convergence Divergence (MACD) remains below zero.

Bears need to breach the mentioned neckline at 1.1675 and the April 8 intraday low, in the area of 1.1645, to confirm the H&S formation. The pair might find some support at the 1.1630 area, where the 50%ย Fibonacciย support of the March-April rally meets late March and early April highs. The 61.8% Fibonacci retracement is at 1.1583. The H&S’s measured target is coincident with the April 6 low near 1.1500.

On the topside, immediate resistance is at Wednesday’s high at 1.1720 ahead of the mentioned weekly high at 1.1755.

Currency Hedger No Comments

Bank of England – Preview

H is for hawk The Bank of England will announce its latest policy decision at midday on Thursday. The market is expecting no change in rates from the Bank, and we expect an 8-1 vote split, with one of the noted hawks at the bank voting to increase rates.

The backdrop to this meeting is a deeply uncertain global outlook and the threat of a bigger inflation spike after another surge in the oil price, which has risen to a fresh war-time high on Thursday morning to more than $123 per barrel for Brent, as the blockade in the Strait of Hormuz looks like it will be in place for the long term and as Donald Trump mulls ending the ceasefire with Iran. We expect the BOE to remain as calm and composed as possible considering the backdrop, and to stress the uncertain outlook, however, now that the oil price is rising again and oil supply is likely to remain constrained for the long term, the BOE may find it hard to avoid straying into hawkish territory as it balances growth risks with inflation concerns.

We expect the Bank will stress the need to watch for second round inflation effects, for example wage growth. So far, the survey data does not suggest that firms are likely to raise wages, and the labor market is still soft, even if the unemployment rate fell below 5% in the 3 months to February. The latest DMP survey shows that expectations for wage growth this year are unchanged at 3.5%. The Bank may also address the increase in inflation expectations, which rose by 2.1% in March, according to the latest Citi-YouGov survey. This suggests that consumers are concerned about a 2022-style energy price shock, even if the Bank has been keen to stress that the economic backdrop is different this time.

Assessing the chance of a hawkish shock at the BOE

A hawkish shock would be a larger number of MPC members voting for a rate hike, especially since signals coming from the March data have been resilient so far. If we get a 6-3 split, then this could open the door to a June rate hike. That might sound hasty, however, an early hike could nip in the bud any threat of second round inflation effects, especially if the blockade of the Strait of Hormuz lasts for the long term and the oil price stays in triple figures.

What will the BOE do next

Although we do not expect any forward guidance from the BOE at todayโ€™s meeting, the market is convinced that the next move from the BOE is a rate hike. There is roughly an 84% chance of two rate hikes from the BOE this year, and the market expects rates to rise to 4.25% to combat the threat of rising inflation caused by the energy price spike. The market is expecting the BOE to signal that rates will remain higher for longer, and for now, UK inflation is expected to peak at 4% this year.

Fedโ€™s hawkish tilt

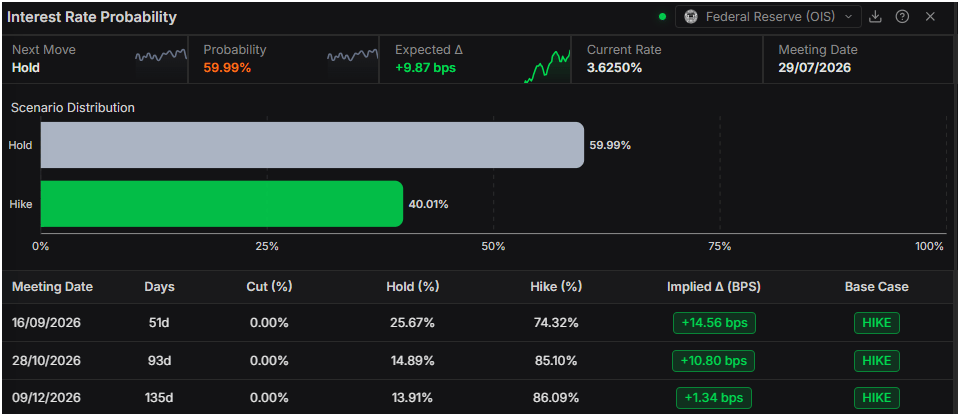
Todayโ€™s BOE meeting follows Wednesday nightโ€™s Fed meeting. The Fed did not change policy, but it is worth noting that its policy decision was the most divided since 1992. On the back of the Fed meeting, traders now see a rate hike as more likely than a rate cut for this year, following the Fedโ€™s hawkish hold on Jerome Powellโ€™s last meeting as chair. There is now an 11% chance of a hike from the Fed this year, up from 5% prior to the meeting. The Fed did not change the language used in its statement at this meeting, which suggests that cuts could still be on the cards for US interest rates. However, Powell suggested that this language could be adapted in future if elevated oil prices persist and three Fed governors opposed the current language used in the statement.

The market reacted to the hawkish tone at the Fed. The Dow Jones slumped 250 points, the dollar ticked higher and US stock index futures are also pointing to losses for the S&P 500 on Thursday. We think that the market reaction to the BOE meeting is likely to be mostly felt in the bond market. UK 2-year yields rose by 8 bps on Wednesday, and yields are higher by 26bps in the past month. The 2-year yield is now trading at 4.55%, so a lot of BOE hawkishness is already priced into UK bonds. We think that the oil price is more important for the direction of UK yields and sentiment towards UK assets more generally. UK stocks have slipped behind their US counterparts in recent weeks, and until there is a rotation out of US tech stocks and into defense names like BAE Systems and Rolls Royce, we could see the UK index may continue to struggle.

Chart 1: FTSE 100 and the S&P 500

Source: XTB

Currency Hedger No Comments

Chart of the Day: Yen breaks beyond 160 as the market tests the limits of the โ€œred lineโ€

USDJPY has decisively broken through the psychological 160 level, reaching new multi-month highs and entering territory that was until recently treated as an informal red line for Japanese authorities. Importantly, the breakout has not been met with any strong verbal pushback from the Ministry of Finance, which the market interprets as a growing tolerance for further yen weakness, at least in the short term. This move is not happening in isolation. It reflects the classic combination of two dominant macro forces: a persistently wide interest rate differential and mounting pressures within Japanโ€™s real economy, which are becoming increasingly difficult to ignore.

Source xStation5

What is driving USDJPY? Fed and BOJ stable rates, diverging narratives

Both the Federal Reserve and the Bank of Japan left interest rates unchanged, which in itself was not a surprise for markets. The key focus, however, was on communication nuances that further widened the divergence between the two economies. The Fed remains relatively hawkish, emphasizing the resilience of the US economy and a lack of urgency to pivot toward rate cuts. As a result, the dollar continues to benefit from higher yields and the sustained attractiveness of carry trade strategies. On the other side, the BOJ remains cautious, trying to balance the end of ultra-loose monetary policy with the risks of tightening too quickly. However, it is becoming increasingly clear that the issue is no longer only imported inflation driven by commodities, but also yen weakness itself, which is now amplifying domestic price pressures.

Japan trapped in a cost and commodities squeeze

Japanโ€™s economic fundamentals are sending increasingly mixed signals. Retail sales suggest some resilience in consumer demand, while industrial production disappointed in March, partly due to supply chain disruptions and rising cost pressures linked to global commodity tensions. Particularly important is the situation around the Strait of Hormuz, which continues to elevate risks for global oil and gas flows. For Japan, a heavily import-dependent energy economy, this translates into higher production costs and a deteriorating trade balance. In this context, reports of a possible return of energy subsidies during the summer highlight the governmentโ€™s attempt to cushion cost pressures, although such measures appear more like short-term stabilization tools rather than a structural response to persistent yen weakness.

160 as a psychological level and a test of market patience

The break above 160 is not purely a technical move. It represents a direct test of Japanโ€™s tolerance threshold for currency weakness. Historically, these levels have been associated with heightened sensitivity from authorities, yet the lack of immediate reaction is encouraging the market to probe further. At this stage, the balance of forces remains tilted toward fundamentals. A persistently wide USโ€“Japan rate differential continues to support capital flows into the dollar, while weak Japanese industrial data and commodity-driven pressures leave the BOJ with little room to tighten policy aggressively in the near term.

Outlook

The current USDJPY move increasingly resembles a classic carry trade driven environment, where fundamentals and momentum reinforce each other. Unless there is a meaningful shift in BOJ policy or a more forceful intervention from the Ministry of Finance, the path of least resistance remains higher. The key question is no longer whether 160 would be broken, but how long the market will continue testing the absence of intervention and where the true line in the sand ultimately lies.

Currency Hedger No Comments

Currency Talk – EUR/GBP, EUR/AUD, AUD/USD

Key takeaways

  • What is the technical outlook for EURGBP, EURAUD, and AUDUSD?

The Overbalance analysis aims to identify three financial instruments, analyzed primarily on the daily/four-hour (D1/H4) timeframe. The analysis uses only the Overbalance methodology, which helps determine where a trend may continue or where it may reverse. Todayโ€™s analysis covers three instruments, evaluated solely in terms of 1:1 correction structures. EURGBP From March 20 through the end of the month, EURGBP traded in an uptrend, but the subsequent correction turned into a stronger downtrend. After the 1:1 upward pattern was negated at the 0.8693 level, the declines accelerated. Currently, the 0.8693โ€“0.8688 zone represents key resistance. Only a return of the price above this zone could shift the balance of power on the chart. For now, the base scenario remains a decline toward the lows at 0.8617.

EURGBP – H4 timeframe. Source: xStation EURAUD From March 11 through the end of the month, the EURAUD pair was in an uptrend; however, the largest corrective pattern was subsequently negated at the 1.6680 level, which was then tested from the opposite side. Since then, we have observed the development of a downtrend. The largest current corrective pattern (marked in red) defines a key resistance level at 1.6470. According to the Overbalance methodology, as long as the price remains below this level, the downtrend remains in effect.

EURAUD – H4 timeframe. Source: xStation AUDUSD Since late March, the AUDUSD pair has been in an uptrend. Recently, the exchange rate has twice tested support at the 0.7015 level, which corresponds to the lower boundary of the 1:1 pattern. As long as this level holds, the uptrend remains intact. It is worth noting, however, that another test of this zone could weaken it, increasing the risk of it being broken and thus triggering a larger downward correction.

AUDUSD – H4 chart. Source: xStation

Currency Hedger No Comments

When are Eurozone Prelim HICP inflation, Q1 GDP data and how could they affect EUR/USD?

The Eurozone Prelim HICP and GDP Overview

Eurostat will publish the preliminaryย Eurozoneย Harmonized Index of Consumer Prices (HICP) for April and Gross Domestic Product (GDP) for the first quarter of 2026 later on Thursday at 09:00 GMT.

Eurozone HICP inflation is expected to inch higher to 2.9% year-over-year (YoY) in April, from 2.6% in March. Meanwhile, the annual core inflation is anticipated to remain consistent at 2.3% in the reported month.

The monthly Eurozone inflation and core inflation were at 1.3% and 0.8%, respectively, in March.

Meanwhile, seasonally adjusted flash Eurozone GDP is projected to rise 0.2% QoQ in Q1, unchanged from the prior reading, while annual growth is seen slowing to 0.9% from 1.2%.

How could the Eurozone Prelim HICP and Q1 GDP affect EUR/USD?

The EUR/USD pair may remain flat if the HICP data come as expected. However, the pair may depreciate further asย the Euroย (EUR) could struggle amid increasedย risk aversion, which could be attributed to the geopolitical tensions in the Middle East.

Traders expect theย European Central Bankย (ECB) to leave interest rates unchanged late in the day, in line with many global peersย this week, while signaling that a rate hike, possibly as early as June, may be necessary to counter an energy-driven surge in consumer prices.

The EUR/USD pair could lose ground as the US Dollar (USD) remains firm, which could be attributed to theย Federal Reserveย (Fed) keeping rates unchanged but striking a more hawkish tone amid rising inflation concerns.

The Federal Open Market Committee (FOMC) voted 8-4 on Wednesday to keep interestย ratesย unchanged within the 3.5%โ€“3.75% range, marking the first instance of four dissenting votes since October 1992. The committee emphasized that โ€œinflation remains elevated, partly due to the recent rise in global energy prices.โ€

Technically, the EUR/USD pair steadies after recovering daily losses, trading around 1.1680 at the time of writing. The 14-day Relative Strength Index (RSI) around 49 hints at fading bullish momentum and a consolidative bias. The pair is hovering around the 50-day EMA of 1.1678, followed by the nine-day EMA barrier at 1.1700. On the downside, the EUR/USD pair may navigate the region around the eight-month low of 1.1411, recorded on March 13.

Currency Hedger No Comments

USD/JPY rises beyond the key 160.00 level, boosting intervention risks

  • USD/JPY rallies to 21-month highs at 160.73 with Tokyo intervention looming.
  • The US Dollar rallies across the board, following the Fed’s monetary policy decision.
  • Concerns about the impact of the energy shock on the Japanese economy keep weighing on the JPY.

The US Dollar (USD) appreciates against the Japanese Yen (JPY) for the third consecutive day on Thursday, to hit 21-month highs at 160.73, levels that urged Japanese authorities to act in the past, since the 160.00 round mark is considered a line in the sand for Tokyo.

The US Dollar is outperforming its major currency peers on Thursday, boosted by a hawkish tilt at Wednesdayโ€™s USย Federal Reserveย (Fed) monetary policy meeting and fears of a prolonged closure of the Strait of Hormuz, as attempts to find a negotiated end to the US-Iran war are failing.

The Fed held its monetary policy unchanged as expected on Wednesday, but three policymakers opposed the โ€œeasing biasโ€ language in the bankโ€™s statement, while another one dissented in favour of a rate cut. The overall outcome of the voting has prompted investors to price out any further rate cuts. US Treasury yields jumped in the aftermath of the meeting, providing additional support to the USD.

Japanโ€™s Finance Minister, Satsuki Katayama, reiterated Tokyoโ€™s willingness to take โ€œdecisive actionโ€ against excessive Yen weakness earlierย this week, and the Bank of Japan (BoJ) assured that it will continue hikingย ratesย as soon as geopolitical uncertainty ebbs.

The Yen, however, remains on its back foot, as concerns about the economic consequences of high Oil prices in a Crude-importing economy like Japan’s are keeping investors away from the JPY.

Currency Hedger No Comments

EUR/USD dips towards 1.1650 with Eurozone inflation, ECB rates on tap

  • EUR/USDย drifts to three-week lows near 1.1650 as the Fed turns hawkish.
  • The Federal Reserve left rates on hold, with some policymakers opposing the “easing bias”.
  • Eurozone inflation and the ECB’s monetary policy decision will guide the pair on Thursday.

The Euro (EUR) extends losses for the third consecutive day against the US Dollar (USD) on Thursday, trading at 1.1663 at the time of writing, down from weekly highs at 1.1755. A hawkish shift in the US Federal Reserveโ€™s (Fed) monetary policy stance and the deadlock in the Middle East conflict are buoying the safe-haven USD, ahead of theย Eurozoneย inflation data and the European Central Bankโ€™s (ECB) monetary policy decision, both due later today.

On Wednesday, theย Fedย left rates on hold at the 3.50%-3.75% band, as expected, yet with the most divided committee since 1992, as three policymakers argued that the โ€œeasing biasโ€ phrase is no longer appropriate given the spike in energy prices.

Higher Treasury yields give a fresh push to the USD

The market has priced out the chance of a Fed rate cut this year, according to the CME FedWatch Tool, and now prices in a nearly 50% chance of a rate hike in June next year. This has given US Treasury yields a fresh boost, providing additional support for the US Dollar.

Beyond that, Fed Chairman Jerome Powell, who ends his term on May 15, affirmed that he will remain at the bank as Governor, due to the legal actions taken against him by US President Donald Trump. Powell will replace Stephen Miran, who was appointed by Trump in 2025 and voted for a rate cut on Wednesday, and is likely to counter pressure from the administration on the next Chair, Kevin Warsh, to ease monetary policy.

In Europe, traders will be attentive to the Eurozone preliminary Gross Domestic Product (GDP) for the first quarter and the Harmonised Index of Consumer Prices (HICP) for April, which is expected to show a sharp acceleration, boosted by higher Oil prices.

The main focus on Thursday, however, will be on the ECBโ€™s monetary policy decision. The bank will most likely leave interestย ratesย on hold, awaiting more clarity on the Middle East conflict, while leaving the door open for a rate hike in June or July.

Technical Analysis: Bears are testing a key support zone

EUR/USD Chart Analysis

EUR/USDย is showing mounting bearish pressure after breaking the neckline of a bearish “Head & Shoulders” (H&S) pattern at 1.1675, and is now testing a cluster of supports above 1.1645, which held bears several times in mid-April.

Technical indicators on the 4-hour chart are going deeper into bearish territory. The Relative Strength Index (RSI) around 34 hints at lingering downside pressure, and the Moving Average Convergence Divergence (MACD) histogram is showing widening red bars.

A clear break of the April 8 intraday low, in the area of 1.1645, would confirm the H&S formation. The pair might find some support at the 1.1630 area, where the 50%ย Fibonacciย support of the March-April rally meets late March and early April highs. The 61.8% Fibonacci retracement is at 1.1583. The H&S’s measured target is coincident with the April 6 low near 1.1500.

On the topside, immediate resistance emerges at the previous support zone near 1.1675, followed by Wednesday’s high at 1.1720 and the mentioned weekly high at 1.1755.