USD/JPY edges lower to around 162.15 in Thursday’s Asian session.
Japan’s Katayama said ready to take appropriate action on currency anytime as needed.
Cooling US inflation curbs Fed rate hike bets.
The USD/JPY pair loses ground to near 162.15 during the Asian trading hours on Thursday. The Japanese Yen (JPY) strengthens against the US Dollar (USD) after verbal intervention from Japanese authorities. Traders await the release of the US June Retail Sales data later on Thursday for fresh impetus.
Traders remain on alert for possible intervention from Japanese officials. On Thursday, Japan’s Finance Minister Satsuki Katayama said that the authorities are ready to take appropriate action on currency anytime as needed. She added that the officials will track market trends and economic data to ensure fiscal sustainability.
Softer-than-expected US inflation data reinforced bets that the US Federal Reserve (Fed) can stay patient on interest rate hikes, weighing on the Greenback. Data released by the US Bureau of Labor Statistics (BLS) on Wednesday showed that the US Producer Price Index (PPI) rose by 5.5% YoY in June, versus 6.0% in May (revised from 6.5%). This reading came in below the market consensus of 6.2%.
On a monthly basis, the PPI declined by 0.3%, compared to the 0.6% increase recorded in May (revised from 1.1%) and improved compared with the estimate for no change.
The probability for a rate hike in July was slashed to 9.6%, versus a 45% implied probability at the start of the week. Markets still see even odds of at least a 25 basis points (bps) increase in September, according to the CME FedWatch tool.
USD/CHF remains stronger as the US Dollar recovers, fueled by safe-haven buying and prolonged high Fed rates.
June CPI and PPI reports fell below market expectations, temporarily easing immediate fears of further rate hikes.
Swiss Franc safe-haven demand, fueled by oil supply disruptions and rising inflation fears, points to further downside for USD/CHF.
USD/CHF inches lower after opening at a bullish gap, remaining in positive territory and trading around 0.8060 during the Asian hours on Thursday. The pair holds ground as the US Dollar (USD) recovers its daily losses amid rising risk aversion, which could be attributed to United States (US)-Iran tensions boosting oil prices and sparking fresh inflation concerns. This geopolitical friction threatens to prolong the Federal Reserve’s (Fed) higher interest rate environment.
The Guardian reported that the US Central Command (CENTCOM) launched another wave of strikes as part of a concerted effort to keep the critical Strait of Hormuz open. In a direct escalation of hostilities, CENTCOM confirmed that US aircraft fired missiles into an oil tanker’s smokestack within the strategic passage, effectively disabling the vessel and keeping global markets on edge.
Amid this escalating conflict in the Middle East, traders are closely assessing the Federal Reserve’s policy outlook in light of recently softened US inflation data. Tuesday’s US Consumer Price Index (CPI) declined to 3.5% in June from the three-year high of 4.2% set in May, coming in well below the market expectation of 3.8%. This weaker consumer inflation data initially helped reduce immediate concerns that the Fed would soon raise interest rates.
CME FedWatch Tool suggests that markets scaled back expectations for a Fed rate hike in September, with the implied probability falling to around 44% from 50% just a day earlier. However, because the interim US-Iran peace agreement reached last month has effectively unraveled, June’s inflation data does not yet capture the economic impact of this latest military escalation between the US and Iran.
Further supporting this cooling trend, Wednesday’s data showed the US Producer Price Index (PPI) declined to 5.5% on a yearly basis in June, down from 6% in May and below the market expectation of 6.2%. On a monthly basis, the PPI dropped by 0.3%, a notable shift from the 0.6% increase recorded in May and an improvement compared to analysts’ estimates of no change.
The USD/CHF pair faces further downside as rising inflation fears, triggered by oil supply disruptions, fuel safe-haven demand for the Swiss Franc (CHF). Meanwhile, the Swiss National Bank (SNB) maintained its policy rate at 0%. The central bank reconfirmed its readiness to step into the foreign exchange markets to prevent an excessive appreciation of the franc and shield the economy from imported inflation.
Senior officials from the Bank of Japan (BoJ) said on Thursday that a delay in stimulus adjustment amid high inflation risk could trigger an economic downturn.
Key quotes
Delay in stimulus adjustment amid high inflation risk could trigger economic downturn.
Suitable monetary policy would ensure stable inflation, place economy on sustainable growth trajectory.
When upside inflation risk high as is the case now, delay in adjusting degree of stimulus could materialise such risk, lead to economic downturn in future.
Market reaction
At the time of writing, USD/JPY is down 0.06% on the day at 162.09.
The Indian rupee hovered around 96.2 per dollar, remaining under pressure after reaching eight-week lows as sentiment weakened on rising crude oil prices. Brent crude climbed above $85 per barrel amid escalating tensions between the US and Iran, raising concerns over potential supply disruptions through the Strait of Hormuz and increasing India’s oil import bill. The rupee has fallen about 1.7% so far this month, moving closer to its record low reached in May. Meanwhile, the positive sentiment from the Reserve Bank of India’s recent measures to attract dollar inflows has largely faded, prompting traders to resume buying dollars on dips in anticipation of further rupee weakness. Additional pressure came from more than $14 billion in overseas investment announcements by Indian companies early in the fiscal year, boosting demand for foreign currency, while foreign portfolio outflows and higher oil imports continued to weigh on the rupee and India’s foreign exchange reserves.
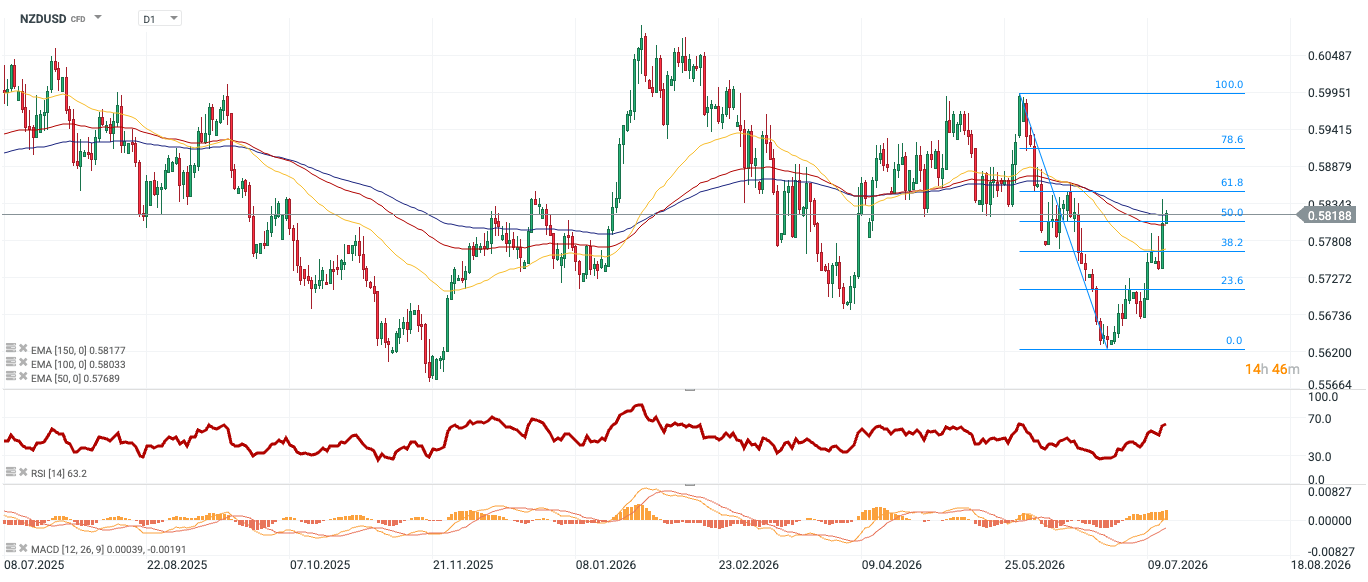
The New Zealand dollar hovered near a six-week high at around $0.583, supported by expectations that the Reserve Bank of New Zealand will continue tightening monetary policy, alongside broad weakness in the US dollar. Markets widely expect the RBNZ to deliver another rate hike in September, with the OCR seen reaching at least 3.0% by the end of the year. RBNZ Chief Economist Paul Conway said earlier this week that renewed conflict in the Middle East could fuel inflationary pressures, reinforcing the case for further policy tightening following last week’s first rate increase in more than three years. Meanwhile, the greenback hovered near a one-month low as investors scaled back bets on a near-term Federal Reserve rate hike after softer-than-expected inflation data. However, escalating geopolitical tensions remain a downside risk for the New Zealand dollar, as heightened uncertainty could weaken global risk appetite and weigh on risk-sensitive currencies such as the kiwi.
The South Korean won strengthened to around 1,485 per dollar, advancing for a fifth straight session and reaching its highest level since mid-May, after the Bank of Korea raised interest rates. The central bank lifted its benchmark interest rate by 25 basis points to 2.75%, as widely expected, marking its first increase since early 2023 as policymakers sought to curb persistent inflation and support the currency following months of depreciation. The decision marked the start of a new tightening cycle, with investors assessing whether policymakers will deliver further rate increases if inflation remains elevated. Meanwhile, gains in the won were limited as fresh US strikes on Iran boosted demand for the safe-haven US dollar and heightened concerns over potential disruptions to global energy supplies. Broader market sentiment also remained fragile as renewed volatility in technology shares weighed on risk appetite.
The geopolitically turbulent start of July has brought a strengthening of commodity currencies (among them, the Norwegian krone). However, the top of the G10 list is occupied by the New Zealand dollar, which may come as a surprise to some. The currency has strengthened by nearly 2.5% against the dollar over the past two weeks.
What lies behind such a significant move?
Fundamental to this, as is often the case, were the actions of the central bank. On 8 July, the Reserve Bank of New Zealand raised the main interest rate by 25 bps, lifting it to 2.5%. This was the first rate hike in New Zealand in over three years. The key, however, was not just the decision to raise rates (which was largely priced in by markets) but the communication that accompanied it.
The decision was made unanimously by the committee. At the previous meeting in May, there was a 3-3 split in votes, and the balance was only tipped by the new governor, Anna Breman.
The RBNZ Chief Economist, Paul Conway, drew clear attention to pro-inflationary risks resulting from the escalation of tensions in the Middle East.
The Bank stated in its communiqué that “while further interest rate hikes seem likely at upcoming meetings, their timing is highly uncertain.”
RBNZ research suggests that after a long period of elevated inflation, New Zealand companies are significantly more inclined to immediately pass costs on to consumers and less willing to lower prices when costs fall.
As a result, the market’s baseline scenario is another hike in September and another upward move in October or December. This would bring the main interest rate (cash rate) to 3%, which the bank currently defines as the neutral level.
What lies ahead? There is still plenty of time until September.
In the meantime, the Q2 inflation report will be published. The consensus assumes a significant increase in the headline indicator, most likely to around 4%.
After the manufacturing PMI rose to its highest level since 2021 (59.7), data on production could prove particularly interesting.
Data from China, New Zealand’s largest trading partner, which absorbs nearly 25% of the country’s total exports (mainly dairy, meat, wood, and fruit), will also be significant.
Stronger economic data from the Middle Kingdom usually means greater demand for products imported from New Zealand.
In this context, the readings published today are not particularly optimistic. GDP dynamics fell to the lowest level since 2022 (+4.3% year-on-year).
The Asian giant is burdened by a property market crisis, weak domestic demand, and a decline in investment (down 5.7% year-on-year in the first half of the year).
The strength of the dollar itself, which is awaiting further news from the geopolitical front and the September FOMC decision, could, of course, also prove key.
The market does not really expect a hike, so the focus will be on communication. Kevin Warsh remains enigmatic, so upcoming conferences may attract particular attention.
Source: xStation, 15.07.2026 The NZDUSD pair has broken out of the downtrend and is currently testing key support levels. The price has breached the 50% Fibonacci retracement and is hovering around the 150-day moving average. The upward momentum is also suggested by the MACD indicator. The Relative Strength Index (RSI) has reached 63.4, which confirms a clear advantage for market bulls, while at the same time indicating that the market is not yet in the extreme overbought zone (above 70).
EUR/USD trades with a positive bias for the second straight day amid a softer US Dollar.
Escalating US-Iran tensions keep geopolitical risk premiums in play and support the USD.
The technical setup also warrants some caution before placing bullish bets on the pair.
The EUR/USD pair attracts some dip-buyers following the previous day’s pullback from the 1.1460-1.1470 horizontal resistance, though it remains confined within a multi-week-old range. Spot prices trade around the 1.1435-1.1440 region during the Asian session on Wednesday, up for the second straight day amid modest US Dollar (USD) weakness.
Softer-than-expected US consumer inflation data, released on Tuesday, forced traders to scale back their expectations of Federal Reserve (Fed) rate hikes, which keeps the USD bulls depressed and acts as a tailwind for the EUR/USD pair. However, inflation risks stemming from elevated crude oil prices and Fed Chair Kevin Warsh’s price stability commitment, along with escalating US-Iran tensions, should limit deeper USD losses and cap the currency pair.
The EUR/USD pair has been struggling to find acceptance and build on its strength beyond the 23.6% Fibonacci retracement level of the April-June downfall. Adding to this, momentum indicators hint at scope for corrective upticks rather than a clear trend reversal. The Moving Average Convergence Divergence (MACD) indicator has turned positive, and the Relative Strength Index (RSI) around 56 suggests improving but still moderate bullish momentum.
This further warrants some caution before placing aggressive bullish bets on the EUR/USD pair and positioning for an extension of the recent recovery from the 1.1325 region, or the year-to-date low touched in June. The subsequent resistance below the 23.6% Fibo. aligns at the 200-period Simple Moving Average (SMA) on the 4-hour chart, near 1.1490, with the 38.2% retracement near 1.1523 and the 50.0% level around 1.1585 acting as the next relevant hurdles.
On the downside, the main structural support emerges at the Fibonacci anchor close to 1.1323, and a clear break under this floor would likely reinforce the broader bearish outlook for the EUR/USD pair.
EUR/USD 4-hour chart
US Dollar Price Today
The table below shows the percentage change of US Dollar (USD) against listed major currencies today. US Dollar was the strongest against the Swiss Franc.
USD
EUR
GBP
JPY
CAD
AUD
NZD
CHF
USD
-0.16%
-0.05%
-0.08%
-0.10%
-0.17%
-0.03%
-0.00%
EUR
0.16%
0.05%
0.07%
0.05%
-0.06%
0.07%
0.15%
GBP
0.05%
-0.05%
0.02%
-0.01%
-0.11%
0.02%
0.09%
JPY
0.08%
-0.07%
-0.02%
-0.03%
-0.11%
0.03%
0.06%
CAD
0.10%
-0.05%
0.01%
0.03%
-0.07%
0.00%
0.10%
AUD
0.17%
0.06%
0.11%
0.11%
0.07%
0.11%
0.16%
NZD
0.03%
-0.07%
-0.02%
-0.03%
-0.01%
-0.11%
0.07%
CHF
0.00%
-0.15%
-0.09%
-0.06%
-0.10%
-0.16%
-0.07%
The heat map shows percentage changes of major currencies against each other. The base currency is picked from the left column, while the quote currency is picked from the top row. For example, if you pick the US Dollar from the left column and move along the horizontal line to the Japanese Yen, the percentage change displayed in the box will represent USD (base)/JPY (quote).
To provide the best experiences, we use technologies like cookies to store and/or access device information. Consenting to these technologies will allow us to process data such as browsing behavior or unique IDs on this site. Not consenting or withdrawing consent, may adversely affect certain features and functions.
Functional
Always active
The technical storage or access is strictly necessary for the legitimate purpose of enabling the use of a specific service explicitly requested by the subscriber or user, or for the sole purpose of carrying out the transmission of a communication over an electronic communications network.
Preferences
The technical storage or access is necessary for the legitimate purpose of storing preferences that are not requested by the subscriber or user.
Statistics
The technical storage or access that is used exclusively for statistical purposes.The technical storage or access that is used exclusively for anonymous statistical purposes. Without a subpoena, voluntary compliance on the part of your Internet Service Provider, or additional records from a third party, information stored or retrieved for this purpose alone cannot usually be used to identify you.
Marketing
The technical storage or access is required to create user profiles to send advertising, or to track the user on a website or across several websites for similar marketing purposes.