NZD/USD attracts sellers for the second straight day as Iran tensions continue to underpin the USD.
Elevated Oil prices revive Inflation fears, tempering dovish Fed bets and further benefiting the buck.
Expectations that the RBNZ may consider tightening policy could limit losses for the NZD and the pair.
The NZD/USD pair is seen extending this week’s retracement slide from the 0.5925-0.5930 horizontal barrier and drifting lower for the second straight day on Friday. Spot prices slide back to the 0.5840 region during the Asian session and seem vulnerable near a technically significant 200-day Simple Moving Average (SMA) amid a bullish US Dollar (USD).
The USD Index (DXY), which tracks the Greenback against a basket of currencies, retains its positive bias for the fourth straight day on the back of intensifying US-Iran tensions. Moreover, the lack of progress in peace talks, due to a standoff over the Strait of Hormuz, keeps investors on edge and further benefits the USD’s safe-haven status. This, in turn, is seen as a key factor exerting some downward pressure on the NZD/USD pair.
US President Donald Trump said on Tuesday that the US Navy blockade of Iranian ports will continue, while Iran has set the complete removal of the blockade as a strict precondition for resuming negotiations. Furthermore, Trump ordered the US Navy to shoot and kill any boat laying mines in the critical shipping channel. This keeps geopolitical risks in play and dampens hopes for a durable de-escalation, underpinning the USD.
Meanwhile, continued disruptions to energy supplies remain supportive of elevated Crude Oil prices and fuel inflationary fears, tempering hopes for a dovish USย Federal Reserveย (Fed). Traders now see the possibility of only one 25-basis-point (bps) rate cut by the Fed in 2026. This backs the case for a further appreciating move for the USD and suggests that the path of least resistance for the NZD/USD pair is to the downside.
However, persistent sticky inflation has spurred bets that the Reserve Bank of New Zealand (RBNZ) may maintain a cautious policy stance or consider tightening to bring inflation back to the 2% midpoint. In fact, data earlierย this weekย showed that New Zealand’s annual inflation held at 3.1% in the March 2026 quarter, slightly above the central bank’s 1โ3% target range. This could limit losses for the New Zealand Dollar (NZD) andย the NZD/USD pair.
USD/CHF appreciates as the US Dollar gains on safe-haven demand amid persistent USโIran conflict uncertainty.
Israelโs UN ambassador Danny Danon said the Lebanon ceasefire extension is โnot 100%.โ
Markets expect SNB intervention to curb rapid, excessive CHF appreciation.
USD/CHF extends its winning streak for the fourth successive day, trading around 0.7870 during the Asian hours on Friday. The pair gains ground as the US Dollar (USD) receives support from safe-haven demand amid persistent uncertainty surrounding the United States (US)โIran conflict.
The Guardian reported on Thursday that Lebanon will push for a one-month extension of the current ceasefire with Israel during a second round of direct talks in Washington. Israelโs Ambassador to the United Nations (UN), Danny Danon, said in a CNNย Newsย interview on Friday that the Lebanon ceasefire extension is “not 100%”.
The US military intercepted two Iranian oil supertankers attempting to evade its blockade, as Washington presses ahead with efforts to curb Iranโs shipping, while Tehran continues to threaten vessels in the Strait of Hormuz. US military officials are also preparing contingency plans to target Iranโs capabilities in the Strait should the current ceasefire collapse.
On the US data front. Weekly Initialย Jobless Claimsย rose to 215K from 212K, indicating continued strength in the labor market. Meanwhile, S&P Global PMIs surprised to the upside, with Manufacturing at 54.0 and Services at 51.3, pointing to sustained expansion in business activity.
Earlier this week, Swiss data showed the Trade Surplus narrowed to CHF 2.7 billion in March, down from a downwardly revised six-month high of CHF 4.4 billion in February. Imports jumped 10.1% MoM to a four-month high of CHF 19.6 billion, while exports increased modestly by 1% to CHF 22.4 billion.
The upside ofย the USD/CHF pairย could be restrained as the Swiss Franc (CHF) may find support from safe-haven inflows. Additionally, the CHF may also gain ground as rising concerns over a prolonged energy-driven inflation shock reinforce expectations of a more hawkish Swiss National Bank (SNB). Market participants expect theย SNBย to intervene in FX markets to curb a rapid and excessive appreciation of the CHF.
USD/JPY trades with a positive bias for the fifth straight day and flirts with a nearly two-week top.
Economic concerns due to the Hormuz standoff and delayed BoJ rate hike bets undermine the JPY.
Less dovish Fed expectations support the USD and the pair, though intervention fears cap the upside.
The USD/JPY pair sticks to its positive bias for the fifth straight day and trades around the 159.80 area, or a nearly two-week top during the Asian session on Friday. Spot prices remain on track to register strong weekly gains, though the mixed fundamental backdrop makes it prudent to wait for a breakout through over a one-month-old range before positioning for a firm near-term direction.
The Japanese Yen (JPY) continues with its relative underperformance amid economic concerns stemming from intensifying tensions in the Middle East, which, along with a bullish US Dollar (USD), acts as a tailwind for the USD/JPY pair. Investors remain skeptical about a durable agreement between the US and Iran amid the lack of progress in peace talks due to the American blockade of Iranian ports. Iran has set the complete removal of the US naval blockade as a strict precondition for resuming negotiations.
Meanwhile, Iran attacked three ships in the Strait of Hormuz on Wednesday and seized two of them. This adds to worries that Japan’s economy will come under substantial strains due to continued disruptions to energy supplies through the strategic waterway. Adding to this, expectations that the Bank of Japan (BoJ) will hold interestย ratesย steady at its upcoming April meeting, bolstered by the latest inflation figures, turn out to be another factor undermining the JPY and supporting the USD/JPY pair.
A government report showed that Japan’s headline Consumer Price Index (CPI) recovered from its lowest level in nearly four years and rose to the 1.5% YoY rate in March. Moreover, the core gauge, which excludes volatile fresh food costs, climbed 1.8% from 1.6% in February, though it remained below the BoJ’s 2% annual target. That said, the Core CPI that excludes both fresh food and fuel costs rose 2.4%, suggesting that price pressures remain sticky and backing the case for an imminentย BoJย rate hike.
The data, however, does little to provide any respite to the JPY bulls. The US Dollar (USD), on the other hand, preserves its gains registered over the past three days amid persistent geopolitical uncertainties and fading dovish USย Federal Reserveย (Fed) bets. This further contributes to a positive tone surrounding the USD/JPY pair. However, speculations that Japanese authorities will step in to stem further weakness in the domestic currency help limit deeper JPY losses and cap gains for the currency pair.
USD/CAD holds ground as the US Dollar remains firm on safe-haven demand amid persistent USโIran conflict uncertainty.
US intercepted two Iranian supertankers evading its blockade, as Tehran threatens vessels in the Strait of Hormuz.
Higher energy prices raise the likelihood of a more hawkish Bank of Canada stance.
USD/CADย remains flat following a three-day winning streak, trading around 1.3700 during the Asian hours on Friday. The pair steadies as the US Dollar (USD) maintains its position as safe-haven demand increases amid persistent uncertainty surrounding the United States (US)โIran conflict.
Bloomberg reported on Thursday that the US military intercepted two Iranian oil supertankers attempting to evade its blockade, as Washington presses ahead with efforts to curb Iranโs shipping while Tehran continues to threaten vessels in the Strait of Hormuz. US military officials are also preparing contingency plans to target Iranโs capabilities in the Strait should the current ceasefire collapse.
US President Donald Trump warned that if Iran does not move its oil, its infrastructure would be targeted. Iranian officials, however, denied agreeing to any extension of the truce and accused Washington of breaching it by maintaining a naval blockade on Iranian trade.
The Greenback also found additional support from resilient US economic data. Weekly Initialย Jobless Claimsย rose to 215K from 212K, indicating continued strength in the labor market. Meanwhile, S&P Global PMIs surprised to the upside, with Manufacturing at 54.0 and Services at 51.3, pointing to sustained expansion in business activity.
The latest data showed that higher energy prices lifted Canadaโs annual consumer inflation by 0.6% to 2.4% in April, in line with Bank of Canada (BoC) warnings that rising energy costs are feeding into inflation expectations.
Elevated energy prices have increased the likelihood of a more hawkish response from the Bank of Canada. Oil and refined product prices moved sharply higher as commercial vessels transiting the Strait of Hormuz came under attack from both the US and Iran, reinforcing the risk of prolonged disruptions to tanker flows from the region.
Oil-driven inflation fears prompt markets to price in a higher-for-longer interest rate outlook.
EUR/USD rebounds on Thursday after trading under pressure earlier in the day, as the US Dollar (USD) loses momentum, allowingย the Euroย (EUR) to recover from intraday lows despite upbeat US Purchasing Managers Index (PMI) data and cautious market sentiment amid US-Iran tensions.
At the time of writing, EUR/USD is trading around 1.1714, bouncing from an intraday low of 1.1679. Meanwhile, the US Dollar Index (DXY), which tracks the Greenbackโs value against a basket of six major currencies, is trading around 98.57 after hitting an intraday high of 98.80.
The preliminary S&P Globalย Manufacturing PMIย rose to 54.0 in April, beating expectations and up from 52.3 in March, marking a 47-month high. The S&P Global Services PMI also improved to 51.3, above forecasts of 50.0 and up from 49.8, reaching a two-month high, with both coming above expectations.
Meanwhile, US Initial Jobless Claims rose to 214K in the week ending April 18, above the 212K forecast and up from 208K previously.
Despite the strong PMI data, the US Dollar failed to capitalize on the upside surprise, with the pullback likely technical in nature. However, the downside should remain limited amid ongoing US-Iran tensions in the Strait of Hormuz and stalled peace talks.
In the latest developments, US President Donald Trump said on Truth Social that โwe have total control over the Strait of Hormuz, no ship can enter or leave without the approval of the United States Navy.โ He also added that he has ordered the Navy to โshoot any boat putting mines in Hormuz,โ stating that the route is โsealed up tightโ until Iran is able to make a deal.
Iranโs stance remains firm, with officials insisting that the US must remove the naval blockade, which Tehran views as a violation of the ceasefire and a key obstacle to resuming negotiations. Mohammad Bagher Ghalibaf, the speaker of the Iranian parliament and lead negotiator, said late on Wednesday that reopening the Strait of Hormuz would be โimpossibleโ while the US and Israel committed โflagrantโ breaches of the ceasefire.
As the Strait of Hormuz remains under a dual blockade, ongoing supply disruptions are keeping Oil prices elevated and inflation risks in focus. This is adding pressure on central banks to maintain a tighter monetary policy stance. Markets are increasingly pricing in potential rate hikes from the European Central Bank (ECB), while expecting theย Federal Reserveย (Fed)to keep interestย ratesย on hold, a shift from earlier expectations of rate cuts.
Looking ahead, market sentiment is likely to remain sensitive to developments in the USโIran conflict, with EUR/USD largely at the mercy of US Dollar dynamics.
The Overbalance analysis aims to identify three financial instruments, analyzed primarily on the daily/four-hour (D1/H4) timeframe. The analysis uses only the Overbalance methodology, which helps determine where a trend may continue or where it may reverse. Todayโs analysis covers three instruments, evaluated solely in terms of 1:1 correction structures EURCAD Since March 10, EURCAD has been trading in an uptrend; however, during yesterdayโs session, the local 1:1 bullish pattern was negated at the 1.6040 level. According to the Overbalance methodology, this may support a scenario involving a return to the downtrend. Further confirmation would be a return of the price below the 1.5948 level, i.e., back into the previous downtrend. On the other hand, a break above 1.6040 could restore the bullish scenario.
EURCAD – H4 timeframe. Source: xStation EURUSD Since mid-March, the EURUSD has been trending upward, but in recent days we have seen a downward correction. The price is approaching key support at the 1.1650 level, which stems from the lower boundary of the local 1:1 pattern. A potential bounce at this point could lead to the generation of another upward impulse. Conversely, a sustained break below the 1.1650 level would open the way for a return to the downtrend.
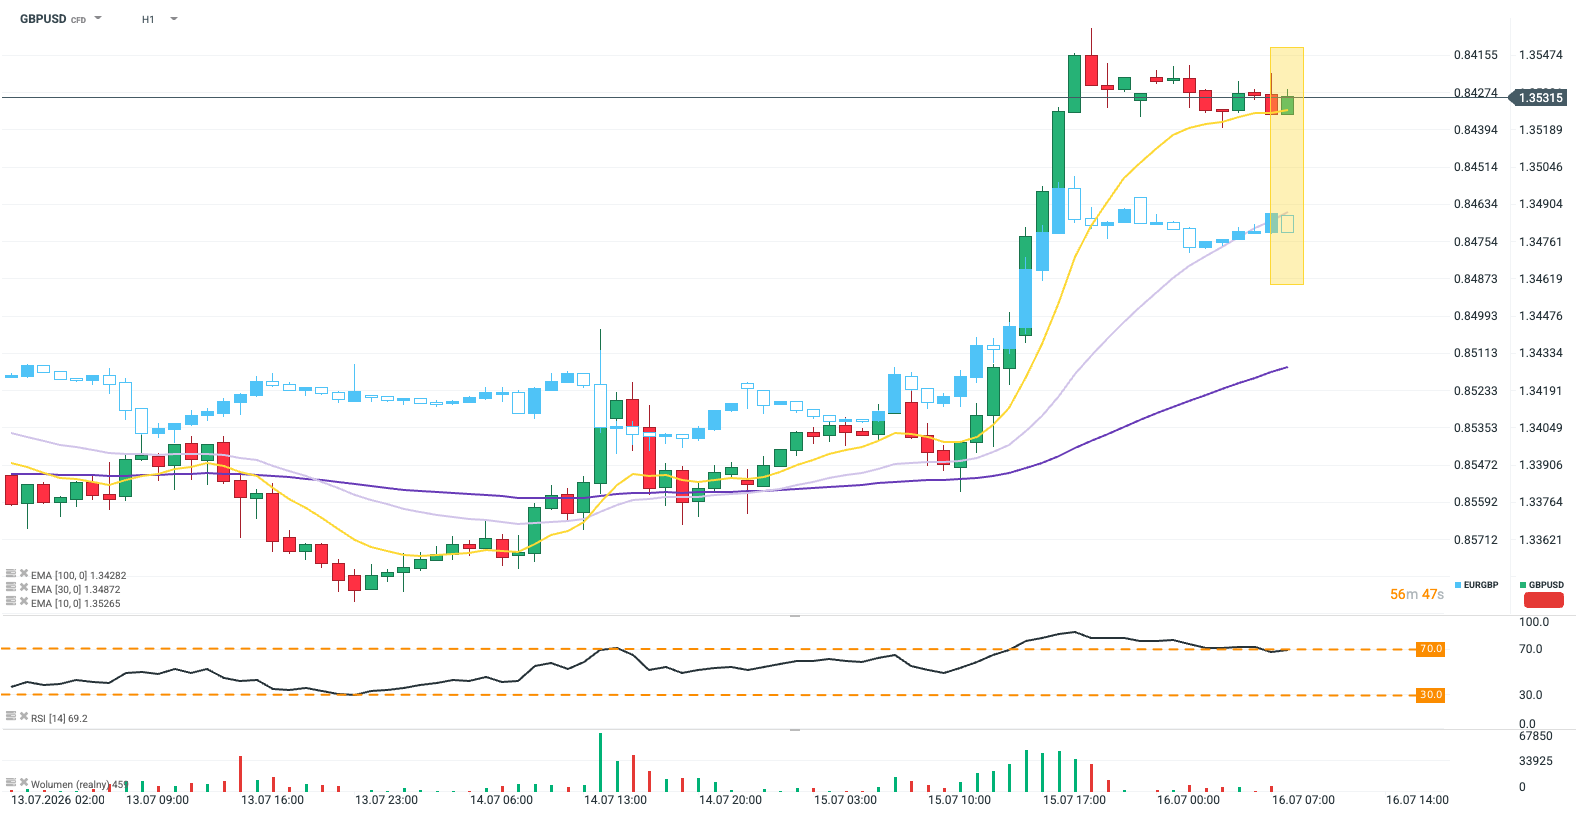
EURUSD – H4 chart. Source: xStation GBPUSD The GBPUSD pair is showing a situation very similar to that of the EURUSD. An uptrend has been in place since late March, but a correction has emerged in recent days. Should this correction deepen, the key support level remains at 1.3428. A break below this level could open the way for declines, which would be confirmed upon a drop below 1.3360โthe polarity of the previously negated 1:1 downward geometric pattern.
AUD/USD posts a modest decline despite improving Australian PMI data.
Rising tensions between the United States and Iran dampen risk appetite.
PMI data may provide short-term direction.
AUD/USDย trades around 0.7140 on Thursday, down 0.27% on the day, moving within a tight range as market sentiment remains pressured by geopolitical tensions.
The Australian Dollar (AUD) struggles to benefit from supportive domestic data. S&P Globalโs Purchasing Managers Index (PMI) reports show manufacturing activity returning to expansion territory, while the services sector also rebounds. However, these positive signals are offset by a still-uncertainย outlook, marked by weak demand and rising costs.
The main source of pressure comes from the global backdrop. Escalating tensions between the United States (US) and Iran are fuelingย risk aversion, following incidents in the Strait of Hormuz and the lack of progress in peace negotiations. This environment supports demand for safe-haven assets and weighs on risk-sensitive currencies such as the AUD.
According to Sociรฉtรฉ Gรฉnรฉrale, the Australian Dollar remains particularly vulnerable in this context due to its reliance on imported petroleum products. The bank highlights that this exposure could amplify AUD volatility, especially in the event of prolonged supply disruptions.
On the US side, the latest labor market data shows Initialย Jobless Claimsย rising slightly to 214K, above expectations. However, the release has had a limited impact on the US Dollar (USD), as investors remain primarily focused on geopolitical developments and Oil price dynamics.
Meanwhile, the US Dollar is supported by higher Treasury yields and reduced expectations ofย Federal Reserveย (Fed) rate cuts. The US Dollar Index (DXY) is moving higher, reflecting this trend.
In this environment, AUD/USD remains highly sensitive to geopolitical headlines and upcoming macroeconomic releases, particularly the US PMI figures due later in the day, which could provide further clues on monetary policy expectations.
US Dollar Price Today
The table below shows the percentage change of US Dollar (USD) against listed major currencies today. US Dollar was the strongest against the New Zealand Dollar.
USD
EUR
GBP
JPY
CAD
AUD
NZD
CHF
USD
0.11%
0.10%
0.02%
0.06%
0.20%
0.46%
0.11%
EUR
-0.11%
0.00%
-0.11%
-0.05%
0.07%
0.35%
-0.03%
GBP
-0.10%
-0.00%
-0.09%
-0.05%
0.09%
0.36%
-0.03%
JPY
-0.02%
0.11%
0.09%
0.03%
0.19%
0.42%
0.08%
CAD
-0.06%
0.05%
0.05%
-0.03%
0.15%
0.40%
0.03%
AUD
-0.20%
-0.07%
-0.09%
-0.19%
-0.15%
0.27%
-0.13%
NZD
-0.46%
-0.35%
-0.36%
-0.42%
-0.40%
-0.27%
-0.39%
CHF
-0.11%
0.03%
0.03%
-0.08%
-0.03%
0.13%
0.39%
The heat map shows percentage changes of major currencies against each other. The base currency is picked from the left column, while the quote currency is picked from the top row. For example, if you pick the US Dollar from the left column and move along the horizontal line to the Japanese Yen, the percentage change displayed in the box will represent USD (base)/JPY (quote).
The USDJPY pair continues to trade in a heightened uncertainty environment, where geopolitical factors, macroeconomic data, and growing expectations regarding Bank of Japan policy are all influencing price action at the same time. The market is moving around key technical levels, with particular attention focused on the 160 area, which has been consistently defended and is widely viewed as a significant psychological barrier as well as a potential intervention zone for Japanese authorities. This raises an increasingly important question: whether this level will eventually be broken, and if so, under what conditions and timing. The current dynamics are driven both by global geopolitical tensions and by an intensifying debate over the possible normalization of monetary policy in Japan.
Source: xStation5
What drives USDJPY pricing?Geopolitics and the Strait of Hormuz as a source of global risk aversion
One of the key drivers of market sentiment remains geopolitical tensions in regions critical for global energy transport, such as the Strait of Hormuz. The market reacts very sensitively to any risk of disruptions in oil and gas flows, which leads to higher energy prices and increased volatility. Japan is heavily dependent on energy imports, largely sourced from the Persian Gulf region. As a result, rising oil and gas prices deteriorate Japanโs trade balance and increase imported inflation pressures. Therefore, prolonged tensions in the Hormuz region do not necessarily support the yen. Instead, they tend to weaken it. In this context, geopolitics does not provide a clear directional signal for USDJPY, but rather reinforces upside pressure on the pair while increasing overall volatility.
Japanese macro data and PMI signals
Recently, Japanese PMI data has attracted more attention, showing a gradual improvement in economic activity. While this is not yet a strong upward trend, signs of stabilization in both manufacturing and services increase the likelihood that the Bank of Japan will have more room to continue normalizing monetary policy. For the FX market, this is important because the yen has remained under pressure for years due to ultra-loose monetary conditions. Even small shifts in this area can have a meaningful impact on global capital flows.
Inflation (CPI) as a key BOJ catalyst
One of the most important short-term drivers remains Japanese CPI data, which plays a central role in shaping expectations regarding future Bank of Japan actions. If inflation remains above the 2% target, markets increasingly price in the possibility of further rate hikes or at least a more hawkish communication stance from the central bank. In such a scenario, upward pressure on the yen increases. Conversely, weaker inflation data reinforces expectations that ultra-loose policy will be maintained for longer, which supports further yen weakness against the dollar.
Bank of Japan policy and interest rate differentials
A key medium- and long-term factor remains Bank of Japan policy, which is gradually moving away from its long-standing regime of ultra-low interest rates and yield curve control. Even though this process is slow, its direction is highly significant for markets. USDJPY is particularly sensitive to the interest rate differential between the US and Japan, which has been a major driver of yen weakness through carry trade strategies for years. Any narrowing of this spread could trigger significant capital flows and lead to shifts in the medium-term trend.
The 160 level and intervention risk
The 160 level on USDJPY remains a key reference point, both technically and politically. Historically, levels around this area have been repeatedly highlighted as zones of heightened vigilance by Japanese authorities regarding excessive FX volatility. As a result, markets are increasingly pricing in the risk of intervention by the Japanese Ministry of Finance, which may take the form of either verbal warnings or direct FX market operations. Such interventions typically result in sharp but often short-lived strengthening of the yen.
Key Takeways
USDJPY remains in a high-volatility environment where direction is driven simultaneously by macroeconomic data, geopolitical developments, and central bank policy.
Geopolitical tensions, including the situation in the Strait of Hormuz, increase global risk aversion.
Japanese macro data, particularly PMIs, indicate gradual economic improvement and support the case for further BOJ normalization.
Inflation (CPI) remains a key short-term catalyst for BOJ expectations and the yenโs direction.
BOJ policy is becoming an increasingly important source of volatility, with even small communication shifts capable of moving the market.
The USโJapan interest rate differential remains the core structural driver of USD/JPY, and its potential narrowing could reshape medium-term dynamics.
The 160 level represents a major psychological and political barrier, increasing the risk of intervention or verbal action by Japanese authorities.
The market remains in a phase dominated by expectations and narratives, which supports sharp but often short-lived price moves.
To provide the best experiences, we use technologies like cookies to store and/or access device information. Consenting to these technologies will allow us to process data such as browsing behavior or unique IDs on this site. Not consenting or withdrawing consent, may adversely affect certain features and functions.
Functional
Always active
The technical storage or access is strictly necessary for the legitimate purpose of enabling the use of a specific service explicitly requested by the subscriber or user, or for the sole purpose of carrying out the transmission of a communication over an electronic communications network.
Preferences
The technical storage or access is necessary for the legitimate purpose of storing preferences that are not requested by the subscriber or user.
Statistics
The technical storage or access that is used exclusively for statistical purposes.The technical storage or access that is used exclusively for anonymous statistical purposes. Without a subpoena, voluntary compliance on the part of your Internet Service Provider, or additional records from a third party, information stored or retrieved for this purpose alone cannot usually be used to identify you.
Marketing
The technical storage or access is required to create user profiles to send advertising, or to track the user on a website or across several websites for similar marketing purposes.