

China’s offshore yuan strengthened to around 6.78 per dollar on Friday, extending gains from the previous session to its strongest level in nearly three weeks after the People’s Bank of China signaled greater tolerance for currency appreciation. The central bank set the yuan’s daily reference rate at 6.7989 per dollar, stronger than Thursday’s fixing of 6.8036 and below the closely watched 6.80 threshold for the first time since 2023. A fixing below 6.80 per dollar is widely viewed by investors as an indication that authorities are not seeking to restrain the yuan’s recent appreciation. Attention is now turning to a packed slate of Chinese economic releases due next week, including trade data, second-quarter GDP, industrial production, retail sales, and the unemployment rate. The figures are expected to provide fresh insight into the strength of the economy and could shape expectations for the yuan’s near-term direction.

Yen Jumps on Intervention Fears
The Japanese yen strengthened past 161.5 per dollar on Friday, erasing all of its losses from earlier in the week as traders remained alert to the possibility of official intervention after the currency weakened to fresh 40-year lows. Market participants are now awaiting intervention data due later this month to determine whether Japanese authorities were behind the sharp but short-lived rallies seen in recent weeks. Investors also assessed data showing Japan’s producer prices climbed 7.1% in June, marking the fastest annual increase since March 2023 amid persistent cost pressures linked to the Middle East conflict and the yen’s sharp depreciation. Meanwhile, oil prices retreated after reports indicated that the US and Iran will continue peace negotiations despite a recent escalation in hostilities. That weighed on the dollar and Treasury yields while easing pressure on the yen by reducing import cost concerns for Japan, which depends heavily on Middle Eastern oil.

GBP/USD Price – Holds a constructive bullish tone above 1.3400 as UK political risk eases
- GBP/USD gathers strength to near 1.3405 in Thursday’s early European session.
- The pair maintains constructive bias, with a mildly bullish RSI momentum.
- The first upside barrier emerges at 1.3470; the initial support level to watch is 1.3300.
The GBP/USD pair trades in positive territory around 1.3405 during the early European trading hours on Thursday. Fading political uncertainty in the United Kingdom (UK) provides some support to the British Pound (GBP) against the US Dollar (USD).
Following the resignation of Keir Starmer in late June, UK political risk has eased significantly. The formal race to replace outgoing Prime Minister Keir Starmer begins on July 9. Frontrunner Andy Burnham is widely expected to become Prime Minister by July 20.
Technical Analysis:
In the daily chart, GBP/USD holds a mildly bullish near-term bias as price sits above the Bollinger middle band and the 100-day simple moving average (SMA). The pair is pressing the upper half of the recent range, with the Bollinger Bands (20, 2) still widening modestly, while the Relative Strength Index (14) at 57.6 suggests constructive but not overextended upside momentum.
On the topside, initial resistance is aligned with the Bollinger upper band at 1.3470, where buyers could hesitate. On the downside, immediate support is provided by the Bollinger middle band near 1.3300, while a deeper pullback would likely be contained by the Bollinger lower band around 1.3130.

Rupee Pauses Decline After RBI FX Intervention
The Indian rupee hovered around 95.5 per dollar, pausing losses as traders pointed to likely intervention by the Reserve Bank of India through dollar sales to temper volatility. The currency remained under pressure, however, amid renewed geopolitical tensions after fresh US military strikes on Iran and retaliatory attacks on Kuwait and Bahrain fueled concerns over oil supplies. Brent crude remained on the rise, gaining more than 8% over the previous two sessions. Broader market caution also weighed on domestic assets, sending the benchmark 10-year government bond yield up 7 basis points on Wednesday, its biggest one-day rise in over three months, while Indian equities fell 2%, their steepest drop over the same period. Meanwhile, Fed meeting minutes reinforced expectations of tighter US monetary policy, with futures implying a one-in-three chance of a rate hike this month and a two-in-three probability by September.

Offshore Yuan Snaps 3-Day Losing Streak
The offshore yuan rose to around 6.79 per dollar on Thursday, snapping a three-session losing streak, as stronger producer-price growth reinforced expectations that deflationary pressures are easing despite still-muted consumer demand. Annual producer inflation rose to 4.1% in June from 3.9% in May, marking the fastest pace since July 2022, supported by higher commodity and energy costs amid the Middle East tensions. Meanwhile, annual consumer inflation eased to a three-month low of 1% from 1.2% in May. While rising global prices for oil, semiconductors, and industrial metals have lifted factory-gate prices, weak domestic demand has limited cost pass-through to consumers, keeping pressure on profit margins. On the monetary policy front, the central bank reiterated its commitment to maintaining an appropriately accommodative stance and strengthening financial support for domestic consumption, while acknowledging the persistent imbalance between robust supply and relatively weak demand.
Yen Pressured by US-Iran Tensions
The Japanese yen traded around 162.5 per dollar on Thursday, hovering near 40-year lows as renewed conflict between the US and Iran drove oil prices higher, adding pressure to Japan’s oil-dependent economy and weighing on the currency. The US military confirmed it had carried out strikes on Iran for a second straight day, while Tehran threatened a large-scale retaliatory operation against US military bases across the region. Meanwhile, traders continued to maintain bearish positions on the yen amid the absence of intervention from Japanese authorities despite repeated warnings from Tokyo. Investors are now awaiting official intervention data later this month to determine whether the government was behind the yen’s sharp but short-lived rally on July 2. Separately, Japan’s government revised its latest draft of the annual policy agenda, calling for appropriate monetary policy that supports stable price growth.

Dolar snaps back – the return of Middle East hostilities drains currency markets
ge market has turned defensive following a sudden escalation in the conflict between Iran and the United States. Iran’s attack on commercial vessels in the Strait of Hormuz brought an end to the month-long ceasefire that had been in place. As a result, the geopolitical risk premium has returned to the FX market, draining capital from most currencies and redirecting it toward the U.S. dollar. Timeline of the escalation: How did the memorandum collapse?
The renewed escalation followed the sequence of events below:
- Signing of the memorandum: Last month, the United States and Iran reached a temporary 60-day agreement. The deal guaranteed safe, toll-free passage for ships through the Strait of Hormuz in exchange for the temporary suspension of U.S. sanctions on Iranian oil exports and the launch of negotiations over Tehran’s nuclear program.
- Iran attacks commercial vessels (beginning of the escalation): Iran violated the agreement by targeting three commercial ships transiting the Strait of Hormuz, including an LNG tanker carrying liquefied natural gas.
- U.S. retaliation: In response to the attacks on commercial shipping, U.S. forces launched a large-scale retaliatory strike against more than 80 targets across Iran. Washington also immediately reinstated sanctions on Iranian oil trade.
- Iranian counterattack: Tehran responded with another wave of strikes, this time targeting sites in Bahrain and Kuwait.
- Official end of the ceasefire: Speaking to reporters during the NATO summit in Ankara, Donald Trump ended any speculation by declaring that the ceasefire was over (“as far as I’m concerned, it’s over”). The President sharply criticized the Iranian leadership, calling them “scum” and “liars,” effectively ruling out any near-term return to diplomacy.
FX market reversal: Risk aversion weighs on emerging-market currencies
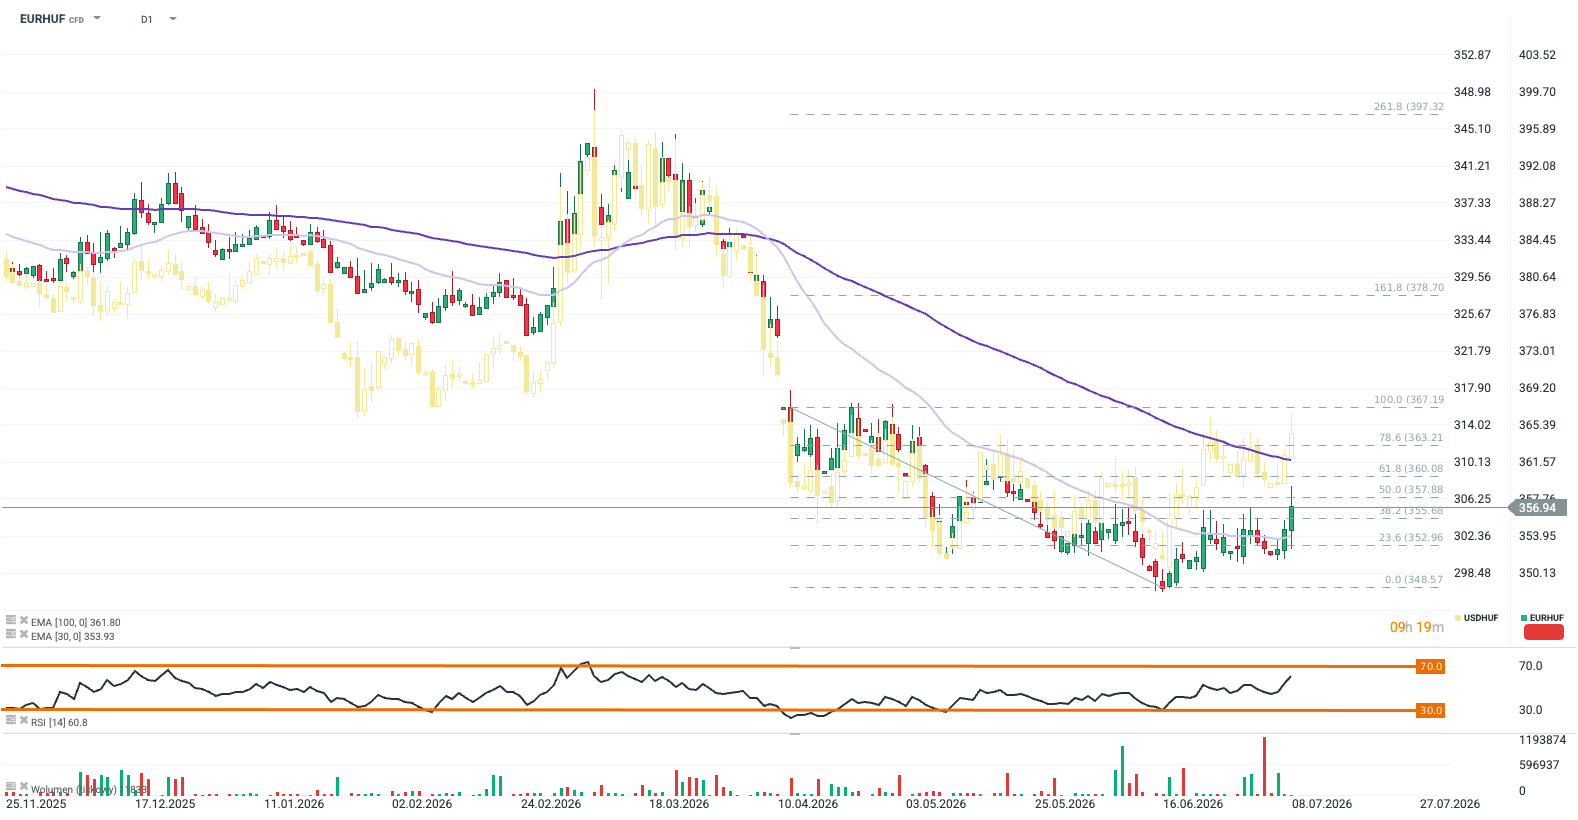
Smaller emerging-market currencies are the biggest losers of today’s session, rapidly surrendering the gains accumulated during the past several weeks of relative geopolitical calm. The Hungarian forint is the weakest performer today ( EUR/HUF: +0.85%, USD/HUF: +1.0% ), falling to a two-month low against the euro and a three-month low against the U.S. dollar. However, the forint entered this new phase of the Middle East conflict from a position of considerable strength, retreating from multi-year highs reached on the back of investor optimism following Peter Magyar’s party’s victory in the parliamentary elections. For the HUF, the current move may represent a justified correction after most positive developments had already been priced in. Any further appreciation will likely depend on more structural improvements in the Hungarian economy, particularly stronger foreign direct investment. Alongside the forint, the South African rand (USD/ZAR: +0.6%, EUR/ZAR: +0.4%) and the Indian rupee (USD/INR: +0.5%) are also posting broad losses. India remains directly dependent on crude oil shipments passing through the Strait of Hormuz, while South Africa relies heavily on refined petroleum products. Meanwhile, the Polish zloty is down around 0.3% against both the euro and the U.S. dollar.
Chart 1: EUR/HUF and USD/HUF exchange rates (yellow)
Source: xStation5
EUR/USD: Bears regain the upper hand
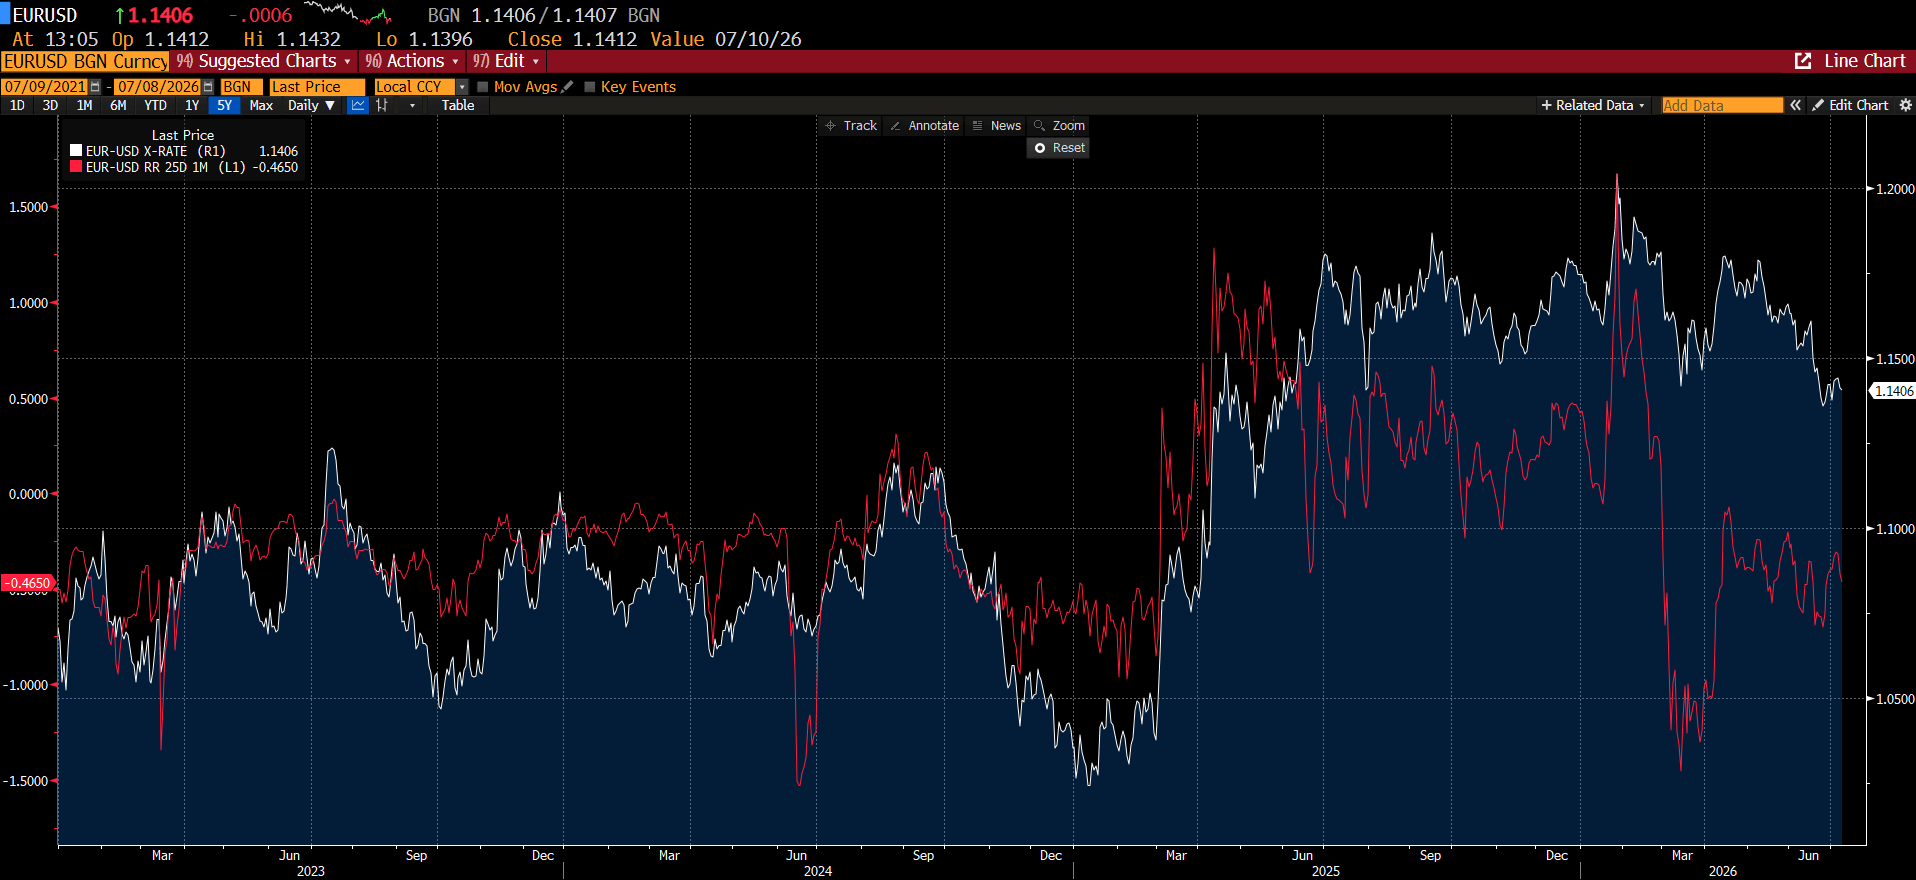
The increase in risk aversion is also weighing on the broader G10 currency complex. The only notable exceptions are the New Zealand dollar , supported by the Reserve Bank of New Zealand’s recent rate hike to 2.50% and hawkish remarks from the RBNZ Governor, and the Norwegian krone , which continues to benefit from renewed upward pressure on oil prices. The resumption of hostilities in the Middle East has effectively erased a week’s worth of gains on EUR/USD. The world’s most traded currency pair has declined by roughly 0.4% since yesterday and, despite relatively flat trading today, remains vulnerable to further downside. This is especially true given that the European Central Bank is unlikely to respond with the kind of reactive hawkish rhetoric that would provide meaningful support for the euro. Options market participants are also increasingly hedging against further EUR/USD declines. The one-month Risk Reversal indicator has remained below zero almost continuously since March 2026, indicating that demand for EUR/USD put options exceeds demand for call options. In other words, investors are showing a greater preference for contracts that protect against further euro weakness.
Chart 2: One-month EUR/USD Risk Reversal and EUR/USD spot
Source: Bloomberg Finance LP
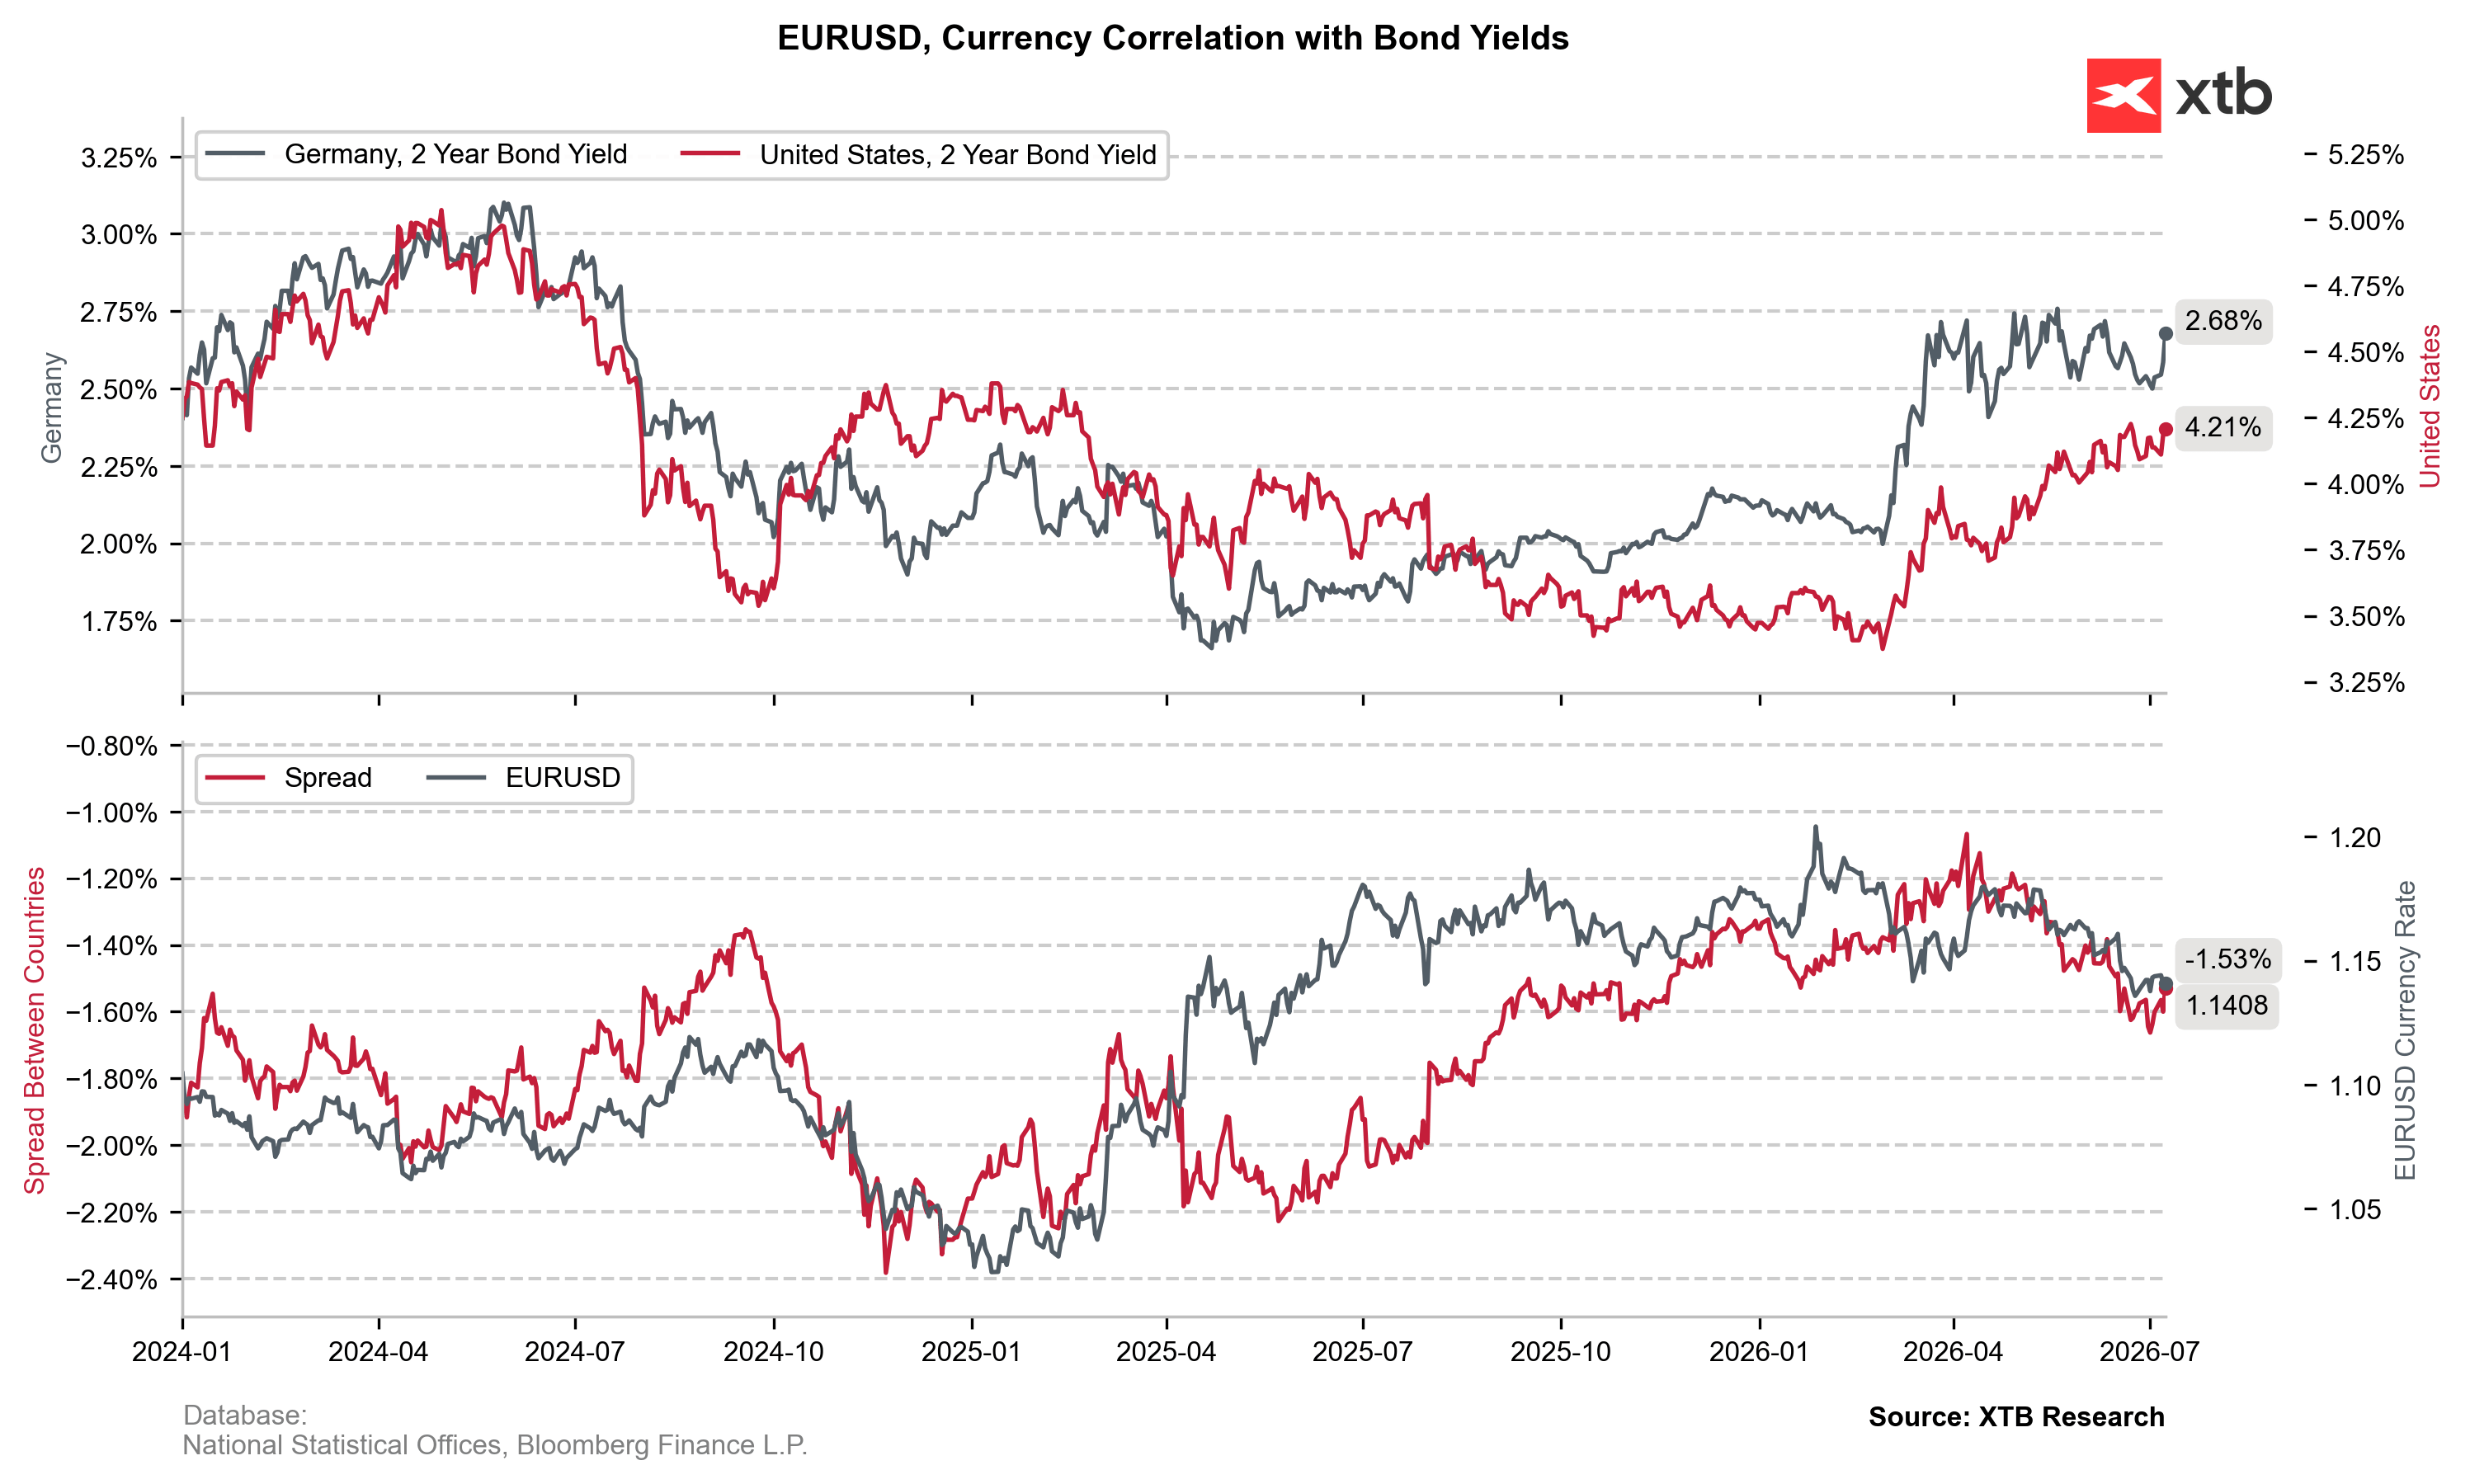
On the other hand, developments in the bond market may provide fundamental support for EUR/USD. Yields on two-year German government bonds have rebounded much more sharply (around +10 bps) than their U.S. counterparts, reflecting the euro area’s significantly greater sensitivity to a prolonged energy shock. If military tensions persist over the longer term, the ECB may be forced to adopt a more hawkish, inflation-focused stance. Even without additional rate hikes, such a shift in communication could help EUR/USD defend support around 1.1400. Chart 3: EUR/USD and the yield spread between two-year German and U.S. government bonds
Source: Bloomberg Finance LP
