Currency Hedger No Comments

Canadian Dollar sits near two-month top vs USD amid bullish oil prices

  • USD/CAD languishes near a two-month low as bullish oil prices continue to underpin the Loonie.
  • Geopolitical uncertainties, inflation risks and Fed hike bets support the USD and help limit losses.
  • Traders also seem hesitant and await the latest US inflation figures before placing directional bets.

The USD/CAD pair is seen consolidating its recent losses to a two-month low, touched last week, and trading below mid-1.3900s during the Asian session on Tuesday. Traders now seem hesitant to place aggressive directional bets amid a mixed fundamental backdrop and ahead of the crucial US inflation figures.

The US-Iran standoff dampens hopes for a swift reopening of the Strait of Hormuz, which, along with restricted shipping traffic through the Bab el-Mandeb Strait, continues to fuel supply concerns and supports crude oil prices. Moreover, Friday’s upbeat Canadian employment details seem to underpin the commodity-linked Loonie and act as a headwind for the USD/CAD pair, though a modest US Dollar (USD) strength helps limit the downside.

Investors remain worried about inflation risks stemming from volatile oil prices, which might force the US Federal Reserve (Fed) to adopt a more hawkish stance. In fact, traders are still pricing in a greater possibility that the US central bank will hike interest rates at least once by the end of this year. This, along with geopolitical uncertainties, assists the safe-haven buck in preserving the previous day’s modest gains and acts as a tailwind for the USD/CAD pair.

Traders, however, opt to wait for more cues about the Fed’s future policy path before positioning for the next leg of a directional move. Hence, the focus will remain glued to the US Consumer Price Index (CPI) and the Producer Price Index (PPI), due for release on Wednesday and Thursday, respectively. The crucial data, along with further developments surrounding the Middle East crisis, should provide a fresh impetus to the USD and the USD/CAD pair.

USD/CAD daily chart

Chart Analysis USD/CAD

Technical Analysis

The USD/CAD pair trades just above the 100-day Simple Moving Average (SMA) at 1.3918, with a break below this level likely to expose the recent closing area around 1.3900. On the flip side, spot prices would need to clear recent swing highs to extend the advance, while the close proximity of price to the 100-day SMA hints at a consolidation phase rather than an aggressive trend move.


Currency Hedger No Comments

Japanese Yen holds range in thin holiday trading amid intervention speculations

  • Japanese Yen holds steady during Mountain Day holiday while markets weigh potential intervention amid thin liquidity.
  • The BoJ may raise rates in September to counter inflation from a weak yen and rising oil.
  • A weak July US payrolls report created headwinds for the US Dollar, introducing rate uncertainty following dovish policy repricing.

USD/JPY moves little after posting nearly 1% gains in the previous day, trading around 159.30 during the Asian hours on Tuesday. The pair moved little today, trading in tight ranges as market volumes remained thin with Japanese markets closed for the Mountain Day holiday.

The Japanese Yen (JPY) has retraced about half of the gains made during its recent intervention-driven rally, directly testing the resolve of officials in both Tokyo and Washington to support the currency.

According to a Reuters analyst, Japan’s decision not to follow through on its joint intervention, especially by failing to amplify Friday’s US Dollar (USD) weakness following soft US jobs data, suggests a passive strategy designed merely to slow the Dollar’s rise rather than fundamentally reverse the Yen’s multi-year decline. This distinction is critical for market positioning, as investors remain heavily short on the Yen, holding the largest net-short positions since early 2024. With liquidity reduced, analysts note that Tuesday’s holiday in Japan could serve as a prime strategic window for authorities to launch another intervention.

Meanwhile, monetary policy expectations in Japan continue to shift. According to Jiji Press, the Bank of Japan (BoJ) may consider another interest rate increase at its upcoming September 17โ€“18 meeting, following its rate hike in June, to combat growing inflationary risks. Domestic prices face upward pressure from rapid growth in artificial intelligence-related demand, the Yen’s ongoing depreciation, and elevated global crude oil prices. A September hike would mark an accelerated timeline for the central bank, upending the consensus among financial market participants who had previously anticipated rate increases roughly once every six months.

Yen rates market leans toward BoJ lift-off by year-end

BNYโ€™s Wee Khoon Chong notes that rate expectations have shifted meaningfully, with markets now โ€œpricing in roughly a 50% chance of a 25bp BoJ hike in September and a full hike by year-end,โ€ underscoring growing conviction that the BoJ will begin normalising policy over the coming months.

The USD/JPY pair holds losses as the US Dollar (USD) faces headwinds following a weaker-than-expected July payrolls report. The soft labor data sparked a dovish shift in market expectations, reintroducing two-sided policy risk into a market that had previously expected the Federal Reserve (Fed) to keep interest rates strictly on hold.

However, the US Dollar may regain its ground as geopolitical tension has driven a sharp rally in crude oil, which in turn has pushed Treasury yields higher. Concerns are growing that the Federal Reserve (Fed) may feel compelled to raise rates sooner rather than later, even against the backdrop of a cooling labor market.

Investors are now closely watching upcoming inflation data this week to gauge the Fed’s next move, with the CME FedWatch Tool showing that market-implied odds of a 25-basis-point Fed rate hike in September have climbed above 51%, up from 44.4% just a day prior.

Barkin flags uneasy labor tone but strong earnings keep Fed bias hawkish

Barkinโ€™s latest remarks strike a cautiously uneasy tone on the labor market, with the description of โ€œlow hire, low fireโ€ and a โ€œsector in weak balanceโ€ pointing to softer job dynamics despite no acute stress. The FXS Speechtracker score of 5.4/10 sits slightly below the historical average of 5.8/10, underscoring a modestly less confident stance, even as Barkin highlights โ€œquite strongโ€ and โ€œgrowing nicelyโ€ corporate earnings and explicitly watches those earnings for linkages to the job market. Overall, the mix of labor unease and solid corporate performance suggests a nuanced policy bias that is less upbeat than the established baseline but not decisively dovish for the Dollar.

The FXS Fed Sentiment Index fell by 1.68 points to 137.01, signaling a pullback in hawkish tone relative to recent communications. However, with the FXS Fed Sentiment Index still well above the neutral 100 mark, the Fed remains firmly in hawkish territory despite the softer labor rhetoric captured in the FXS Speechtracker.

Currency Hedger No Comments

New Zealand Dollar remains confined in a range vs USD amid Iran risks, ahead of US CPI

  • NZD/USD struggles to gain any meaningful traction amid mixed fundamental cues.
  • Geopolitical risks, inflation fears and Fed rate hike bets support the safe-haven USD.
  • The RBNZโ€™s hawkish tilt limits the downside for the NZD as traders await the US CPI.

The NZD/USD pair seesaws between tepid gains/minor losses during the Asian session on Tuesday and currently trades just below the 0.5900 mark. Spot prices, however, remain confined within a familiar range held over the past week or so, awaiting a fresh catalyst before the next leg of a directional move. Hence, the focus will remain on further developments surrounding the Middle East crisis and the latest US inflation figures this week.

The crucial US Consumer Price Index (CPI) and the Producer Price Index (PPI) are due for release on Wednesday and Thursday, respectively, which will be looked for more cues about the US Federal Reserve’s (Fed) future policy path. This, in turn, will play a key role in influencing the near-term US Dollar (USD) price dynamics and provide some meaningful impetus to the NZD/USD pair. In the meantime, the mixed fundamental backdrop is holding back traders from placing aggressive bets on the USD.

The disappointing US Nonfarm Payrolls (NFP) report forced investors to scale back their expectations for an immediate interest rate hike by the Fed. However, inflation risks stemming from volatile oil prices due to the Iran war underpin prospects for at least one Fed rate hike in 2026. The outlook remains supportive of elevated US Treasury bond yields, which, along with fading hopes for a US-Iran deal, continues to act as a tailwind for the safe-haven Greenback and caps the NZD/USD pair.

Iran ruled out any future negotiations with Trump and said that it will wait until the US Presidentโ€™s term ends on January 20, 2029, to resume talks, dampening hopes for a swift reopening of the Strait of Hormuz. Moreover, traffic through the Bab el-Mandeb Strait remains choked due to the Iran-backed Houthis’ naval blockade against Saudi Arabia. This favors USD bulls, though the Reserve Bank of New Zealand’s (RBNZ) hawkish tilt could limit deeper losses for the NZD/USD pair.

Strategists at BBH remain constructive on the Kiwi, arguing that โ€œNZD has room to keep edging higher against most major currencies.โ€ They point to โ€œabove target inflation, more favorable domestic growth outlook, and a policy rate near the lower-end of the RBNZโ€™s neutral range (2.20%-4.10%)โ€ as factors that โ€œargue for additional RBNZ rate hikes.โ€ Reflecting this backdrop, BBH notes that โ€œthe swaps curve price in nearly 100bps of cumulative tightening over the next twelve months to 3.50%,โ€ reinforcing the view that policy expectations continue to offer support for the currency.

NZD/USD 4-hour chart

Chart Analysis NZD/USD

Technical Analysis

The NZD/USD pair continues to consolidate in an over one-week-old range, leaving the near-term bias neutral. The focus remains on whether spot prices can sustain a move away from the 0.5880 area to define the next directional leg. A sustained push higher would open the way for a test of recent minor intraday highs, while a break lower from the current congestion zone would expose prior four-hour lows as the next bearish objective.

Currency Hedger No Comments

Euro flat lines near mid-1.1500s vs USD as traders await US CPI amid Iran uncertainty

  • EUR/USD is seen consolidating in a narrow band as USD preserves modest recovery gains.
  • Mideast tensions lift oil prices, fueling inflation fears and Fed hike bets, supporting the USD.
  • Traders also seem hesitant and opt to wait for the release of the latest US inflation figures.

The EUR/USD pair struggles to gain any meaningful traction and holds steady around the 1.1545-1.1550 area during the Asian session on Tuesday. Traders seem hesitant to place aggressive bets and opt to wait for further developments surrounding the Middle East crisis and this week’s release of the latest US inflation figures. Nevertheless, spot prices remain well within striking distance of the highest level since June 17, touched last Friday.

The disappointing US Nonfarm Payrolls (NFP) report forced investors to scale back their expectations for an immediate interest rate hike by the US Federal Reserve (Fed). This, in turn, fails to assist the US Dollar (USD) to capitalize on the previous day’s modest gains and acts as a tailwind for the EUR/USD pair. Investors, however, are still pricing in the possibility that the US central bank will raise borrowing costs by the end of this year amid inflation risks stemming from volatility in oil prices due to the Iran war.

In the latest developments surrounding the Middle East crisis, Iran ruled out any future negotiations with Trump and said that it will wait until the US Presidentโ€™s term ends on January 20, 2029, to resume talks, dampening hopes for a swift reopening of the Strait of Hormuz. Moreover, traffic through the Bab el-Mandeb Strait remains choked due to the Iran-backed Houthis’ naval blockade against Saudi Arabia. This remains supportive of the recent rise in crude oil prices to an over one-week high, fueling inflation fears.

Cleveland Fed President Beth Hammack said on Monday that the current rate is not meaningfully restricting the economy and that there is a need for some number of rate hikes. Hammack stressed that the longer the Fed waits, the longer it misses the 2% inflation goal. Hence, the focus will be on the US Consumer Price Index (CPI) and the Producer Price Index (PPI), due on Wednesday and Thursday, respectively. The data will provide more cues about the Fed’s future policy path and influence the USD and the EUR/USD pair.

According to TD Securities, the recent inflation dynamics are likely to “keep the Fed looking to August inflation data ahead of the September meeting,” reinforcing the central bankโ€™s data-dependent stance. The bank also highlights that “PPI on Thursday will also be a key input into PCE estimates,” underscoring the importance of upcoming producer price figures in shaping the broader inflation picture the Fed will assess.

Currency Hedger No Comments

Chart of the Day: USD/JPY Recovers After Disappointing Payroll Data

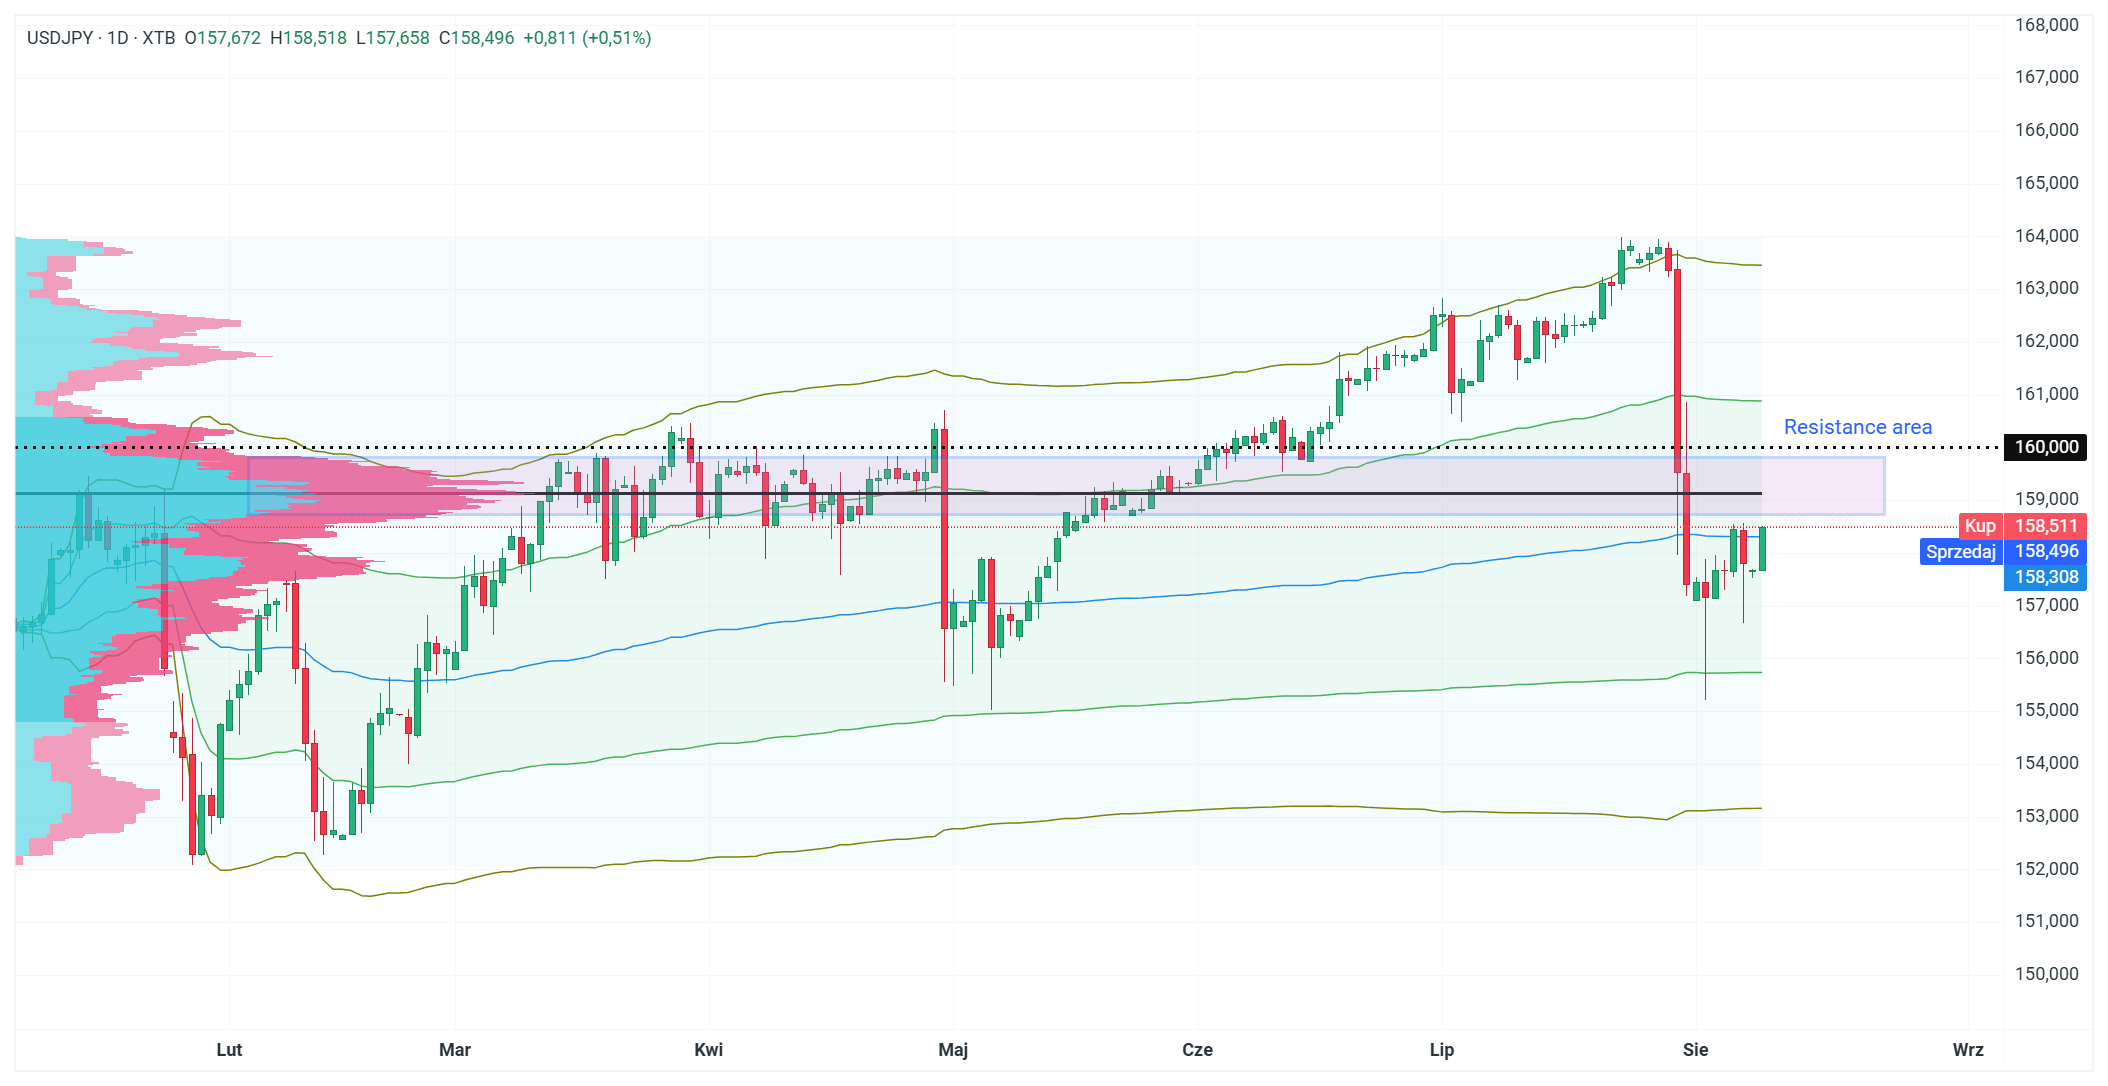
The USD/JPY exchange rate quickly recouped most of the losses triggered by the weak US labour market report and is trading on Monday around 158.20โ€“158.50, virtually where the pair stood prior to the data release. Fridayโ€™s payrolls figures showed a fall in employment of 23,000 against an expected increase of 80,000, triggering a sharp sell-off in the dollar and sending USD/JPY down from around 158.30 to approximately 156.70, before buyers quickly returned to the market. The marketโ€™s attention is now turning to Wednesdayโ€™s release of the US CPI for July, which will determine whether the Federal Reserve still has scope for a rate rise in September.

What the daily chart shows

The attached daily USD/JPY chart (D1 timeframe) shows a clear, well-defined uptrend that has been in place since February, with the price moving consistently along or above one standard deviation below the anchored VWAP since the start of 2026 (as the main support zone for the long-term uptrend). A key element of the chart pattern is the broad resistance zone around 159,000โ€“160,000, marked on the chart as “Resistance area” โ€“ the same level which previously, from March to May, acted as a consolidation zone and repeatedly rejected price movements (and currently constitutes the main cluster of the value zone when looking at the volume profile marked since the start of the year), Fridayโ€™s long red candle with a long lower shadow was a reaction to the weak payrolls figures โ€“ there was a sharp fall from around 163,000โ€“164,000 towards the resistance level, followed by a rebound that saw the week close near 158,500. The current price (158,496) sits right at the lower end of the resistance zone, just below the 159,000 level, suggesting that the market is testing whether the former resistance will now turn into new support.

Whatโ€™s next for the couple?

The balance of risks remains uncertain, but for the time being it may appear to be tilted slightly towards gains as long as tensions surrounding the USโ€“Iran conflict and the Strait of Hormuz persist, which is keeping bond yields higher (10-year US bonds are still around 4.655 per cent). At the same time, the risk of another joint USโ€“Japan intervention is likely to cap gains around the 160 level, whilst a significantly weaker CPI reading could pave the way for a decline to the 155โ€“156 range, where investors have previously been keen to buy on dips. Wednesdayโ€™s CPI reading for July (forecast at 3.4% y/y, down from 3.5% previously) will be a key test for the pairโ€™s future direction, as it will determine whether the market will continue to scale back expectations of a Fed rate rise in September and reverse the trend, or whether the current narrative will prevail.

Currency Hedger No Comments

New Zealand Dollar stalls below 0.5900 as US Dollar regains safe-haven appeal

  • NZD/USD trades around 0.5895 on Monday, virtually unchanged on the day.
  • Middle East tensions support the US Dollar despite signs of weakness in the labor market.
  • The New Zealand central bankโ€™s hawkish stance could limit Kiwi losses ahead of US inflation data.

NZD/USD trades around 0.5895 on Monday at the time of writing, virtually unchanged on the day. The pair consolidates below the 0.5900 level after retreating from its recent monthly high, as the US Dollar (USD) recovers some of the losses registered in the wake of disappointing United States (US) employment data.

The Nonfarm Payrolls (NFP) report released on Friday showed that the US economy unexpectedly lost 23K jobs in July. The previous monthโ€™s figure was also revised sharply lower to just 20K job additions from the 57K initially reported. The data points to a cooling labor market and initially weighed on the US Dollar by weakening the case for monetary tightening from theย Federal Reserveย (Fed).

However, the bearish reaction in the US Dollar fades as geopolitical tensions in the Middle East revive demand for safe-haven assets. Uncertainty surrounding the Strait of Hormuz remains elevated, while fresh attacks by Iran-backed Houthi militants against Saudi energy infrastructure keep concerns over energy supplies alive.

At the same time, higher Oil prices are reviving inflation concerns in the United States (US). Investors fear that energy-driven inflation could force the Fed to keep monetary policy restrictive for longer or even raise interestย ratesย again. Expectations of tighter US monetary policy also help keep US Treasury bond yields elevated, providing additional support to the Greenback.

The international backdrop is also weighing on the New Zealand Dollar (NZD). Data released over the weekend showed that Chinaโ€™s annual Consumer Price Index (CPI) slowed to a six-month low in July, while the Producer Price Index (PPI) eased more sharply than expected. Weaker inflation in China fuels concerns about the worldโ€™s second-largest economy and weighs on antipodean currencies, including the Kiwi.

The downside in NZD/USD remains limited, however, by the hawkish stance of the Reserve Bank of New Zealand (RBNZ). The New Zealand central bank maintains a sufficiently restrictive bias to support the New Zealand Dollar and contain bearish pressure on the pair for now.

Investors now turn their attention to US inflation data dueย this week. The figures could provide fresh clues about the Fedโ€™s interest-rate path as markets weigh a cooling labor market against the risk of renewed energy-driven inflation. Developments in the Middle East are also likely to remain an important driver of the US Dollar and, consequently, NZD/USD.

Chart Analysis NZD/USD

NZD/USD technical analysis

In the one-hour chart, NZD/USD trades at 0.5895, holding a modest bullish bias as it consolidates above the 100-period simple moving average (SMA) near 0.5879 and the 200-period SMA around 0.5863. The pair is grinding higher toward the horizontal resistance at 0.5909, while the Relative Strength Index (RSI) around 61 suggests firm but not overextended upside momentum, keeping buyers in control as long as price stays above the underlying moving average floor.

On the downside, immediate support is seen at the 100-period SMA around 0.5879, ahead of the 200-period SMA near 0.5863 and the horizontal level at 0.5860, which together define a broader demand band protecting the recent recovery. On the topside, a break above resistance at 0.5909 would open the door for a continuation of the advance, whereas repeated failure there would risk a pullback back toward the clustered supports below.

Currency Hedger No Comments

USD/CHF Price Forecast: Struggles below 0.8100 as bears eye 50-SMA pivotal support

  • USD/CHF trades with a negative bias for the second straight day, though it lacks bearish conviction.
  • The disappointing US NFP tempered Fed-hike bets, undermining the USD and weighing on the pair.
  • The technical setup seems tilted in favor of bearish traders and backs the case for a further decline.

The USD/CHF pair struggles to attract any meaningful buyers and remains on the back foot below the 0.8100 mark through the first half of the European session on Monday.

Friday’s disappointing US Nonfarm Payrolls (NFP) further tempered bets of an immediate interest rate hike by the US Federal Reserve (Fed), which, in turn, is seen undermining the US Dollar (USD) and capping the USD/CHF pair. Investors, however, are still pricing in the possibility that the US central bank will raise borrowing costs by the end of this year amid inflation risks stemming from energy supply disruptions.

Apart from this, persistent geopolitical uncertainties might hold back traders from placing aggressive bearish bets on the safe-haven USD and contribute to limiting losses for the USD/CHF pair. The market focus now shifts to the release of the US inflation figures, due this week. The crucial data will be looked for fresh cues about the Fed’s future policy path, which, in turn, will play a key role in influencing the USD demand.

From a technical perspective, the USD/CHF pair is holding below the 23.6% Fibonacci retracement level of the May-July rally, albeit bears await a break below the 50-day Simple Moving Average (SMA) before placing fresh bets. Meanwhile, the Relative Strength Index (RSI) hovers just below the 50 line and the Moving Average Convergence Divergence (MACD) remains slightly negative, suggesting upside momentum is tentative.

Hence, a break below the 50-day SMA will be seen as a key trigger for USD/CHF bears and pave the way for a decline to a dense Fibo. support band between the 38.2% retracement at 0.8037 and the 61.8% level at 0.7932 ahead of structural floors at 0.7857 and 0.7761. On the topside, initial resistance comes at the 23.6% Fibo. retracement at 0.8103, and a break above this barrier would expose the next upside objective at the cycle high zone around 0.8208.

USD/CHF daily chart

Chart Analysis USD/CHF
Currency Hedger No Comments

Euroย holds gains near seven-week highs as economic sentiment improves

  • EUR/USD holds gains at 1.1560, consolidating near seven-week highs.
  • Eurozone Sentix Investors Sentiment Index rose to a six-month high in August.
  • The US Dollar remains depressed as Fed tightening hopes ebb.

The Euro (EUR) ticks higher against a softer US Dollar (USD) on Monday, with the EUR/USD pair trading at the 1.1560 area at the time of writing, consolidating gains a few pips below seven-week highs at 1.1773. Fading hopes that the US Federal Reserve (Fed) will hike interest rates in September are hurting the Greenback, while, in Europe, bright investors’ confidence figures have provided additional support to the Euro.

Data released by the Sentix research institute on Monday revealed that investors’ confidence in the Eurozone economy improved sharply in August, reaching positive levels, with a 0.9 reading, for the first time since February. These numbers confirm a steady recovery, from -.3.1 in July and -13.4 in June.

The greatest improvement has been seen at the current economic conditions sub-Index, which rose by 6.8 points, while the economic expectations improved by a more moderate 1.0. The expectations about the German economy rose by 2.5 points to 6.0, also the highest level since February, while the Global Aggregate rose by 1.4 points, to 14.7, suggesting that economic recovery expectations are broad-based.

The Euro is drawing some support from a weaker US Dollar, as the negative surprise posted by the US Nonfarm Payrolls data has dampened hopes of immediate Federal Reserve (Fed) rate hikes further. This is offsetting concerns about the economic consequences of higher Oil prices for now, as the status of the Strait of Hormuz remains highly uncertain with sea traffic through the key waterway practically blocked.

US CPI data will be the highlight of the week

The US calendar is thin on Monday, and the focus is on the US Consumer Price Index (CPI) figures for July, due next Wednesday, for a better assessment of the Fed’s near-term rate path. The market consensus points to a mild slowdown of consumer prices to a 3.4% year-on-year rate, from 3.5% in June. The Core CPI is also expected to have eased, to a 2.5% yearly growth, from 2.6% in the previous month.

Analysts at ING see the EUR/USD “firmly dominated by the USD side of the equation,โ€ with upcoming US inflation data set to play a pivotal role. In their view, โ€œa softer US CPI print would increase the chances of a break above 1.160 already this week,โ€ with the โ€œnext important resistance beyond thatโ€ identified as โ€œthe 200-day moving average at 1.1630.โ€