

The offshore yuan traded around 6.76 per dollar on Tuesday, reaching its strongest level in a month, supported by firmer official guidance from the People’s Bank of China. The central bank set the daily midpoint rate at 6.7917 per dollar, 31 pips stronger than the previous fixing of 6.7948. The latest move signaled continued support for the currency, even as geopolitical tensions in the Middle East boosted demand for the US dollar as a safe-haven asset. Providing additional support, the State Council emphasized accelerating policy implementation and improving the efficiency of fiscal spending, underscoring its commitment to bolstering growth after Q2 GDP slowed to 4.3%, the weakest pace in more than three years and well below Beijing’s annual target range of 4.5% to 5%. Investor focus is now turning to the Communist Party of China’s upcoming Politburo meeting later this month for signals on the economic policy agenda for the second half of the year.

Japanese Yen consolidates against US Dollar amid uncertainty over future of Middle East
- The Japanese Yen trades calmly around 162.50 against the US Dollar amid uncertainty over the future of the Middle East.
- US President Trump will either accept a 10-day ceasefire or call for a joint full-scale military campaign against Iran.
- Investors await the Japan National CPI data for June.
The Japanese Yen (JPY) trades flat against the US Dollar (USD) at around 162.50 during the Asian trading session on Tuesday, closer to its multi-decade high of 162.84. The USD/JPY pair will likely remain sideways as investors seek fresh cues regarding whether the United States (US) and Iran will announce a ceasefire or will continue exchanging attacks.
In the Asian trade, the US Dollar Index (DXY), which gauges the Greenback’s value against six major currencies, trades flat around 101.00.
According to a report from Axios, US President Donald Trump will either accept the 10-day ceasefire with Iran and resume negotiations towards an interim deal or call for a joint full-scale military campaign with Israel against Iran.
On Monday, a senior Iranian official confirmed receiving a proposal for a 10-day ceasefire from mediators to resume talks on an interim deal.
On the domestic front, investors await Japan’s National Consumer Price Index (CPI) data for June, which will be released on Friday. Investors will pay close attention to the inflation data to get cues regarding the Bank of Japan’s (BoJ) monetary policy outlook. The National CPI ex. Fresh Food is expected to arrive at 1.6% Year-on-Year (YoY), higher than 1.4% in May.
Meanwhile, the next key trigger for the US Dollar will be the preliminary S&P Global PMI data for July, which will be released on Thursday.

EUR/USD Price Forecast: Bears retain control below 200-SMA on H4; break of 1.1400 awaited
- EUR/USD struggles to gain any meaningful traction as traders keenly await the crucial ECB meeting.
- Reviving inflation fears bolster Fed hike bets and underpin the USD, capping the upside for the pair.
- Last week’s failure near the 200- SMA on H4 favors bears and backs the case for further depreciation.
The EUR/USD pair is seen consolidating during the Asian session on Tuesday and trading just above the 1.1400 mark, or a four-day low touched the previous day. Market participants seem hesitant and keenly await the highly-anticipated European Central Bank (ECB) meeting on Thursday before positioning for the next leg of a directional move.
In the meantime, energy-driven inflation fears bolster US Federal Reserve (Fed) rate hike bets and support the US Dollar (USD) amid escalating US-Iran tensions. This could act as a headwind for the EUR/USD pair, warranting caution before confirming that the recent pullback from a four-week high, touched last Wednesday, has run its course.
Spot prices keep a bearish tone following last week’s failure near the 1.1480-1.1485 region, which coincides with the 200-period Simple Moving Average (SMA). Moreover, the Moving Average Convergence Divergence (MACD) indicator remains below zero with a negative reading, while the Relative Strength Index (RSI) at 40.95 stays under the midline.
Momentum indicators together suggest waning bullish momentum and reinforce the downside bias while the EUR/USD pair remains capped beneath the 200-period SMA. This, in turn, backs the case for an eventual break below the 1.1400 round figure and a further decline towards retesting the year-to-date low, around the 1.1325 region, touched on June 24.
On the topside, initial resistance is located at the 200-period SMA around 1.1480. A sustained move above this level is needed to ease the current bearish pressure and open the way for a more constructive outlook. Nevertheless, the sub-50 RSI and negative MACD suggest that the path of least resistance for the EUR/USD pair remains to the downside.
EUR/USD 4-hour chart

USD/CAD Price Forecast: Intraday positive move stalls ahead of 1.4100 confluence hurdle
- USD/CAD builds on the previous day’s solid recovery from an over one-month trough.
- The fundamental backdrop favors bullish traders and backs the case for further gains.
- A move beyond the 1.4100 confluence is needed to reaffirm the constructive setup.
The USD/CAD pair attracts buyers for the second straight day on Tuesday and recovers further from its lowest level since June 17, around the 1.4000 psychological mark touched the previous day. Spot prices advanced to a one-week high during the Asian session, though the intraday move up stalls ahead of the 1.4100 mark amid mixed fundamental cues.
The soft Canadian consumer inflation figures on Monday reaffirmed bets that the Bank of Canada (BoC) will keep interest rates unchanged through the remainder of 2026. This marks a significant divergence in comparison to expectations that the US Federal Reserve (Fed) will raise borrowing costs at least once in 2026 amid concerns about energy-driven inflation. Apart from this, US President Donald Trump’s new tariff of 50% on Canadian products undermines the Canadian Dollar (CAD) and acts as a tailwind for the USD/CAD pair.
Meanwhile, hawkish Fed expectations and an escalation of tensions between the US and Iran continue to act as a tailwind for the safe-haven US Dollar (USD). This is seen as another factor supporting the currency pair. That said, elevated oil prices, bolstered by the closure of the Strait of Hormuz, hold back traders from placing aggressive bearish bets on the commodity-linked Loonie and cap gains for the USD/CAD pair. Nevertheless, the broader fundamental backdrop suggests that the path of least resistance for spot prices is to the upside.
From a technical perspective, the overnight breakout through the 23.6% Fibonacci retracement level of the recent pullback from the highest level since April 2025 favors bullish traders. Furthermore, the Moving Average Convergence Divergence (MACD) is turning positive, and the Relative Strength Index (RSI) is hovering around 56. Momentum indicators together hint at recovering upside pressure. That said, it will still be prudent to wait for a move beyond the 1.4100 confluence before positioning for any further near-term appreciation.
The said handle comprises the 38.2% Fibo. level and the 200-period Simple Moving Average (SMA) on the 4-hour chart, above which the USD/CAD pair could climb to the 50.0% retracement at 1.4126 and the 61.8% level at 1.4155. On the downside, support emerges at the 23.6% retracement near 1.4059, with a more substantial structural floor at the Fibonacci anchor around 1.4000, where a deeper pullback could pause if selling pressure resumes.
USD/CAD 4-hour chart
Canadian Dollar Price This week
The table below shows the percentage change of Canadian Dollar (CAD) against listed major currencies this week. Canadian Dollar was the strongest against the Swiss Franc.
| USD | EUR | GBP | JPY | CAD | AUD | NZD | CHF | |
|---|---|---|---|---|---|---|---|---|
| USD | 0.09% | 0.09% | 0.10% | 0.40% | -0.59% | -0.50% | 0.21% | |
| EUR | -0.09% | 0.01% | -0.06% | 0.31% | -0.67% | -0.60% | 0.11% | |
| GBP | -0.09% | -0.01% | -0.07% | 0.30% | -0.65% | -0.61% | 0.15% | |
| JPY | -0.10% | 0.06% | 0.07% | 0.39% | -0.64% | -0.65% | 0.22% | |
| CAD | -0.40% | -0.31% | -0.30% | -0.39% | -0.94% | -1.03% | -0.15% | |
| AUD | 0.59% | 0.67% | 0.65% | 0.64% | 0.94% | 0.07% | 0.84% | |
| NZD | 0.50% | 0.60% | 0.61% | 0.65% | 1.03% | -0.07% | 0.76% | |
| CHF | -0.21% | -0.11% | -0.15% | -0.22% | 0.15% | -0.84% | -0.76% |
The heat map shows percentage changes of major currencies against each other. The base currency is picked from the left column, while the quote currency is picked from the top row. For example, if you pick the Canadian Dollar from the left column and move along the horizontal line to the US Dollar, the percentage change displayed in the box will represent CAD (base)/USD (quote).

British Pound struggles as traders evaluate BoE policy, UK political developments
- GBP/USD could further depreciate amid differing inflation trends and rate expectations between the BoE and Fed.
- Markets are monitoring fiscal strategy and cabinet choices under new Prime Minister Andy Burnham.
- Upcoming UK labor, inflation, and retail data will dictate near-term Sterling volatility and direction.
GBP/USD steadies after three days of losses, trading around 1.3430 during the Asian hours on Tuesday. After recently surging toward two-month highs near 1.3550, the pair has moderated as foreign exchange traders evaluate shifting monetary policies between the Bank of England (BoE) and the US Federal Reserve (Fed) alongside political developments in the United Kingdom (UK).
From a macroeconomic perspective, central bank policy divergence remains the central pillar steering the exchange rate. While market participants anticipate eventual rate adjustments on both sides of the Atlantic, subtle differences in inflation stickiness and labor market strength determine relative yield appeal.
Domestic economic conditions in the UK are facing scrutiny as upcoming labor, inflation, and retail sales data will clarify whether the Bank of England can afford to hold monetary policy restrictive or if easing must accelerate. However, persistently high oil prices kept inflation fears alive, strengthening expectations that the UK central bank will hold interest rates elevated for longer.
As markets gauge the monetary policy trajectory, investors are also processing a leadership shift in Westminster following Andy Burnham’s elevation to Prime Minister. Taking the helm as Britain’s seventh Prime Minister in a decade, and second for Labour since 2024. He reaffirmed fiscal discipline while hinting at relief for taxpayers through a potential raise in the personal allowance. Attention now turns to his Treasury appointment, where reports point to Shabana Mahmood as a frontrunner for chancellor.”
Until clearer economic signals emerge from both central banks and upcoming growth figures, the GBP/USD pair is likely to oscillate, anchored by shifting interest rate expectations and broader global risk appetites.
In the US, economic indicators continue to present a mixed backdrop for the US Dollar (USD). Softening inflation trends have kept Federal Reserve rate cuts on the radar, preventing sharp Greenback rallies and offering baseline support for the British Pound (GBP). However, lingering geopolitical tensions in energy markets and steady global risk sentiment have provided episodic support to the dollar as a safe-haven asset, keeping upside moves in check.

Australian Dollar strengthens above 0.7000 despite rising US-Iran tensions
- AUD/USD gains ground to around 0.7010 in Tuesday’s Asian session.
- The US launches further strikes on Iran.
- The RBA is in a “wait-and-see” mode as it monitors key economic data ahead of its next policy meeting.
The AUD/USD pair drifts higher to near 0.7010 during the Asian trading hours on Tuesday. However, the potential upside for the pair might be limited amid the escalation of the US-Iran conflict. The Australian employment report will take center stage later on Thursday.
The US Central Command (CENTCOM) said on Monday that it completed more strikes against Iran, hours after US President Donald Trump warned that Tehran would pay for the deaths of three American soldiers over the past few days, per CNN.
Iranian state media reported explosions across southern Iran, including on Qeshm Island and in Bandar Abbas, Sirik, Chabahar, Isfahan and Konarak. Kuwait also said that its air defences were activated against Iranian missile and drone attacks. Ongoing tensions in the Middle East could weigh on riskier assets such as the Australian Dollar (AUD) against the US Dollar (USD) in the near term.
After delivering three consecutive 25 basis points (bps) hikes earlier this year, the Reserve Bank of Australia (RBA) decided to leave the Official Cash Rate (OCR) unchanged at 4.35% at its June policy meeting. The Australian central bank is currently in a “wait-and-see” mode to evaluate how its tightening cycle is impacting sticky core inflation and a cooling domestic economy.
The ASX 30-Day Interbank Cash Rate Futures implied a 16% chance of an RBA rate hike in August, with a roughly 50% to 60% possibility of one more hike by December 2026.

Swiss Franc weakens as safe-haven demand lifts US Dollar
- USD/CHF as safe-haven dollar demand grew amid US-Iran tensions.
- The CME FedWatch Tool shows September Fed rate hike odds rose to 64.2%, up from 57.8% a day earlier.
- Rising geopolitical risks pushed the SNB to reiterate FX interventions to curb a surging franc and safeguard price stability.
USD/CHF extends its gains for the second successive day, trading around 0.8110 during the Asian hours on Tuesday. The pair appreciates as the US Dollar (USD) receives support from rising safe-haven demand amid ongoing hostilities between the United States (US) and Iran, which drove oil prices higher, reviving concerns about inflation and interest rate hikes.
CME FedWatch Tool suggests that markets price in 64.2% odds of a September Fed rate hike, compared to 57.8% a day earlier. In the meantime, Federal Reserve officials have entered their traditional blackout period ahead of next week’s FOMC meeting, where policymakers are widely anticipated to hold the federal funds rate steady.
US attacks on Iran continued for a tenth straight day. The ongoing campaign has coincided with continued retaliatory strikes from Tehran against neighboring countries, further escalating instability across the region.
Although the Swiss National Bank (SNB) maintains a stable medium-term inflation outlook, recent meeting minutes reveal growing caution among policymakers. Escalating geopolitical tensions have increased short-term inflation risks, leading the SNB to reaffirm its readiness to intervene in foreign exchange markets to curb excessive franc appreciation and safeguard price stability. Investors now turn their attention to June’s Trade Balance data, scheduled for release later in the day.

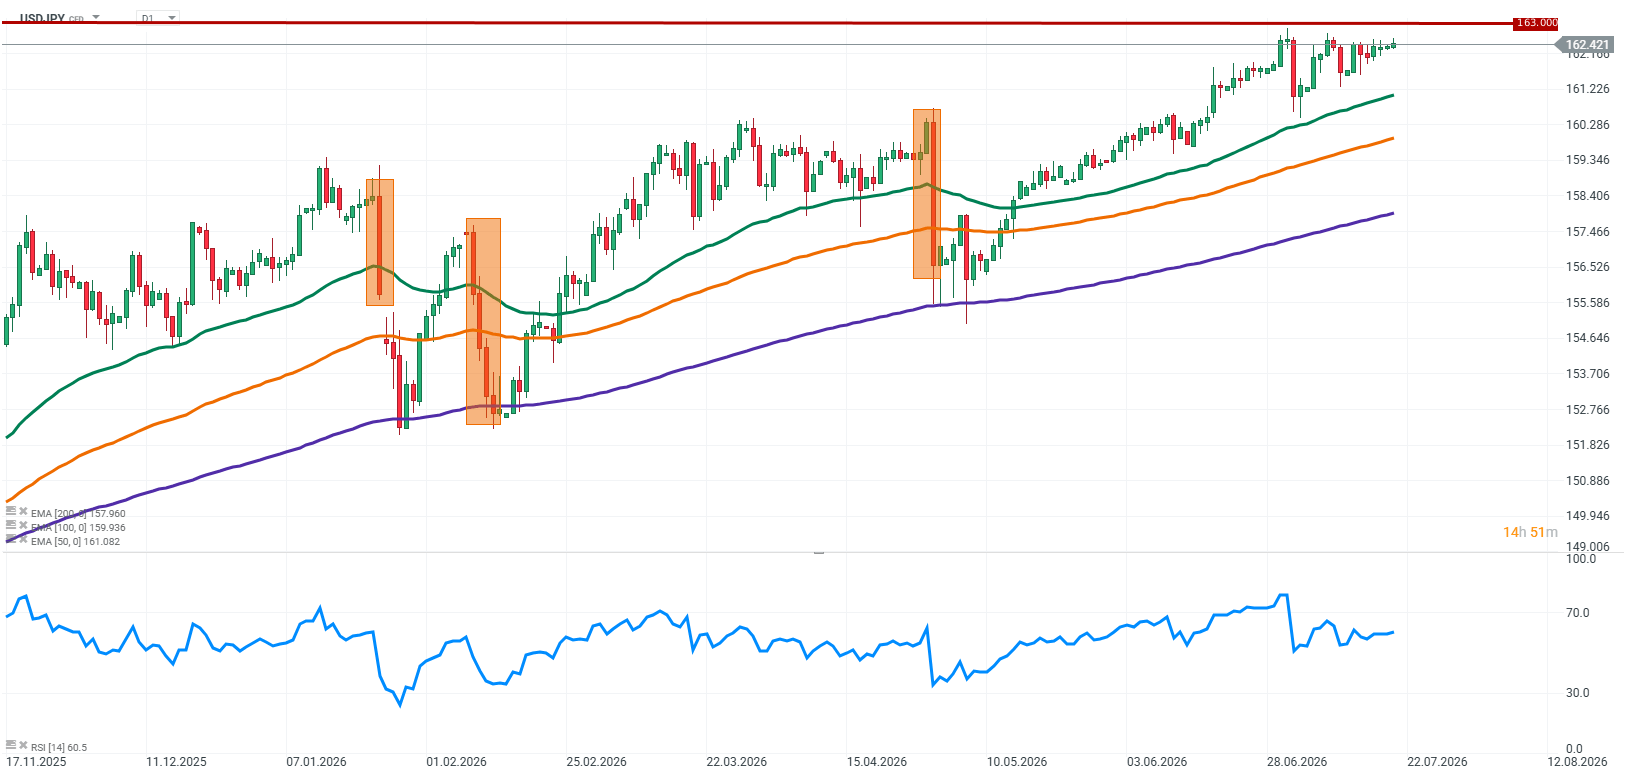
Chart of the Day: USDJPY – The Dollar Wins Another Round, but Tokyo Is Preparing a Response
The USDJPY market currently resembles another round of a fight between two heavyweight contenders. On one side stands the dollar, supported by high US asset yields and the ongoing advantage in interest rates. On the other side stands the yen, which despite the Bank of Japan beginning the process of monetary policy normalization, remains under pressure. Japan has taken the first step away from its ultra-loose monetary policy, but the gap between interest rate levels in the United States and Japan remains extremely wide. This difference continues to be the main argument supporting the dollar. At the same time, USDJPY is trading at levels that are attracting increased attention from speculators and Japanese authorities.
Today’s holiday in Japan means lower market liquidity, and such conditions often increase the risk of sharp price movements. Tokyo has been signaling for months that it will not tolerate excessive yen volatility, meaning markets must continue to account for the possibility of direct intervention. USDJPY currently resembles a fight in which the dollar continues to score points thanks to its fundamental advantage, but every additional move higher increases the risk of a response from Japan.
Source: xStation5
The key factors currently shaping USDJPY 1. Japan and the risk of currency intervention
The most important psychological factor for the USDJPY market remains the possibility of direct action from Japanese authorities. Japan’s Ministry of Finance has been monitoring developments in the currency market for months and has repeatedly emphasized that excessive yen volatility may require action. The issue is not only the absolute level of USDJPY, but above all the speed of the move. History shows that Japan has typically reacted when yen weakness became too rapid and started affecting expectations among businesses and households. Tokyo understands that an excessively weak currency increases the cost of imported energy and raw materials, making the fight against inflation more difficult. Today’s holiday in Japan adds another layer of attention to the market. With liquidity reduced, even smaller capital flows can generate larger moves in exchange rates. For authorities, such conditions could create a situation where a potential intervention would have a stronger psychological impact. At the same time, Japan needs to remain patient. Using foreign currency reserves too quickly could produce only a short-term effect if fundamentals continue to favor the dollar. Tokyo needs the right moment, when the market is most vulnerable to a change in direction.
2. Interest rate differentials remain the main argument supporting the dollar
The most important fundamental factor for USDJPY remains the difference between monetary policy in the United States and Japan. The Bank of Japan has started raising interest rates, but the path toward a more restrictive policy will likely remain very gradual. The Federal Reserve, meanwhile, continues to maintain rates at elevated levels, while investors continue to assess when and how quickly the Fed may begin a rate-cutting cycle. For the currency market, the key factors are not only current interest rate levels but also bond yields and expectations regarding future monetary policy. If the Fed maintains a cautious approach and continues limiting expectations for rapid policy easing, the dollar may remain supported. Even with lower inflation in the United States, dollar strength can persist as long as real interest rates remain attractive for investors. Japan faces a different challenge. The Bank of Japan must balance the need to normalize monetary policy with the risk of weakening economic growth. Moving too quickly with rate increases could hurt the economy, which is why the tightening process remains cautious.
3. Middle East tensions and oil prices increase pressure on the yen
Another factor influencing USDJPY remains the geopolitical situation in the Middle East. The intensifying conflict in the Persian Gulf has increased the importance of the oil market and the risk of disruptions to energy supplies. Rising oil prices can affect currencies through several channels. The first channel is inflation. Higher energy costs make further declines in price pressures more difficult and may limit the room available for central banks to ease monetary policy. The second channel is related to security. During periods of heightened uncertainty, investors often move capital toward the dollar as the world’s primary reserve currency. This provides additional support for the US currency during periods of increased risk. The situation is particularly challenging for Japan, as the country remains a major energy importer. Higher oil prices can worsen the trade balance and increase costs throughout the economy. As a result, geopolitical developments may currently work against the yen, despite the fact that the Japanese currency has historically benefited during periods of elevated risk aversion.
USDJPY: The Dollar Still Leads, but Japan Remains in the Fight
The current situation in USDJPY is the result of several overlapping factors that are pushing the market in different directions. The dollar continues to benefit from the interest rate advantage and high US Treasury yields. Despite softer inflation data, the Federal Reserve remains cautious about starting a rapid easing cycle, which limits pressure on the US currency. Japan, meanwhile, remains in a difficult position. The Bank of Japan has started changing the direction of monetary policy, but the pace of normalization remains slow. At the same time, every additional decline in the yen increases pressure on the Ministry of Finance, which must consider the economic costs of an excessively weak currency. From a technical perspective, the pair remains in an uptrend and continues to trade within an ascending channel. The RSI indicator remains in positive territory but has not yet reached extreme overbought levels, suggesting that buying pressure remains present. The key question for the market is whether the dollar’s fundamental advantage will be strong enough to overcome the growing risk of Japanese intervention.
Key Takeaways
- USDJPY remains one of the most important currency pairs due to the combination of strong fundamentals and the possibility of political action from Japan.
- The interest rate differential between the US and Japan remains the main argument supporting the dollar.
- The Bank of Japan has started the process of monetary policy normalization, but the pace of change remains significantly slower than in the United States.
- Today’s holiday in Japan increases market attention toward the possibility of intervention during a period of reduced liquidity.
- Middle East tensions and rising oil prices may add further pressure on the yen through the energy channel while increasing demand for the dollar as a safe-haven currency.
- Technically, USDJPY remains in an uptrend, but levels near historical highs increase the risk of a sharp market reaction.
- USDJPY is currently at a very interesting point. The dollar continues to score points thanks to its fundamental advantage, but every additional move higher increases the importance of Japan as a contender capable of changing the course of the entire fight at the right moment.
