Facts
- On Thursday (June 11), the ECB will announce its interest rate decision. Markets have almost fully priced in a rate hike.
- Nearly two additional rate hikes are priced in for the remaining months of the year (the second one at approx. 73%).
- On Wednesday (June 10), May CPI inflation data for the United States will be released.
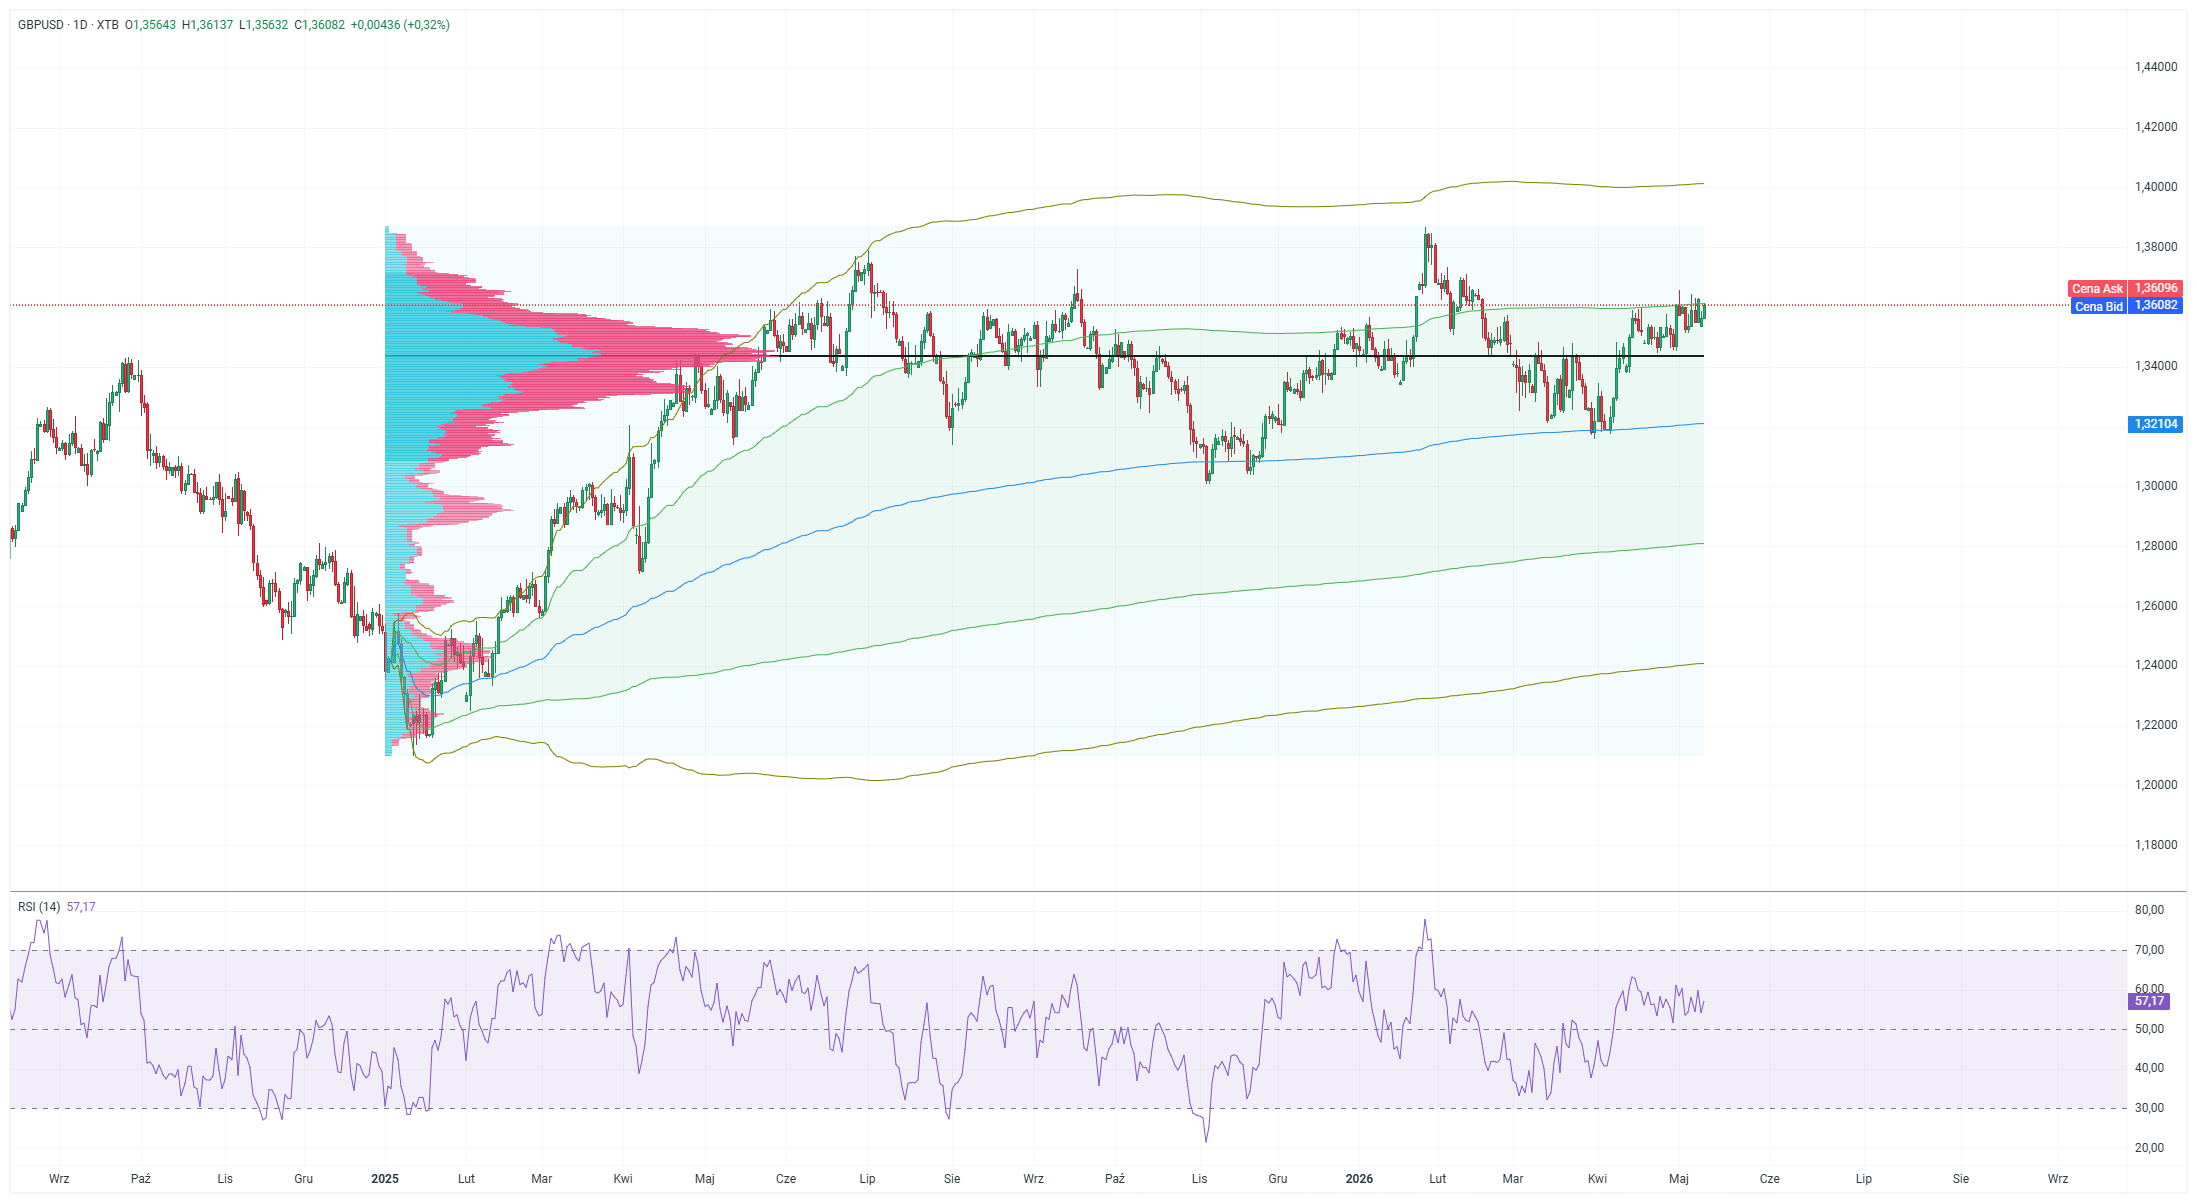
- The EURUSD pair is oscillating around 1.15500, between two key support levels determined by the 61.8% and 78.6% Fibonacci retracements.
- The price is trading significantly below its three major moving averages: EMA 50 (1.16568), EMA 100 (1.16608), and EMA 150 (1.16464).
- The RSI (14) indicator stands at 39.1.
Recommendation
- Position: Short (SELL) on EURUSD at market price (1.15502).
- Take Profit (TP): 1.14700 (TP1), 1.14200 (TP2)
- Stop Loss (SL): 1.16300
Figure 1: EURUSD (10.12.2025 – 25.06.2026)
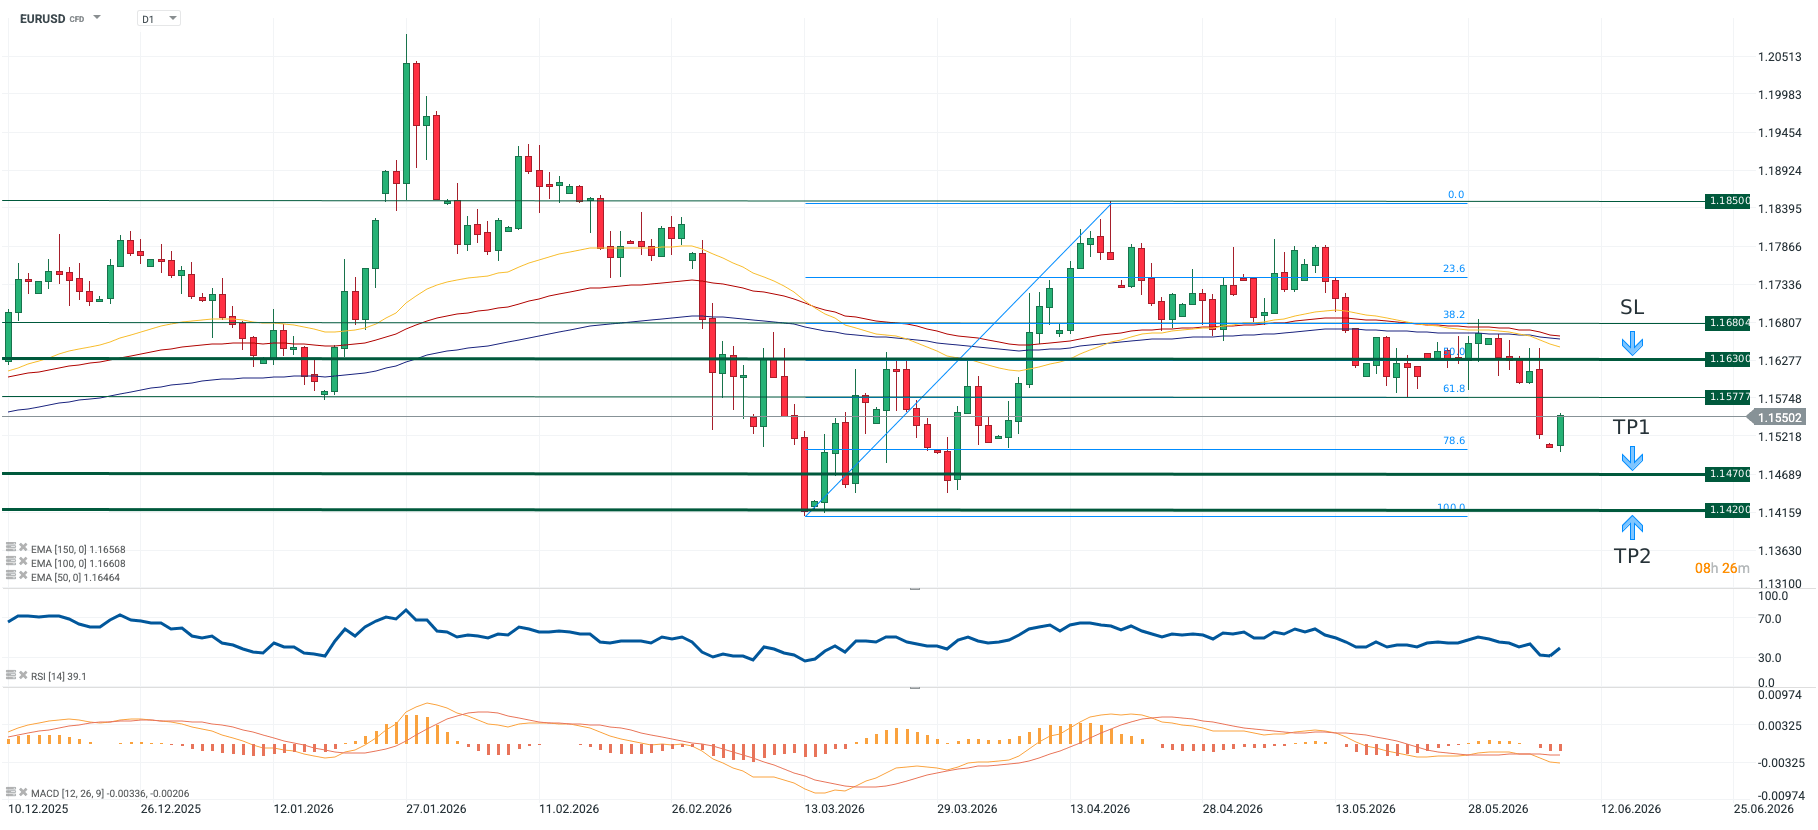
Source: xStation5, 08.06.2026 (15:34)
Opinion
The EURUSD pair has weakened significantly from its mid-April peak, when it approached the 1.18500 level. The key drivers behind this downward move are the prolonged negotiations between the US and Iran, alongside a substantial increase in market expectations for US interest rate hikes. Markets have now fully priced in a rate increase before the end of the year, following Friday’s release of very strong NFP (Non-Farm Payrolls) data from the US labor market. Figure 2: Change in Non-Farm Payrolls (NFP) and Unemployment Rate in the US (2023 – 2026)
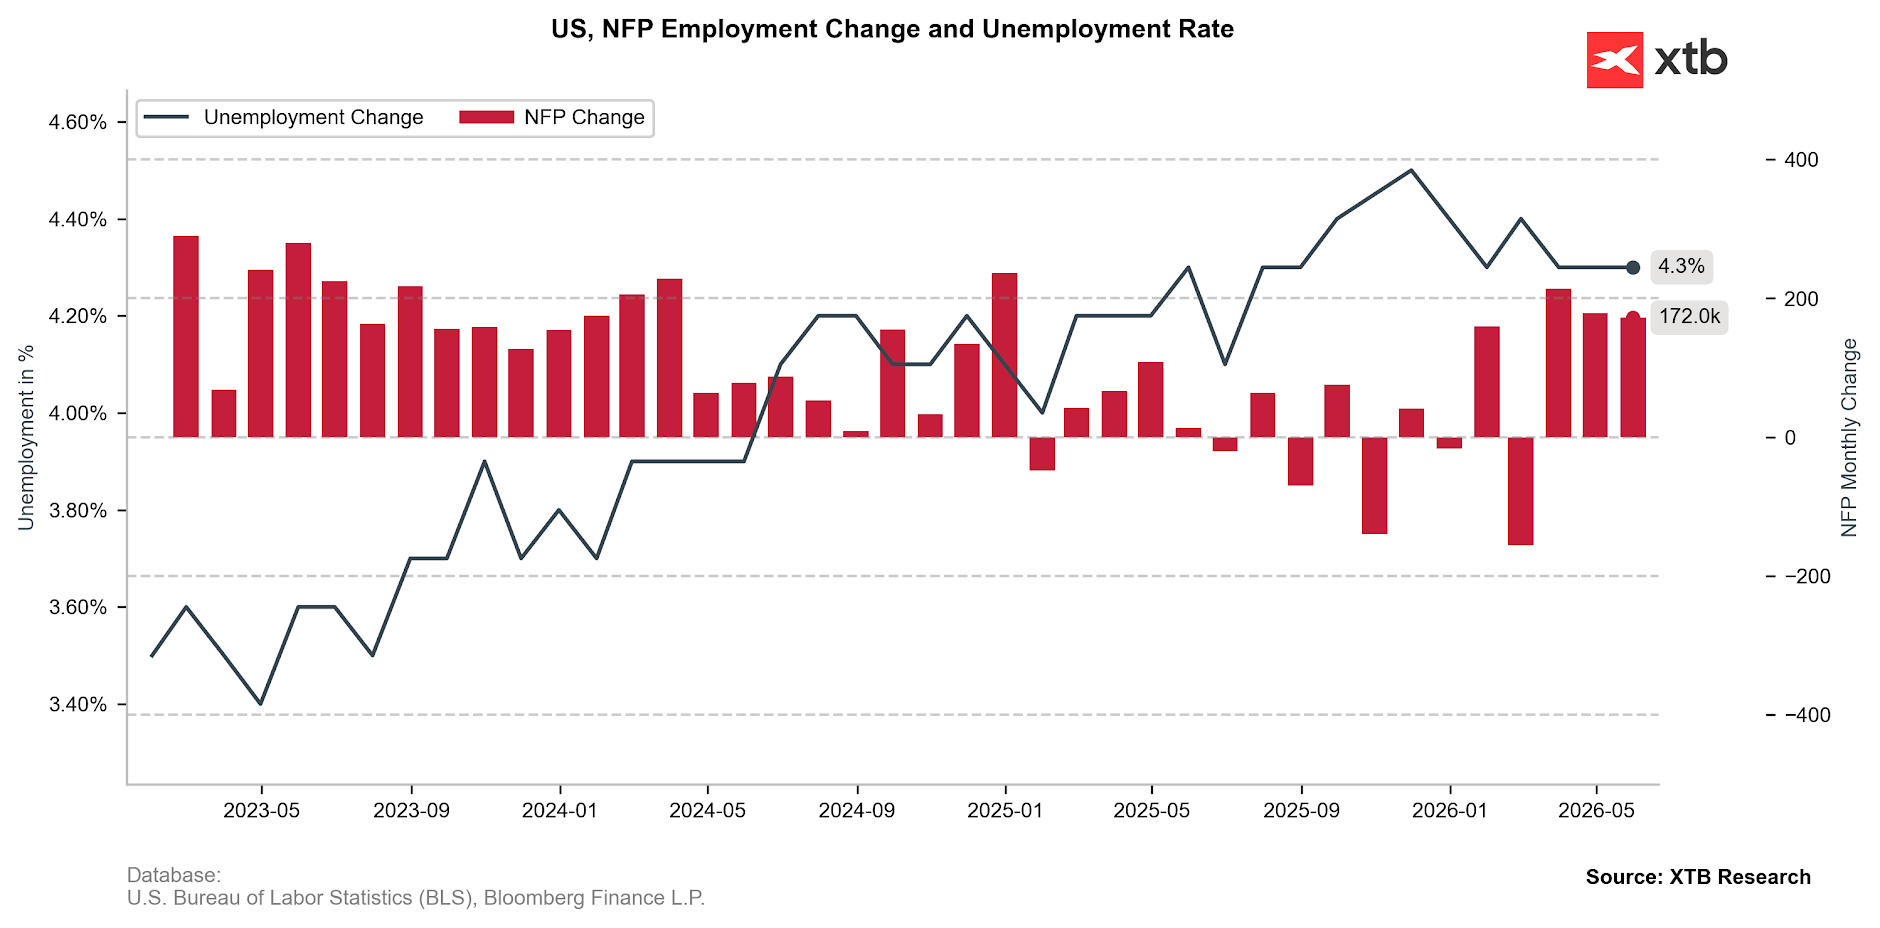
Source: XTB Research, 08.06.2026
Geopolitics and monetary policy should remain the primary focus for investors this week as well. Any headlines suggesting that a breakthrough in reopening the Strait of Hormuz is slipping away could weigh on the EURUSD pair, a dynamic already observed during this morning’s trading session. Paradoxically, the Euro’s decline could also be fueled by Thursday’s anticipated interest rate hike from the ECB. Since this move is already nearly 100% priced in by the markets, investor attention will shift away from the decision itself and onto the accompanying rhetoric. Frankly speaking, if the ECB were to hold rates for any reason, it would trigger a massive sell-off in the Euro. However, the single currency could also be weakened by President Christine Lagarde herself, who will take the podium on Thursday afternoon to address and potentially challenge market assumptions regarding the central bank’s upcoming steps.
Lagarde has rarely accustomed us to being overly transparent or hawkish in her communications. Consequently, any signs of her emphasizing economic stagnation risks could be interpreted by markets as dovish – especially if inflation concerns are given a slightly lower priority than they were a month ago. Speaking of inflation, Wednesday’s US CPI print for May is a crucial milestone. Further growth in price pressures is expected. The core gauge, which excludes highly volatile food and energy prices, will be critical, as it will reveal the extent to which the energy shock has filtered into other sectors of the economy. From a technical analysis perspective: The pair has broken below the 61.8% Fibonacci retracement level (1.15777) as well as the EMA 50, 100, and 150 moving averages, justifying further declines. The MACD histogram is systematically deepening its lows in negative territory, and the RSI (14) still has ample room to slide before hitting oversold territory.
Methodology
The recommendation was prepared based on a fundamental analysis of the respective economies (including monetary policy in both the Eurozone and the US), as well as a technical analysis of the EURUSD chart. The direction of the recommendation was determined by assessing the monetary policy divergence between the Fed and the ECB, confirmed by the medium-term downward trend on the chart. Take Profit and Stop Loss levels were determined using Fibonacci retracements and key horizontal support/resistance levels (TP1 between Fibo 78.6% and Fibo 100.0%, TP2 directly at the Fibo 100.0% level, and the SL at the Fibo 50.0% level).