H is for hawk The Bank of England will announce its latest policy decision at midday on Thursday. The market is expecting no change in rates from the Bank, and we expect an 8-1 vote split, with one of the noted hawks at the bank voting to increase rates.
The backdrop to this meeting is a deeply uncertain global outlook and the threat of a bigger inflation spike after another surge in the oil price, which has risen to a fresh war-time high on Thursday morning to more than $123 per barrel for Brent, as the blockade in the Strait of Hormuz looks like it will be in place for the long term and as Donald Trump mulls ending the ceasefire with Iran. We expect the BOE to remain as calm and composed as possible considering the backdrop, and to stress the uncertain outlook, however, now that the oil price is rising again and oil supply is likely to remain constrained for the long term, the BOE may find it hard to avoid straying into hawkish territory as it balances growth risks with inflation concerns.
We expect the Bank will stress the need to watch for second round inflation effects, for example wage growth. So far, the survey data does not suggest that firms are likely to raise wages, and the labor market is still soft, even if the unemployment rate fell below 5% in the 3 months to February. The latest DMP survey shows that expectations for wage growth this year are unchanged at 3.5%. The Bank may also address the increase in inflation expectations, which rose by 2.1% in March, according to the latest Citi-YouGov survey. This suggests that consumers are concerned about a 2022-style energy price shock, even if the Bank has been keen to stress that the economic backdrop is different this time.
Assessing the chance of a hawkish shock at the BOE
A hawkish shock would be a larger number of MPC members voting for a rate hike, especially since signals coming from the March data have been resilient so far. If we get a 6-3 split, then this could open the door to a June rate hike. That might sound hasty, however, an early hike could nip in the bud any threat of second round inflation effects, especially if the blockade of the Strait of Hormuz lasts for the long term and the oil price stays in triple figures.
What will the BOE do next
Although we do not expect any forward guidance from the BOE at today’s meeting, the market is convinced that the next move from the BOE is a rate hike. There is roughly an 84% chance of two rate hikes from the BOE this year, and the market expects rates to rise to 4.25% to combat the threat of rising inflation caused by the energy price spike. The market is expecting the BOE to signal that rates will remain higher for longer, and for now, UK inflation is expected to peak at 4% this year.
Fed’s hawkish tilt
Today’s BOE meeting follows Wednesday night’s Fed meeting. The Fed did not change policy, but it is worth noting that its policy decision was the most divided since 1992. On the back of the Fed meeting, traders now see a rate hike as more likely than a rate cut for this year, following the Fed’s hawkish hold on Jerome Powell’s last meeting as chair. There is now an 11% chance of a hike from the Fed this year, up from 5% prior to the meeting. The Fed did not change the language used in its statement at this meeting, which suggests that cuts could still be on the cards for US interest rates. However, Powell suggested that this language could be adapted in future if elevated oil prices persist and three Fed governors opposed the current language used in the statement.
The market reacted to the hawkish tone at the Fed. The Dow Jones slumped 250 points, the dollar ticked higher and US stock index futures are also pointing to losses for the S&P 500 on Thursday. We think that the market reaction to the BOE meeting is likely to be mostly felt in the bond market. UK 2-year yields rose by 8 bps on Wednesday, and yields are higher by 26bps in the past month. The 2-year yield is now trading at 4.55%, so a lot of BOE hawkishness is already priced into UK bonds. We think that the oil price is more important for the direction of UK yields and sentiment towards UK assets more generally. UK stocks have slipped behind their US counterparts in recent weeks, and until there is a rotation out of US tech stocks and into defense names like BAE Systems and Rolls Royce, we could see the UK index may continue to struggle.
Chart 1: FTSE 100 and the S&P 500
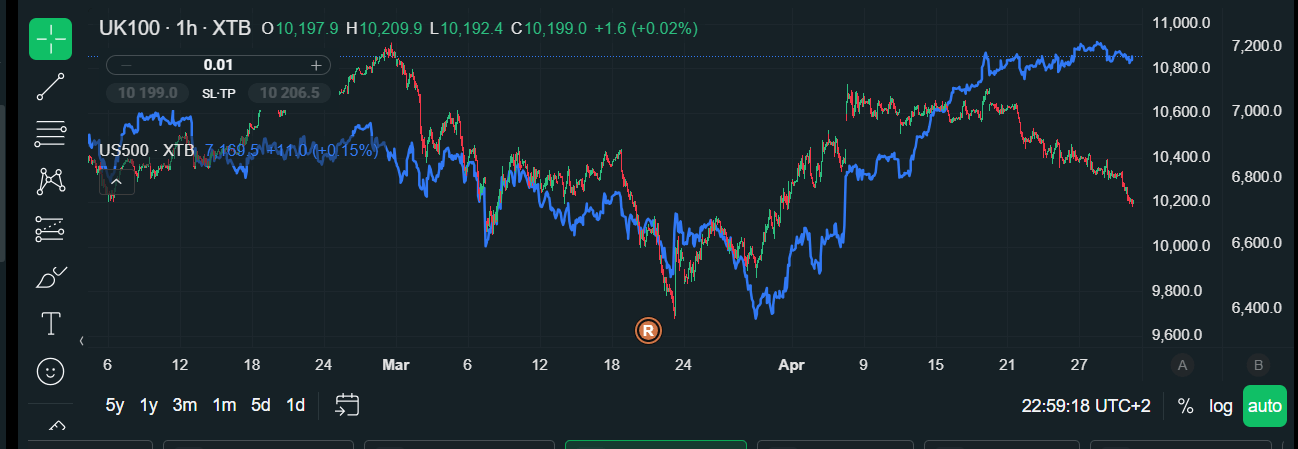
Source: XTB