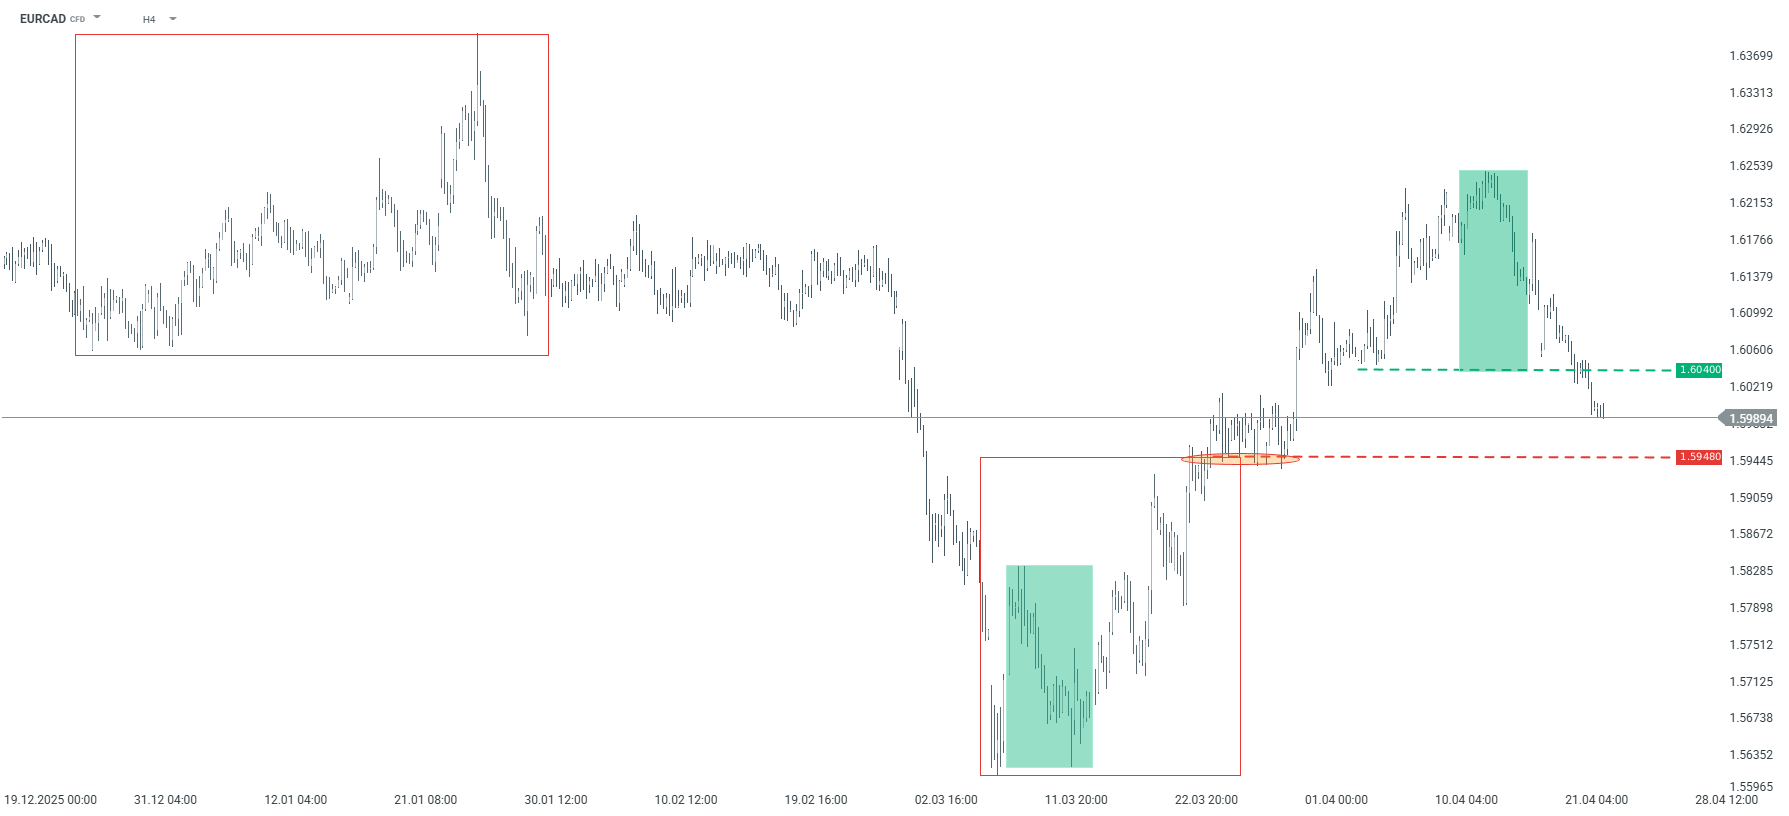
The Overbalance analysis aims to identify three financial instruments, analyzed primarily on the daily/four-hour (D1/H4) timeframe. The analysis uses only the Overbalance methodology, which helps determine where a trend may continue or where it may reverse. Today’s analysis covers three instruments, evaluated solely in terms of 1:1 correction structures EURCAD Since March 10, EURCAD has been trading in an uptrend; however, during yesterday’s session, the local 1:1 bullish pattern was negated at the 1.6040 level. According to the Overbalance methodology, this may support a scenario involving a return to the downtrend. Further confirmation would be a return of the price below the 1.5948 level, i.e., back into the previous downtrend. On the other hand, a break above 1.6040 could restore the bullish scenario.
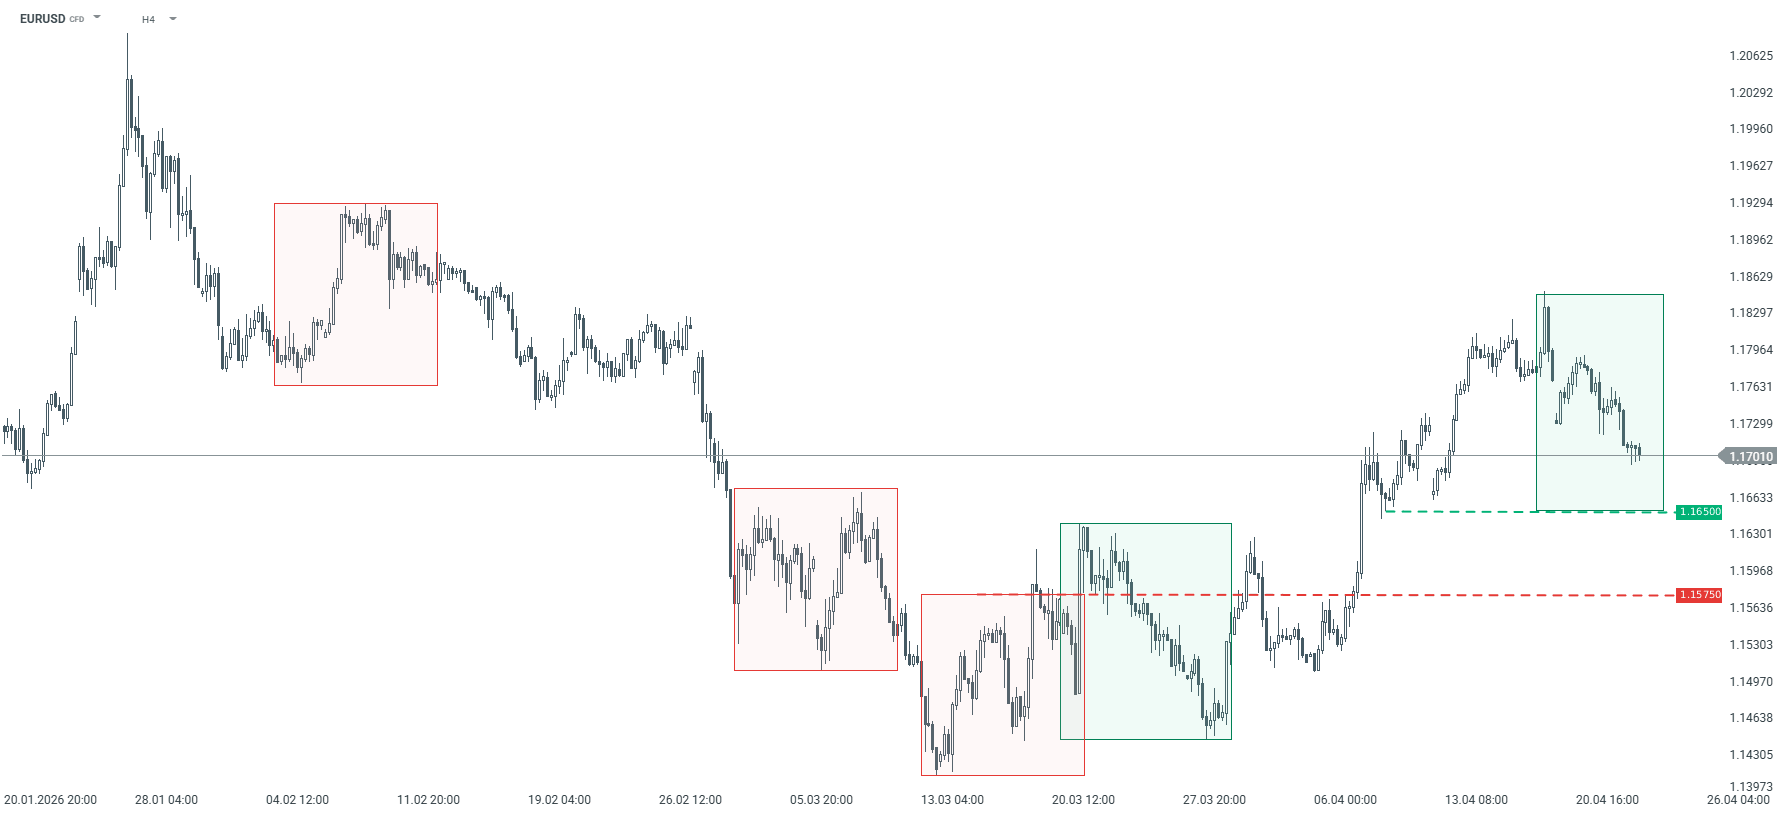
EURCAD – H4 timeframe. Source: xStation EURUSD Since mid-March, the EURUSD has been trending upward, but in recent days we have seen a downward correction. The price is approaching key support at the 1.1650 level, which stems from the lower boundary of the local 1:1 pattern. A potential bounce at this point could lead to the generation of another upward impulse. Conversely, a sustained break below the 1.1650 level would open the way for a return to the downtrend.
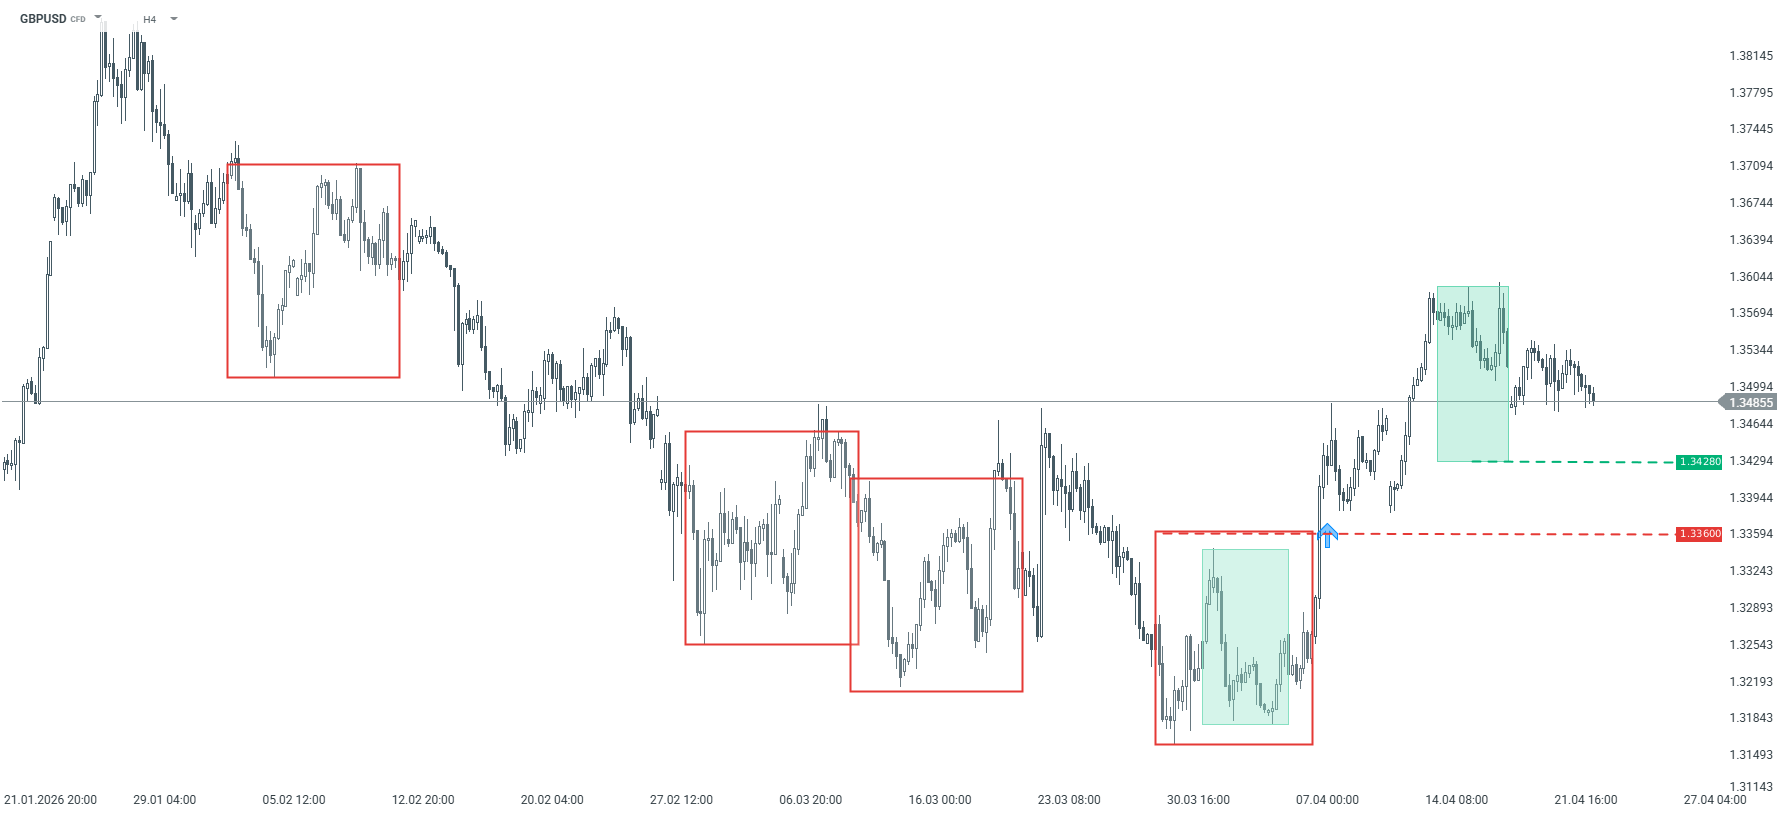
EURUSD – H4 chart. Source: xStation GBPUSD The GBPUSD pair is showing a situation very similar to that of the EURUSD. An uptrend has been in place since late March, but a correction has emerged in recent days. Should this correction deepen, the key support level remains at 1.3428. A break below this level could open the way for declines, which would be confirmed upon a drop below 1.3360—the polarity of the previously negated 1:1 downward geometric pattern.
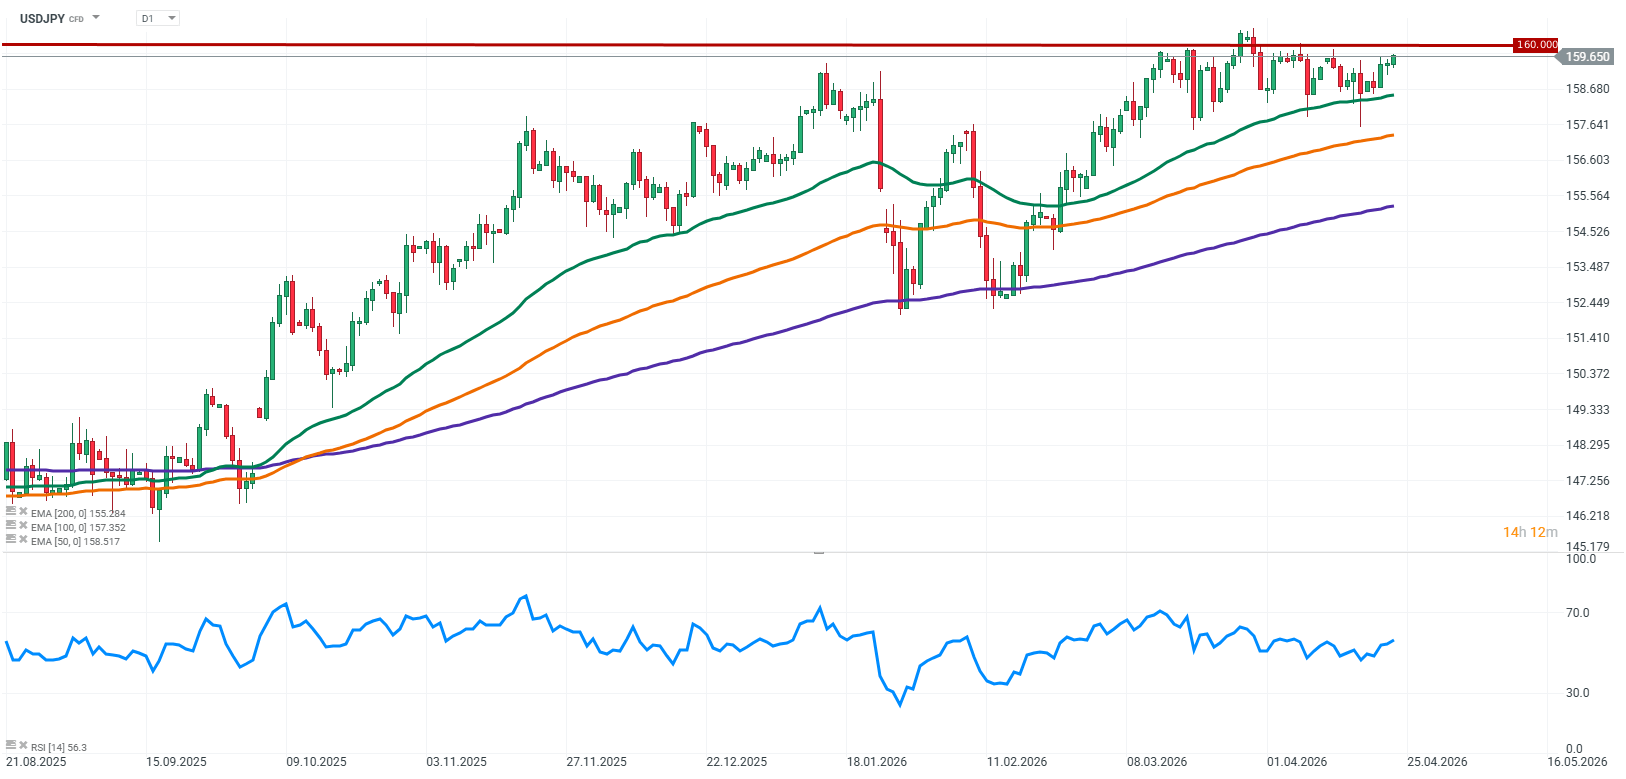
The USDJPY pair continues to trade in a heightened uncertainty environment, where geopolitical factors, macroeconomic data, and growing expectations regarding Bank of Japan policy are all influencing price action at the same time. The market is moving around key technical levels, with particular attention focused on the 160 area, which has been consistently defended and is widely viewed as a significant psychological barrier as well as a potential intervention zone for Japanese authorities. This raises an increasingly important question: whether this level will eventually be broken, and if so, under what conditions and timing. The current dynamics are driven both by global geopolitical tensions and by an intensifying debate over the possible normalization of monetary policy in Japan.
Source: xStation5
What drives USDJPY pricing?Geopolitics and the Strait of Hormuz as a source of global risk aversion
One of the key drivers of market sentiment remains geopolitical tensions in regions critical for global energy transport, such as the Strait of Hormuz. The market reacts very sensitively to any risk of disruptions in oil and gas flows, which leads to higher energy prices and increased volatility. Japan is heavily dependent on energy imports, largely sourced from the Persian Gulf region. As a result, rising oil and gas prices deteriorate Japan’s trade balance and increase imported inflation pressures. Therefore, prolonged tensions in the Hormuz region do not necessarily support the yen. Instead, they tend to weaken it. In this context, geopolitics does not provide a clear directional signal for USDJPY, but rather reinforces upside pressure on the pair while increasing overall volatility.
Japanese macro data and PMI signals
Recently, Japanese PMI data has attracted more attention, showing a gradual improvement in economic activity. While this is not yet a strong upward trend, signs of stabilization in both manufacturing and services increase the likelihood that the Bank of Japan will have more room to continue normalizing monetary policy. For the FX market, this is important because the yen has remained under pressure for years due to ultra-loose monetary conditions. Even small shifts in this area can have a meaningful impact on global capital flows.
Inflation (CPI) as a key BOJ catalyst
One of the most important short-term drivers remains Japanese CPI data, which plays a central role in shaping expectations regarding future Bank of Japan actions. If inflation remains above the 2% target, markets increasingly price in the possibility of further rate hikes or at least a more hawkish communication stance from the central bank. In such a scenario, upward pressure on the yen increases. Conversely, weaker inflation data reinforces expectations that ultra-loose policy will be maintained for longer, which supports further yen weakness against the dollar.
Bank of Japan policy and interest rate differentials
A key medium- and long-term factor remains Bank of Japan policy, which is gradually moving away from its long-standing regime of ultra-low interest rates and yield curve control. Even though this process is slow, its direction is highly significant for markets. USDJPY is particularly sensitive to the interest rate differential between the US and Japan, which has been a major driver of yen weakness through carry trade strategies for years. Any narrowing of this spread could trigger significant capital flows and lead to shifts in the medium-term trend.
The 160 level and intervention risk
The 160 level on USDJPY remains a key reference point, both technically and politically. Historically, levels around this area have been repeatedly highlighted as zones of heightened vigilance by Japanese authorities regarding excessive FX volatility. As a result, markets are increasingly pricing in the risk of intervention by the Japanese Ministry of Finance, which may take the form of either verbal warnings or direct FX market operations. Such interventions typically result in sharp but often short-lived strengthening of the yen.
Key Takeways
USDJPY remains in a high-volatility environment where direction is driven simultaneously by macroeconomic data, geopolitical developments, and central bank policy.
Geopolitical tensions, including the situation in the Strait of Hormuz, increase global risk aversion.
Japanese macro data, particularly PMIs, indicate gradual economic improvement and support the case for further BOJ normalization.
Inflation (CPI) remains a key short-term catalyst for BOJ expectations and the yen’s direction.
BOJ policy is becoming an increasingly important source of volatility, with even small communication shifts capable of moving the market.
The US–Japan interest rate differential remains the core structural driver of USD/JPY, and its potential narrowing could reshape medium-term dynamics.
The 160 level represents a major psychological and political barrier, increasing the risk of intervention or verbal action by Japanese authorities.
The market remains in a phase dominated by expectations and narratives, which supports sharp but often short-lived price moves.
The preliminary German and Eurozone flash HCOB Purchasing Managers’ Index (PMI) data for April is due for release today at 07:30 and 08:00 GMT, respectively.
Amongst the Euro area economies, the German and the composite Eurozone PMI reports hold more relevance, in terms of their impact on the European currency and the related markets as well.
The flash Composite PMI for Germany is expected to have expanded again, but at a moderate pace due to a slowdown in both the manufacturing and the services sectors. The Composite PMI is seen arriving lower at 51.1 from 51.9 in March.
Germany’s Manufacturing PMI is expected to have fallen to 51.3 from the previous reading of 52.2. Meanwhile, the Services PMI is estimated to have dropped to 50.3 from the prior release of 50.9.
The forecast for the Eurozone flash Composite PMI for April also shows that the overall private sector output expanded at a moderate pace. Eurozone’s manufacturing output growth slowed down, and the services sector activity contracted. A figure below the 50.0 threshold is considered a contraction in the economic activity.
According to preliminary estimates, the Eurozone Composite PMI drops to 50.2 from 50.7 in March. The Manufacturing PMI is seen arriving lower at 50.8 from the prior release of 51.6. The Services PMI is expected to have contracted to 49.8 after slowing down to 50.2 in March.
How could German/ Eurozone flash PMIs affect EUR/USD?
EUR/USD is marginally down to near 1.1700 during the early European trade on Thursday. The pair has corrected to near the 20-period exponential moving average (EMA), which is at 1.1691, but sits north of the 38.2% Fibonacci retracement at 1.1666 of the 1.1408–1.2082 swing, suggesting underlying demand on shallow pullbacks.
The Relative Strength Index (RSI) falls into the 40.00-60.00 zone after failing to hold above the 60.00 level, indicating balanced momentum with an upside bias.
On the topside, initial resistance is located at the 50% Fibonacci retracement at 1.1745; a daily close above this barrier would expose the 61.8% retracement at 1.1825, followed by 1.1938 and the cycle high region near 1.2082. On the downside, immediate support is provided by the 20-period EMA at 1.1691, ahead of the 38.2% retracement at 1.1666; a deeper setback would bring the 23.6% level at 1.1567 into view, with more important structural support down at the 1.1408 swing low.
GBP/USD may rebound toward the two-month high of 1.3599.
The 14-day Relative Strength Index near 56 indicates positive momentum without overbought conditions.
The immediate support lies at the nine-day EMA of 1.3493.
GBP/USD remains subdued for the third successive day, trading around 1.3500 during the Asian hours on Thursday. The technical analysis of the daily chart indicates a potential for bearish reversal as the pair moves below the ascending channel pattern.
However, the GBP/USD pair holds a constructive bullish bias as it stays marginally above the nine-period Exponential Moving Average (EMA) and comfortably over the 50-period EMA. This alignment of short- and medium-term EMAs below spot hints at underlying demand. The 14-day Relative Strength Index around 56 suggests positive but not overstretched momentum, allowing room for further upside while the pair remains supported on dips.
The return to the ascending channel would lead the GBP/USD pair to test the initial barrier at the two-month high of 1.3599, recorded on April 17. Further advances would support the pair to test the upper boundary of the ascending channel around 1.3810. A break above the channel would reinforce the bullish bias and support the GBP/USD pair to approach the 1.3869, the highest level since September 2021, reached on January 27.
On the downside, the GBP/USD pair is testing the immediate support at the nine-day EMA of 1.3493, followed by the 50-day EMA at 1.3427. A sustained break below these short- and medium-term averages would expose a nearly five-month low of 1.3159, recorded on March 31, followed by the 1.3010, the lowest since April 2025, which was recorded in November 2025.
GBP/USD: Daily Chart
Pound Sterling Price Today
The table below shows the percentage change of British Pound (GBP) against listed major currencies today. British Pound was the weakest against the US Dollar.
USD
EUR
GBP
JPY
CAD
AUD
NZD
CHF
USD
0.07%
0.11%
0.05%
0.02%
0.23%
0.24%
0.12%
EUR
-0.07%
0.05%
-0.02%
-0.05%
0.14%
0.16%
0.03%
GBP
-0.11%
-0.05%
-0.06%
-0.10%
0.11%
0.12%
-0.02%
JPY
-0.05%
0.02%
0.06%
-0.04%
0.19%
0.17%
0.06%
CAD
-0.02%
0.05%
0.10%
0.04%
0.23%
0.22%
0.08%
AUD
-0.23%
-0.14%
-0.11%
-0.19%
-0.23%
0.02%
-0.15%
NZD
-0.24%
-0.16%
-0.12%
-0.17%
-0.22%
-0.02%
-0.15%
CHF
-0.12%
-0.03%
0.02%
-0.06%
-0.08%
0.15%
0.15%
The heat map shows percentage changes of major currencies against each other. The base currency is picked from the left column, while the quote currency is picked from the top row. For example, if you pick the British Pound from the left column and move along the horizontal line to the US Dollar, the percentage change displayed in the box will represent GBP (base)/USD (quote).
AUD/USD surrenders early gains and turns negative as investors turn risk-averse after Iranian attacks on three ships in Hormuz.
Higher oil prices due to the Hormuz closure remain a key concern for global markets.
Australian Composite PMI returns above 50.0 in April.
The AUD/USD pair gives up its early gains and trades 0.24% lower around 0.7145 during the Asian trading session on Thursday. The Aussie pair faces selling pressure as the market sentiment turns risk-averse, following Iranian attacks on three ships in the Strait of Hormuz, a vital passage to almost 20% of global energy supply.
Australian Dollar Price Today
The table below shows the percentage change of Australian Dollar (AUD) against listed major currencies today. Australian Dollar was the weakest against the US Dollar.
USD
EUR
GBP
JPY
CAD
AUD
NZD
CHF
USD
0.06%
0.11%
0.03%
0.02%
0.25%
0.29%
0.12%
EUR
-0.06%
0.07%
-0.04%
-0.04%
0.16%
0.23%
0.04%
GBP
-0.11%
-0.07%
-0.09%
-0.11%
0.11%
0.17%
-0.03%
JPY
-0.03%
0.04%
0.09%
-0.02%
0.22%
0.24%
0.08%
CAD
-0.02%
0.04%
0.11%
0.02%
0.24%
0.27%
0.08%
AUD
-0.25%
-0.16%
-0.11%
-0.22%
-0.24%
0.06%
-0.16%
NZD
-0.29%
-0.23%
-0.17%
-0.24%
-0.27%
-0.06%
-0.20%
CHF
-0.12%
-0.04%
0.03%
-0.08%
-0.08%
0.16%
0.20%
The heat map shows percentage changes of major currencies against each other. The base currency is picked from the left column, while the quote currency is picked from the top row. For example, if you pick the Australian Dollar from the left column and move along the horizontal line to the US Dollar, the percentage change displayed in the box will represent AUD (base)/USD (quote).
As of writing, S&P 500 futures trade 0.53% lower to near 7,100, reflecting a weak risk appetite of investors. The US Dollar Index (DXY), which tracks the Greenback’s value against six major currencies, is up 0.1% to near 98.70, the highest level seen in over a week.
According to a report from The Wall Street Journal (WSJ), Tehran fired on three ships in the Hormuz and escorted two of them to Iranian waters, and is bringing those ships to Iran.
Though the US-Iran ceasefire extension has diminished fears of military activities, higher oil prices due to the Hormuz closure are keeping currencies from economies that rely on oil imports to meet their energy needs under pressure.
On the economic data front, Australian flash S&P Global Purchasing Managers’ Index (PMI) data for April has come in stronger than the previous reading. The Composite PMI returns above 50.0, a figure that separates expansion from contraction. The overall business activity improved to 50.1 from 46.6 in March due to higher output from both the manufacturing and the services sectors.
AUD/USD technical analysis
IAUD/USD trades lower at around 0.7145 as of writing; however, the pair holds a constructive near‑term bullish bias as spot remains above the 20-period Exponential Moving Average (EMA) at 0.7086, keeping the short-term trend supported after its recent recovery from sub-0.70 levels.
The Relative Strength Index (RSI) at about 60 stays in positive territory without entering overbought conditions, hinting that upside momentum is still present but not yet stretched.
On the downside, immediate support is defined by the 20-period EMA at 0.7086, where a break would signal fading bullish pressure and expose a deeper pullback toward recent lows. As long as AUD/USD defends this moving average on closing bases, the technical picture favors dip-buying strategies and keeps scope open for further gains in the sessions ahead.
Looking up, the multi-year high at 0.7222 is the major barrier for the pair; however, a breakout above the same would open the scope of extending the rally towards 0.7300.
USD/CAD trades sideways as a bullish piercing pattern emerges on the chart.
RSI remains bearish, suggesting downside pressure still dominates the trend.
Break above 1.3709 targets 1.3727 and 1.3742 resistance levels.
USD/CAD continues to trade laterally on Wednesday during the North American session, flattish at around 1.3658, as the pair seems capped by Monday’s price action, in which the Loonie appreciated 0.34% against the US Dollar (USD).
USD/CAD Price Forecast: Technical outlook
On Monday, the USD/CAD pair reached a daily high of 1.3709 and closed near the lows at 1.3644, extending a six-day streak of bearish sessions. Nevertheless, bulls moved in, finishing Tuesday in the green, up 0.15%, and forming a ‘bullish piercing pattern,’ which requires clearing the current week’s high of 1.3709 for further upside.
Momentum remains shifted to the downside as depicted by the Relative Strength Index (RSI). Hence, if sellers move in and clear Tuesday’s swing low of 1.3631, a move towards the 1.3600 figure is on the cards. Below, the next area of interest is the March 9 daily low at 1.3525.
On the upside, buyers must clear the 1.3700 figure, with immediate resistance seen at the 50-day Simple Moving Average (SMA) at 1.3727. Up next is the 100-day SMA at 1.3742, with the next supply area at 1.3800.
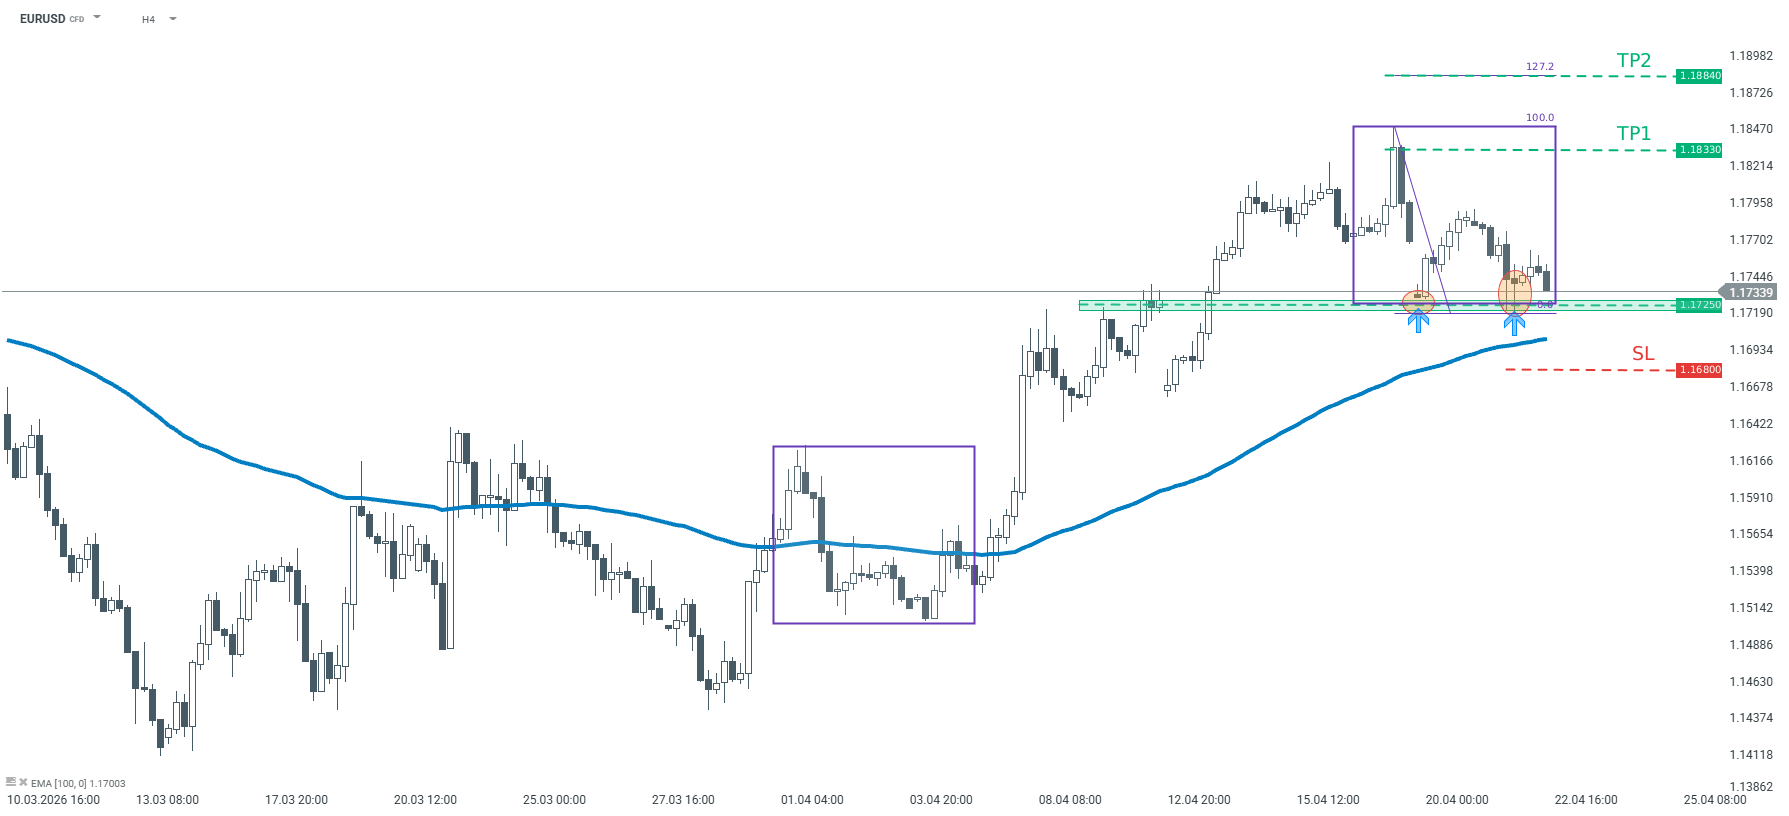
How does the technical situation on EURUSD looks like?
Facts:
EURUSD is trading in an upward move from mid-March
The pair bounced off the horizontal support at 1.1725 USD
The pair is trading above the 100 – period moving average form H4 interval
Recommendation: Trade: Long position on EURUSD at market price Target: 1.1833, 1.1884 Stop: 1.1680
Opinion: Looking at EURUSD at the H4 interval, we can see that the main sentiment on the pair is bullish. However, a downward correction has occurred recently, which has brought the pair down to the key support at 1.1725 USD. The support is a result of previous reactions as well as a lower limit of 1:1 structure. According to the Overbalance strategy, as long as the price sits above 1.1725 support, the main trend remains upward. We recommend going long EURUSD at market price with two targets: 1.1833 and 1.1884. We also recommend placing a stop loss order at 1.1680. Source: xStation5
GBP/USD may find the primary barrier at the two-month high of 1.3599.
The 14-day Relative Strength Index near 59 remains positive, without indicating overbought conditions.
The immediate support lies at the lower boundary of the ascending channel around 1.3500.
GBP/USD inches lower after registering modest gains in the previous day, trading around 1.3520 during the Asian hours on Tuesday. The technical analysis of the daily chart indicates an ongoing bullish bias, as the pair moves within the ascending channel pattern.
The GBP/USD pair trades with a mildly bullish near-term bias, holding above both the nine-period and 50-period Exponential Moving Averages (EMAs). The short-term EMA trading above the longer one hints at constructive momentum.
The 14-day Relative Strength Index (RSI) around 59 stays in positive territory without yet signaling overbought conditions, suggesting room for further gains as long as the pair remains supported on dips.
The initial barrier lies at the two-month high of 1.3599, recorded on April 17, followed by the upper boundary of the ascending channel around 1.3750. A break above the channel would reinforce the bullish bias and support the GBP/USD pair to approach the 1.3869, the highest level since September 2021, reached on January 27.
On the downside, the GBP/USD pair may find its immediate support at the lower boundary of the ascending channel around 1.3500, followed by the nine-day EMA at 1.3493. Further declines below this confluence support zone would put downward pressure on the pair to test the 50-day EMA at 1.3423. A sustained break below the medium-term average would expose a nearly five-month low of 1.3159, recorded on March 31, followed by the 1.3010, the lowest since April 2025, which was recorded in November 2025.
GBP/USD: Daily Chart
Pound Sterling Price Today
The table below shows the percentage change of British Pound (GBP) against listed major currencies today. British Pound was the weakest against the New Zealand Dollar.
USD
EUR
GBP
JPY
CAD
AUD
NZD
CHF
USD
0.09%
0.10%
0.06%
0.00%
0.10%
-0.32%
0.08%
EUR
-0.09%
0.02%
-0.02%
-0.09%
0.04%
-0.41%
0.00%
GBP
-0.10%
-0.02%
-0.02%
-0.10%
0.00%
-0.43%
-0.01%
JPY
-0.06%
0.02%
0.02%
-0.05%
0.02%
-0.43%
0.00%
CAD
-0.00%
0.09%
0.10%
0.05%
0.08%
-0.36%
0.07%
AUD
-0.10%
-0.04%
-0.01%
-0.02%
-0.08%
-0.44%
-0.01%
NZD
0.32%
0.41%
0.43%
0.43%
0.36%
0.44%
0.43%
CHF
-0.08%
-0.00%
0.01%
-0.01%
-0.07%
0.00%
-0.43%
The heat map shows percentage changes of major currencies against each other. The base currency is picked from the left column, while the quote currency is picked from the top row. For example, if you pick the British Pound from the left column and move along the horizontal line to the US Dollar, the percentage change displayed in the box will represent GBP (base)/USD (quote).
To provide the best experiences, we use technologies like cookies to store and/or access device information. Consenting to these technologies will allow us to process data such as browsing behavior or unique IDs on this site. Not consenting or withdrawing consent, may adversely affect certain features and functions.
Functional
Always active
The technical storage or access is strictly necessary for the legitimate purpose of enabling the use of a specific service explicitly requested by the subscriber or user, or for the sole purpose of carrying out the transmission of a communication over an electronic communications network.
Preferences
The technical storage or access is necessary for the legitimate purpose of storing preferences that are not requested by the subscriber or user.
Statistics
The technical storage or access that is used exclusively for statistical purposes.The technical storage or access that is used exclusively for anonymous statistical purposes. Without a subpoena, voluntary compliance on the part of your Internet Service Provider, or additional records from a third party, information stored or retrieved for this purpose alone cannot usually be used to identify you.
Marketing
The technical storage or access is required to create user profiles to send advertising, or to track the user on a website or across several websites for similar marketing purposes.