EUR/USD edges lower as the US-Iran stalemate revives demand for the safe-haven USD.
Bets for at least one Fed rate cut in 2026 might cap the USD ahead of the FOMC meeting.
The mixed technical setup warrants some caution before positioning for a firm direction.
The EUR/USD pair trades with a mild negative bias during the Asian session on Tuesday and looks to extend the previous day’s retracement slide from levels just above mid-1.1700s.
The uncertainty over the second round of US-Iran peace talks underpins the safe-haven US Dollar (USD), which, in turn, is seen as a key factor acting as a headwind for spot prices. The USD bulls, however, seem hesitant and opt to wait for the outcome of a two-day FOMC policy meeting on Wednesday before placing aggressive bets. This assists the EUR/USD pair to hold above the 1.1700 round-figure mark.
The EUR/USD pair holds a modest bullish bias as it trades above the 200-period Simple Moving Average (SMA) and the 38.2% Fibonacci retracement level of the recent move up from the late March low. However, momentum oscillators are mixed and hint that upside pressure is constructive but not impulsive. The Moving Average Convergence Divergence (MACD) line is marginally positive and above its signal.
That said, the Relative Strength Index (RSI) slips back toward the mid-40s. Adding to this, the overnight failure near the 23.6% Fibo. and the subsequent fall warrants caution before placing positioning for any meaningful appreciating move. On the topside, initial resistance emerges at 1.1749 (23.6% Fibo. level), ahead of a more substantial barrier at the recent cycle high region just ahead of mid-1.1800s.
On the downside, immediate support is seen at the 38.2% Fibo. retracement at 1.1690, with further cushions at the 50.0% level around 1.1643 and the 61.8% retracement near 1.1595. A deeper pullback toward 1.1528 and 1.1442 would only come into view if the EUR/USD pair slips decisively below the 200-period SMA on the 4-hour chart.
(The technical analysis of this story was written with the help of an AI tool.)
EUR/USD 4-hour chart
US Dollar Price Today
The table below shows the percentage change of US Dollar (USD) against listed major currencies today. US Dollar was the strongest against the New Zealand Dollar.
USD
EUR
GBP
JPY
CAD
AUD
NZD
CHF
USD
0.06%
0.03%
-0.22%
0.06%
0.04%
0.15%
0.12%
EUR
-0.06%
-0.04%
-0.30%
-0.02%
-0.04%
0.04%
0.06%
GBP
-0.03%
0.04%
-0.24%
0.03%
0.02%
0.10%
0.10%
JPY
0.22%
0.30%
0.24%
0.29%
0.28%
0.36%
0.35%
CAD
-0.06%
0.02%
-0.03%
-0.29%
-0.02%
0.06%
0.07%
AUD
-0.04%
0.04%
-0.02%
-0.28%
0.02%
0.09%
0.12%
NZD
-0.15%
-0.04%
-0.10%
-0.36%
-0.06%
-0.09%
-0.01%
CHF
-0.12%
-0.06%
-0.10%
-0.35%
-0.07%
-0.12%
0.00%
The heat map shows percentage changes of major currencies against each other. The base currency is picked from the left column, while the quote currency is picked from the top row. For example, if you pick the US Dollar from the left column and move along the horizontal line to the Japanese Yen, the percentage change displayed in the box will represent USD (base)/JPY (quote).
GBP/JPY trims intraday gains as the British Pound softens on UK political uncertainty.
Markets await the BoE and BoJ monetary policy decisions due this week.
Technicals remain bullish above key SMAs, though momentum shows signs of cooling.
GBP/JPY gives back part of its earlier gains on Monday as the British Pound (GBP) comes under pressure following reports that UK Prime Minister Keir Starmer will face a parliamentary vote on a possible probe into whether he misled lawmakers over the appointment of Peter Mandelson as ambassador to the United States.
However, the downside remains limited as the Japanese Yen (JPY) continues to underperform most of its major peers, with elevated Oil prices weighing on the currency given Japan’s heavy reliance on imported energy.
At the time of writing, GBP/JPY is trading around 215.67, easing slightly after hitting 216.06, its highest level since January 2008, while the wide interest rate differential between the Bank of England (BoE) and the Bank of Japan (BoJ) keeps the broader bias tilted to the upside.
Attention now turns to upcoming monetary policy meetings due this week, with both the BoE and the BoJ widely expected to hold rates steady as policymakers assess the impact of rising Oil prices on inflation and economic growth.
The BoJ’s slow pace of policy normalization is likely to keep the Yen on the defensive, although lingering intervention risks could limit further weakness amid repeated warnings from Japanese officials, with USD/JPY hovering close to the 160 mark.
In the daily chart, GBP/JPY keeps a bullish near-term bias as it holds well above both the 21-day simple moving average (SMA) at 213.60 and the 50-day SMA at 212.24. The positive but moderating Relative Strength Index (RSI) around 65 and a still-positive Moving Average Convergence Divergence (MACD) histogram hint that upside momentum persists, though the pace of the advance is losing some steam as the cross consolidates near recent highs.
On the downside, initial support is seen at the 21-day SMA at 213.60, with a deeper pullback likely finding additional demand near the 50-day SMA at 212.24. As long as GBP/JPY holds above these moving averages, the broader bullish structure remains intact, and any dips toward this support band may be treated as corrective rather than signaling a sustained reversal.
(The technical analysis of this story was written with the help of an AI tool.)
Japanese Yen Price Today
The table below shows the percentage change of Japanese Yen (JPY) against listed major currencies today. Japanese Yen was the strongest against the Swiss Franc.
USD
EUR
GBP
JPY
CAD
AUD
NZD
CHF
USD
-0.14%
-0.08%
-0.06%
-0.43%
-0.49%
-0.51%
-0.03%
EUR
0.14%
0.08%
0.09%
-0.28%
-0.32%
-0.35%
0.13%
GBP
0.08%
-0.08%
0.00%
-0.38%
-0.43%
-0.45%
0.05%
JPY
0.06%
-0.09%
0.00%
-0.35%
-0.42%
-0.46%
0.09%
CAD
0.43%
0.28%
0.38%
0.35%
-0.06%
-0.10%
0.41%
AUD
0.49%
0.32%
0.43%
0.42%
0.06%
-0.01%
0.47%
NZD
0.51%
0.35%
0.45%
0.46%
0.10%
0.01%
0.49%
CHF
0.03%
-0.13%
-0.05%
-0.09%
-0.41%
-0.47%
-0.49%
The heat map shows percentage changes of major currencies against each other. The base currency is picked from the left column, while the quote currency is picked from the top row. For example, if you pick the Japanese Yen from the left column and move along the horizontal line to the US Dollar, the percentage change displayed in the box will represent JPY (base)/USD (quote).
MUFG analysts note that EUR/GBP has drifted lower within a 0.8600–0.8800 range as the Pound (GBP) outperforms the Euro (EUR). The euro-zone faces weaker PMIs and rising stagflation risks, while stronger United Kingdom (UK) data and sticky inflation have markets pricing more BoE tightening. They see scope for several Monetary Policy Committee (MPC) members to vote for a hike, keeping EUR/GBP under pressure.
Pound supported by stronger UK data
“The initial negative impact of the energy price shock on the euro‑zone economy was evident in the latest PMI surveys for April. The surveys showed that business confidence fell sharply in the services sector, while holding up better among manufacturers. The euro‑zone services PMI declined by 2.8 points to 47.4 in April, whereas the manufacturing PMI rose by 0.6 points to 52.2.”
“For the euro‑zone economy as a whole, the composite PMI dropped by 2.1 points to 48.6, marking its weakest level since November 2024. The index has now fallen by 3.3 points since February, prior to the Middle East conflict. Business confidence has deteriorated more quickly than during the previous energy price shock triggered by Russia’s invasion of Ukraine in early 2022 and is already at much weaker levels.”
“The GBP has held up better than the EUR over the past week, placing modest downward pressure on EUR/GBP, although the pair has remained within a relatively tight 0.8600–0.8800 range since the conflict began. The GBP has been supported by further evidence that the UK economy started the year with more underlying momentum than previously expected, while the initial negative impact of the energy price shock has so far appeared limited.”
“Stronger growth momentum has increased the risk of a hawkish policy update from the BoE this week. The UK rate market has moved to price back in more tightening from the BoE, and the uplift for UK yields has provided more support for the GBP. The 2-year government bond yield in the UK has increased by around 30bps from the recent low compared to around 20bps in the euro-zone and just over 10bps in the US.”
EUR/GBP bounced up from lows near 0.8650 but remains capped below 0.8670 so far.
Weak German consumer confidence data has weighed on the Euro across the board.
Technical indicators show a waning bearish pressure.
The Euro (EUR) is trimming some losses against the British Pound (GBP) on Monday after finding support at the 0.8655 area late last week. Upside attempts, however, remain capped below a previous support area at 0.8670 so far, which leaves the broader bearish trend in play for now.
Data from Germany released earlier on Monday revealed that consumer confidence for May, as measured by the GfK Consumer Confidence Survey, deteriorated to its weakest level since February 2023, amid the consequences of the war in Iran. The impact of these figures on the Euro, however, has been cushioned by a mild risk appetite, fuelled by news of ongoing negotiations between the US and Iran to end the Middle East conflict. This is keeping the Euro and the Pound moderately positive against the safe-haven US Dollar (USD).
Technical Analysis: Bears are losing momentum
From a technical perspective, the 4-hour chart shows the EUR/GBP trading within a bearish channel, although Friday’s upper low and a bullish divergence in the Relative Strength Index (RSI) suggest that sellers might be losing momentum.
The RSI has been trending higher, although it is still below the 50 midline, highlighting a mild bearish pressure. The Moving Average Convergence Divergence (MACD) histogram is flat near the zero line, pointing to a lack of strong directional momentum, altogether showing an indecisive market.
Bulls would need to confirm above the area around 0.8685 (April 8, 14 lows, and April 24 high) to clear the path towards trendline resistance, now at 0.8705. Key support is at the confluence of Thursday and Friday’s lows, between 0.8655 and 0.8660, and the channel bottom, at 0.8650. Further down, the next target is the March 24 and 26 lows near 0.8635.
Euro Price Today
The table below shows the percentage change of Euro (EUR) against listed major currencies today. Euro was the strongest against the US Dollar.
USD
EUR
GBP
JPY
CAD
AUD
NZD
CHF
USD
-0.21%
-0.16%
-0.16%
-0.40%
-0.49%
-0.51%
-0.11%
EUR
0.21%
0.08%
0.07%
-0.19%
-0.26%
-0.29%
0.10%
GBP
0.16%
-0.08%
0.00%
-0.24%
-0.34%
-0.37%
0.04%
JPY
0.16%
-0.07%
0.00%
-0.23%
-0.34%
-0.38%
0.08%
CAD
0.40%
0.19%
0.24%
0.23%
-0.10%
-0.14%
0.29%
AUD
0.49%
0.26%
0.34%
0.34%
0.10%
-0.01%
0.39%
NZD
0.51%
0.29%
0.37%
0.38%
0.14%
0.01%
0.41%
CHF
0.11%
-0.10%
-0.04%
-0.08%
-0.29%
-0.39%
-0.41%
The heat map shows percentage changes of major currencies against each other. The base currency is picked from the left column, while the quote currency is picked from the top row. For example, if you pick the Euro from the left column and move along the horizontal line to the US Dollar, the percentage change displayed in the box will represent EUR (base)/USD (quote).
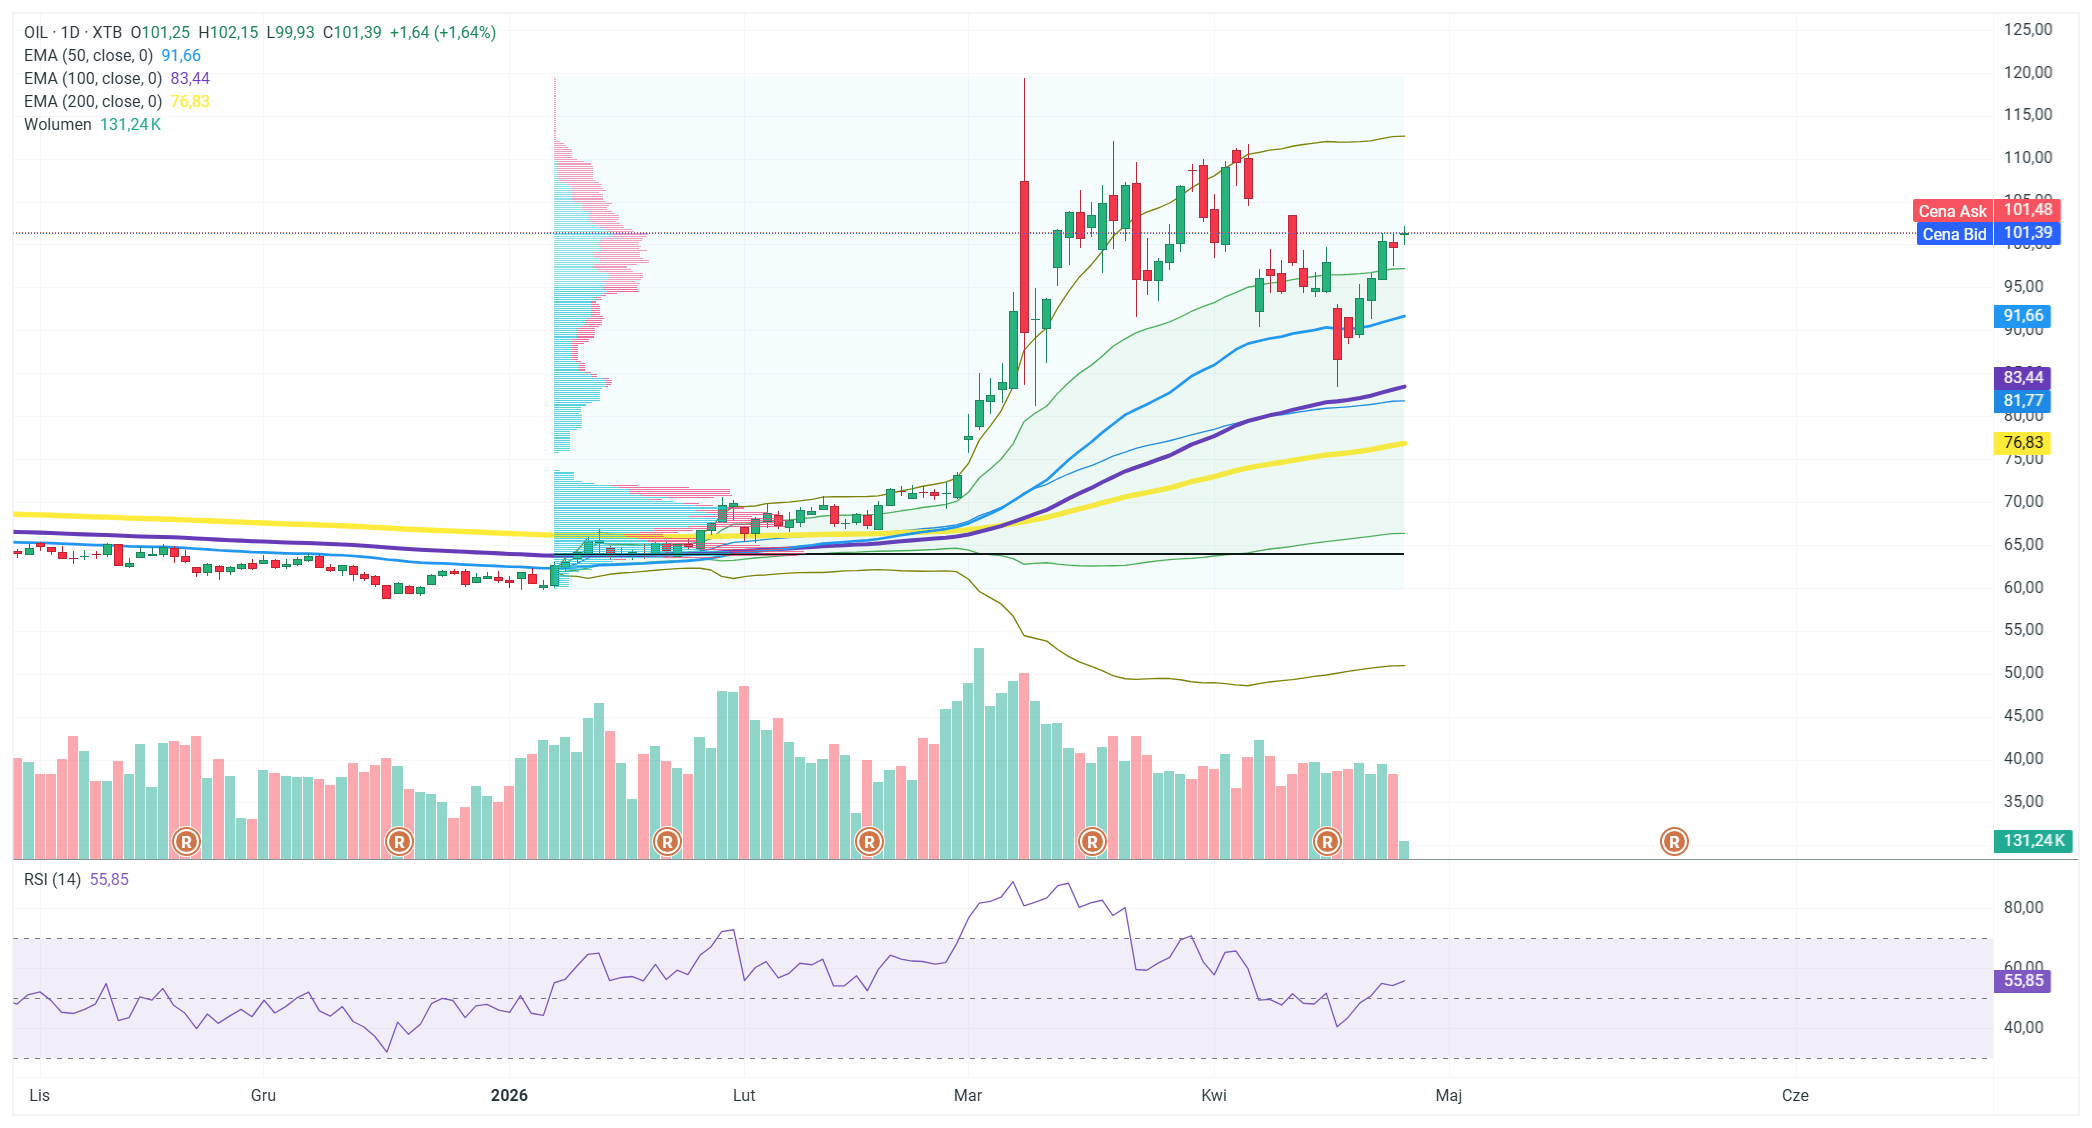
Brent crude opened the new week with gains, trading at $101.56 per barrel (+1.81%), with a daily high of $102.15. On the daily chart, the price has clearly moved away from key moving averages—the EMA50 stands at $91.66, the EMA100 at $83.44, and the EMA200 at $76.83—confirming the strong uptrend that has persisted for many weeks. The RSI(14) at 56.01 indicates moderate upward momentum, with no signs of the market being overbought. The geopolitical situation surrounding the Strait of Hormuz remains the main driver of oil prices.
Following visits to Pakistan and Oman, Iranian Foreign Minister Araghchi announced the continuation of consultations with the Sultanate regarding safe transit through the strait, which the market initially interpreted as a sign of de-escalation—WTI retreated from its daily high of $96.68 to around $95.35.
However, caution is warranted:
control over the Strait of Hormuz remains Tehran’s main bargaining chip, and it is difficult to expect Iran to relinquish it before securing concessions on the nuclear issue. Trump, for his part, has made it clear that he will maintain the naval blockade as a tool of pressure, and any “opening” of the strait would be, at best, a symbolic gesture by Iran in exchange for lifting the blockade. The key event of the day is the Situation Room meeting convened by Trump, the outcome of which could cause oil prices to spike.
Looking at the week as a whole, the oil market will react to decisions by the Fed, ECB, and BoE, as well as macroeconomic data (PCE, GDP, ISM), and any news from the Middle East could trigger sharp volatility in an already heated commodities market.
Peace talks stalemate, but hopes grow a deal can be found
Will Iran be forced to negotiate as oil storage reaches capacity?
US stocks priced for perfection, can Warsh news push them higher?
US stocks outperform Europe
Tech overtakes defense as top sector
Central bank meetings: are they still willing to look through the energy price spike as tensions persist?
Earnings to watch: big week for the Magnificent 7
The Week Ahead:
Central banks and earnings to distract from events in Middle East As we start a new week, we have a central bank bonanza to look forward to, including potentially the last FOMC meeting where Jerome Powell is chair, a Bank of Japan meeting, and an ECB and BOE meeting to digest. There is also a swathe of economic data releases, including the first reading of Q1 GDP in the US and ISM data for April, along with inflation data from the Eurozone, and money supply and house price data from the UK. However, the focus for markets will still be the news flow coming from the Iran conflict. Crude oil prices have climbed at the start of the week, and Brent is higher by more than 1.5% this morning and is above $106 per barrel. It had been above $107 per barrel earlier today, but it pared gains after reports that Iranian officials have proposed a new plan to the US to reopen the Strait of Hormuz. We need to hear from the US to see if this plan will bear fruit and reopen the Strait, but as the conflict drags on, investors are getting worried about the impact on energy prices. There are growing expectations that the oil price will remain higher for longer, as the blockade on the Strait enters its third week. Goldman Sachs has increased its Q4 oil price target to $90 per barrel, from $80, as disruption to production persists for the coming months.
Will latest Iran plan reopen the Strait?
Peace talks stalled at the weekend, and we need to hear whether the US will accept Iran’s proposal around the Strait. The most likely scenario is that more talks are scheduled to discuss this latest plan. The global economy will be counting on this latest proposal to finally open the Strait. Stock markets have been resilient so far to the blockade of the Strait, especially in the US. If there is no flow of traffic for another week, sentiment might show signs of weakening. Futures prices are pointing to a mildly positive open for the main European indices, and US futures prices are little changed, which suggests that investors remain optimistic that a solution can be found.
Will Iran be forced to negotiate as oil storage reaches capacity?
The longer the blockade lasts for the bigger risk there is to Iranian oil fields. They differ from other wells in the region because they work on low pressure. If they are shut down due to the blockade and a lack of storage, it could cause permanent damage to Iran’s energy infrastructure. Estimates of Iran’s oil storage are around 20 million barrels, this means that Iranian storage facilities could reach capacity in the next few days. If this happens, then the Iranian regime might be compelled to negotiate with the US and find a way to reopen the Strait of Hormuz.
US stocks priced for perfection, can Warsh news push them higher?
The S&P 500 and the Nasdaq are priced for perfection, both US indices closed at record highs at the end of last week on hopes that the US and Iran would restart talks at the weekend. Although the talks failed to materialize, we doubt that stock markets will fall sharply, as there is expectation that talks will resume soon. Markets could also be cheered by the news that the Department of Justice dropped a criminal investigation into the Chair of the Federal Reserve Jerome Powell. Senator Thom Tillis also said on Sunday that he would support President Trump’s pick to be Fed chair, Kevin Warsh.
This means that Warsh’s confirmation to lead the Federal Reserve after Jerome Powell steps down in May, is all but assured. Now that Warsh has a clear path to replacing Jerome Powell, it reduces the chance of President Trump firing Powell, who had promised to stay on as Fed chair on an interim basis, until a new chair was voted into position. This could have led to fears about Fed independence, and weighed on US Treasuries, and market sentiment more broadly.
With that risk now eradicated, the focus will be on what Fed chair Powell does after his term expires next month. He remains a voting member of the Fed until 2028, without the threat of prosecution hanging over him, will he opt to retire? If so, this will mean that President Trump can choose another member of the FOMC board. Trump does not hide his preference for rate cuts, so there could be some expectation of a dovish shift at the Fed in the coming months, which may bolster risk sentiment in the short term.
US stocks outperform Europe
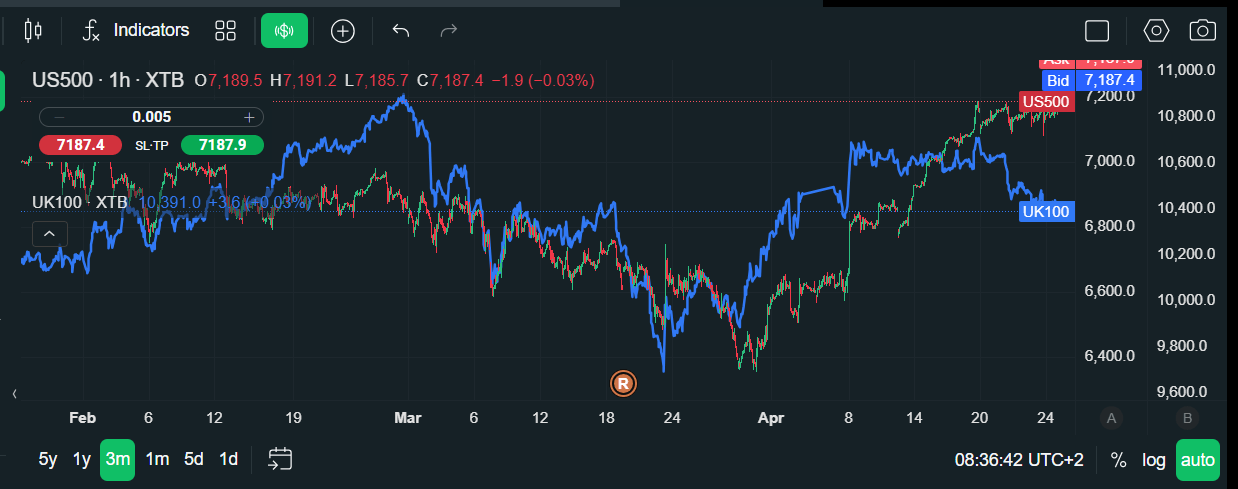
This may also help US stocks to continue to outperform their European counterparts. The Nasdaq closed higher by nearly 2% on Friday, led by Intel, which jumped 23% after a positively received earnings report that cements its position as a key AI player in 2026. The Nasdaq rose by 2.4% last week, the S&P 500 was higher by 1.28%.
This compares with a 2% decline for the FTSE 100 and a 0.1% drop for the Dax. Tech is leading the market higher in the US, and the issue for Europe is that it is light on tech. The European market is also a growth taker market, this means that it relies on strong global growth and global themes to drive returns. With the oil price remaining elevated, and global growth threatened, this will limit European stock market upside. In contrast, US tech is rising on the back of lower interest rates, a falling oil price, continued AI spend and hopes that the AI theme has further to run.
Chart 1: S&P 500 vs. FTSE 100
Source: XTB
Tech overtakes defense as top sector
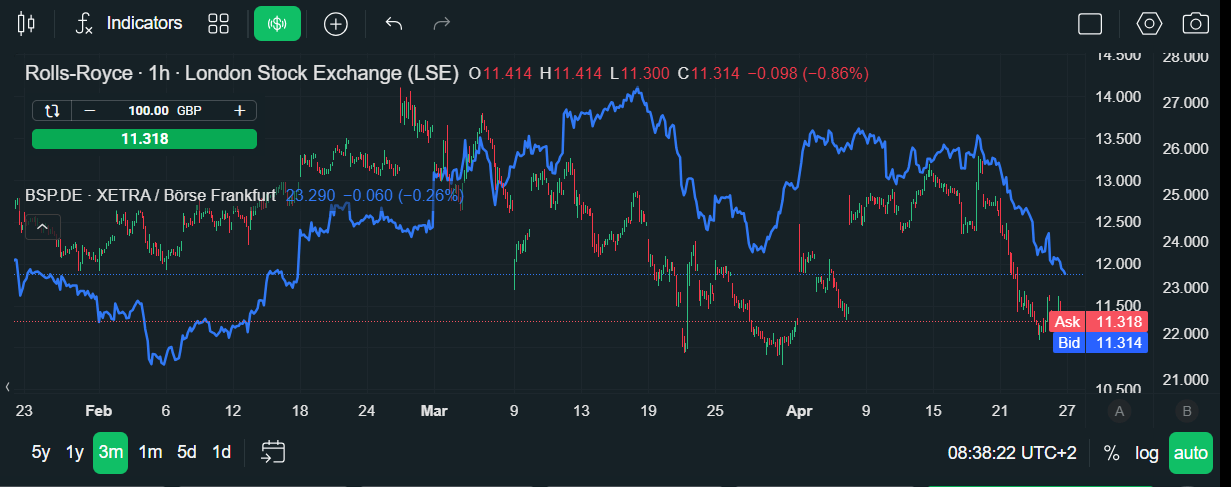
The top performers on the Nasdaq last week were solid AI names. Chipmakers Arm Holdings and AMD were the top two performers last week, rising 40% and 23% respectively. In contrast, defense stocks have been sold off as investors have rotated back into tech, and Lockheed Martin was the weakest performer on the S&P 500 last week, falling 3%. This is another reason why European indices are underperforming their US counterparts; they have several defense names that are coming under pressure. In the UK, Rolls Royce and BAE Systems both fell more than 9% and acted as a major drag on the FTSE 100.
Rheinmetall also dropped 11% last week and hindered the Dax index. US stocks are also benefitting from a strong earnings season. Of the 28% of companies in the S&P 500 that have reported earnings, 84% have reported earnings that were higher than expected, which is above the 5-year and the 10-year averages. There have been upside-earning surprises for the financial, industrial, communication services, and the tech sectors. These have balanced out earnings misses from the energy sector. Ironically enough, the energy sector has been a drag on the US index this year, however, that is unlikely to last into Q2 after the massive surge in the oil price.
Chart 2: Rolls Royce and BAE Systems fall out of favour even though the conflict in the Middle East is ongoing
Source: XTB
Earnings will be a key theme in the coming week, as five of the Magnificent 7 report. Below we look at two key themes that will drive price action in the coming days.
1, Central bank meetings
There is a whole suite of central bank meetings coming up this week, including the Fed, the BOJ, the ECB and the BOE. Analysts do not expect there to be any major change to rates this week from these meetings, and we may need to wait until May/June before central bankers will give their updated view on forward guidance. Energy prices remain elevated and there are concerns that supply chain disruption will increase stagflationary risks as the Strait of Hormuz has remained effectively closed for the best part of 2 weeks now. Investors will be scrutinizing central bankers’ views on the ongoing blockade and what it means for the future of policy and markets are likely to be extremely reactionary to these meetings, especially around the Fed meeting and the BOE meeting on Thursday.
This is likely to be the final meeting for Fed chair Jerome Powell. No new forecasts or Dot Plots are expected, which leaves asset prices vulnerable to the Fed’s views on the growth concerns versus inflation considerations. The market still expects the Fed to cut interest rates this year, and Warsh at the helm of the Fed is expected to reinforce the view that rate cuts are likely in the US by year end. For now, rates are on hold, but signs that the Fed will look through this period of elevated energy costs could boost sentiment in a market that is already optimistic about the future. In the Eurozone, the ECB is also expected to remain on hold, however, the ECB could be more focused on the inflationary impact from the war due to its single mandate for price stability, and the fact that the Eurozone is an energy importer and could import inflation due to this price spike.
A rise in inflation is expected across the currency bloc in April, and this could focus minds on the need to hike rates later this year if the Strait of Hormuz does not reopen soon. The BOE will also announce its latest policy decision on Thursday. The market expects two rate cuts from the BOE this year, and it will be interesting to see if the Governor reacts to market expectations. So far, although inflation has risen in March, growth has held up well, including stronger retail sales and a drop in the unemployment rate. However, we think that the governor will take a cautious stance as the underlying UK economy remains weak, and rising energy prices could knock it even further. A hike could be coming if we see second round inflation effects like rising wages, however, there is no sign of that so far, and UK wages are at their lowest level in 5 years.
2, Earnings to watch
There are 160 S&P 500 members reporting earnings this week, including Meta, Apple, Amazon, Alphabet and Microsoft. General Motors and Robinhood will also be highlights. The biggest tech firms have a high bar to clear, given that there remains lingering concerns in the market about AI spending and investments. These companies need to show that revenues justify the level of capex the companies want to spend. Added to this, their stock prices have already rallied into earnings season, and they have all seen gains of more than 10% this month, with Apple rising 6%. Alphabet is expected to report revenue growth of more than 20% YoY.
There are expectations that the company will report improving monetization from its AI expenditure, particularly with greater uptake of Gemini. The risks to its earnings report are fears about future profit margins, and concerns about capex plans. Alphabet’s stock price tends to rally on the back of earnings reports, with an average gain of 1.3%. Meta will also report results on Wednesday evening. Earlier in the year, Meta’s share price jumped after it reported stronger forward guidance, we will now see if Meta can deliver. YoY revenue growth is expected to be strong, and $55.5bn is expected. The company has beaten earnings expectations in every quarter for the last three years, so expectations are high that they will do so again. Investors want to see bottom line gains from its massive AI expenditure, and a clear strategy about what Meta’s newest AI mode, its Muse Spark, will do and how it will enhance customer experience at the tech giant.
Wednesday is heaving with earnings, as Meta also reports results. Microsoft has had a tough 2026 so far, and is down 12% YTD, after a tough Q4 earnings report and underwhelming earnings guidance. This quarter could be about redemption. The company is expected to report double-digit earnings growth for Q1 relative to a year ago. Its share price is higher by 12% in the past month, as excitement comes back to the market about the AI theme. On average, Microsoft’s shares tend to flatline during earnings reports, so hopes are high that this earnings report can buck the trend. Apple is also in focus, however, it won’t just be revenues that investors want to hear about.
We have already heard that Tim Cook is stepping down in September and John Ternus will succeed him. The company is expected to report revenues of $109.45bn for last quarter, but investors may want to get some sense of what Ternus will bring to Apple when he takes over later this year. Will he push Apple down the AI route, something Cook was unwilling to do? Apple is also known for its shareholder sweeteners, and share buybacks and dividends could also be on the cards. This may boost enthusiasm for the stock, which is basically flat YTD.
EUR/JPY may explore the region around the all-time high of 187.95.
The 14-day Relative Strength Index near 60 signals positive momentum without extreme conditions.
The immediate support lies at the nine-day EMA of 186.75.
EUR/JPY inches lower after registering modest gains in the previous day, trading around 186.70 during Asian hours on Monday. The technical analysis of the daily chart indicates the currency cross is positioned within the ascending channel, signaling an ongoing bullish bias.
The EUR/JPY cross holds a bullish near-term bias as it consolidates above both the nine-day and 50-day Exponential Moving Averages (EMAs), respectively. The currency cross is hovering just under the recent highs, with the 14-day Relative Strength Index (RSI) around 60, suggesting positive but not extreme momentum that keeps the door open for another push higher while dips remain contained.
The EUR/JPY cross may advance toward the all-time high of 187.95, which was recorded on April 17. Further advances above this level would support the currency cross to explore the region around the upper boundary of the channel, around 189.70.
On the downside, the immediate support lies at the nine-day EMA of 186.75, aligned with the lower boundary of the ascending channel around 186.60. A sustained break below the channel would put downward pressure on the EUR/JPY cross to test the 50-day EMA at 184.94.
EUR/JPY: Daily Chart
Euro Price Today
The table below shows the percentage change of Euro (EUR) against listed major currencies today. Euro was the strongest against the US Dollar.
USD
EUR
GBP
JPY
CAD
AUD
NZD
CHF
USD
-0.06%
-0.07%
-0.10%
-0.03%
-0.30%
-0.17%
-0.02%
EUR
0.06%
0.02%
-0.04%
0.03%
-0.22%
-0.09%
0.04%
GBP
0.07%
-0.02%
-0.04%
0.02%
-0.22%
-0.09%
0.04%
JPY
0.10%
0.04%
0.04%
0.08%
-0.20%
-0.09%
0.11%
CAD
0.03%
-0.03%
-0.02%
-0.08%
-0.27%
-0.16%
0.01%
AUD
0.30%
0.22%
0.22%
0.20%
0.27%
0.14%
0.28%
NZD
0.17%
0.09%
0.09%
0.09%
0.16%
-0.14%
0.15%
CHF
0.02%
-0.04%
-0.04%
-0.11%
-0.01%
-0.28%
-0.15%
The heat map shows percentage changes of major currencies against each other. The base currency is picked from the left column, while the quote currency is picked from the top row. For example, if you pick the Euro from the left column and move along the horizontal line to the US Dollar, the percentage change displayed in the box will represent EUR (base)/USD (quote).
The Bank of England is worried about a stock market crash and expects an ‘adjustment’ in equity prices. The Deputy Governor, Sarah Breedon, told the BBC that she did not know when or by how much stocks would fall, but she claimed that macroeconomic risks were not fully priced into stock prices, after US indices hit record highs earlier this week. It doesn’t take a genius to expect a market correction at some point; there have always been market corrections for as long as trading has existed. Breedon is also the head of Financial Stability at the BOE, so it is her job to worry about these issues. However, should investors be worried too?
BOE paid to worry about market risks
Breedon flagged a few issues that were keeping her ‘awake at night’. These include: the energy price spike caused by the events in the Middle East, and a private credit crunch. The latter is not the same as the banking credit crunch of 2008, but the scale of the private markets has been noted by the BOE. The private credit markets are now worth more than $500bn, and Breedon is concerned that its resilience to economic downturns has not been tested. The BOE is still concerned about US tech stocks, in particular, their extremely high valuations and the amount of money companies such as Microsoft, Meta and Amazon are investing into AI. Breedon notes that AI stocks are extremely expensive, and if there is a macroeconomic shock then these valuations could mean that tech stocks fall sharply. For those who have just funded their stocks and shares ISA, a BOE official talking about a stock market crash is alarming. It is worth breaking down Breedon’s concerns to assess what they mean for the near term.
Energy price spike and the risk to the global economy
All Breedon’s concerns are valid, and it is her job to manage the risks that could impact asset prices. Her first concern around the Middle East crisis and the energy price spike is completely out of any individual investors’ control. No one can say when the Strait of Hormuz will reopen or when the oil price will fall back to pre-war norms. We know that the price of oil is damaging for businesses, from airlines to supermarkets, that must shoulder higher costs. This could lead to lower consumption and lower profits for these companies in the future. On the other hand, energy prices could normalize in the coming months if the war ends. The trouble is, we don’t know what will happen between Iran and the US next. However, there are some strategies to help you deal with this risk. The first is to stay invested. Very few people see this war as dragging on for years. If you invest in stocks and shares, then you should think about holding them for the long term so that you can ride the ups and downs of the global economy.
The costs of not holding stocks
Secondly, although it can feel like a complex environment to hold stocks, you must compare this to the impact of keeping your money in cash. It is a myth to think that cash is a safe investment, especially when inflation is rising. In March, UK CPI rose to 3.3%, if you keep your money in a cash account with a lower interest rate than the inflation rate, this means that in real terms your money is losing value every year. In contrast, UK and US stock markets are posting positive gains so far this year. The main US index is higher by 3%, while the FTSE 100 is up 4.7%. This is something that also needs to be considered when talking about stock market risks.
Is an AI bubble on the cards?
Regarding AI and tech concerns, AI stocks have been in focus in recent months, and it is true that they are trading at huge valuations. Four of the five of the world’s biggest companies are linked to AI. Nvidia, the world’s most highly valued company, it is worth $4.85 trillion, makes the chips for AI, while Alphabet, Microsoft and Amazon are hyperscalers who have invested hundreds of billions of dollars into AI in recent years. These companies’ stock prices have risen by a huge amount, in five years Nvidia’s stock price is higher by 1200%, but earnings have also been high.
Next week, Microsoft is set to announce revenues of $81.4bn for the first three months of the year, a 16% increase in 12 months. Nvidia is expected to breach the $500bn revenue threshold by 2028. Although some debt has been issued by the likes of Microsoft, Amazon and Meta, have mostly fueled their AI spending without debt, and this means that if there is a stock market adjustment like Breedon warns, it may not cause financial strain like we saw in the aftermath of 2008. Breedon is right to be concerned about AI. Revenue generated from AI is expected to hit $50bn in the US this year, on the back of $1 trillion in investment.
AI investment now counts for a large amount of US economic activity, about 1.6% of GDP in 2026, which means that any retrenchment in AI spending could cause economic headwinds. Concerns about private credit are also valid at this stage. It is a relatively new market, and there is concern that private credit funds have poured funds into data centers and other AI investments that could turn sour. There are lots of ‘what if’ scenarios to consider, but it can be more effective to look at the data. In Q1, Fitch Ratings said that the default rate for the US private debt markets was on an upward trend at 5.8% in January, up from 5.6% in December.
Fitch pointed out that while default rates are rising, they remain concentrated and are not broad based. However, it is worth noting that an economic recession caused by the energy price spike could prove to be a significant test for the private credit industry. Overall, while worry is warranted, panic is not justified at this stage. It is the BOE’s job to monitor these events and try and mitigate any negative effects from the worst case scenario playing out. But the truth is, the worst case does not always play out, and expecting it to can impact portfolio returns.
The material on this page does not constitute financial advice and does not take into account your level of understanding, investment objectives, financial situation or any other specific needs. All information provided, including opinions, market research, mathematical results and technical analyzes published on the Website or transmitted To you by other means, it is provided for information purposes only and should in no way be construed as an offer or solicitation for a transaction in any financial instrument, nor should the information provided be construed as advice of a legal or financial nature on which any investment decisions you make should be based exclusively To your level of understanding, investment objectives, financial situation, or other specific needs, any decision to act on the information published on the Website or sent to you by other means is entirely at your own risk if you In doubt or unsure about your understanding of a particular product, instrument, service or transaction, you should seek professional or legal advice before trading. Investing in CFDs carries a high level of risk, as they are leveraged products and have small movements Often the market can result in much larger movements in the value of your investment, and this can work against you or in your favor. Please ensure you fully understand the risks involved, taking into account investments objectives and level of experience, before trading and, if necessary, seek independent advice.
To provide the best experiences, we use technologies like cookies to store and/or access device information. Consenting to these technologies will allow us to process data such as browsing behavior or unique IDs on this site. Not consenting or withdrawing consent, may adversely affect certain features and functions.
Functional
Always active
The technical storage or access is strictly necessary for the legitimate purpose of enabling the use of a specific service explicitly requested by the subscriber or user, or for the sole purpose of carrying out the transmission of a communication over an electronic communications network.
Preferences
The technical storage or access is necessary for the legitimate purpose of storing preferences that are not requested by the subscriber or user.
Statistics
The technical storage or access that is used exclusively for statistical purposes.The technical storage or access that is used exclusively for anonymous statistical purposes. Without a subpoena, voluntary compliance on the part of your Internet Service Provider, or additional records from a third party, information stored or retrieved for this purpose alone cannot usually be used to identify you.
Marketing
The technical storage or access is required to create user profiles to send advertising, or to track the user on a website or across several websites for similar marketing purposes.