


The offshore yuan strengthened to around 6.76 per dollar on Tuesday, holding near its strongest level since February 2023, as investors increasingly regarded Chinese assets as a relative safe haven amid heightened geopolitical tensions involving Iran. Geopolitical uncertainty persisted after the latest developments indicated that Iran had suspended indirect talks with Washington over Israel’s military operations in Lebanon, even as US President Trump asserted that negotiations remained ongoing. China’s diversified energy supply base and comparatively limited direct exposure to the Middle East have reinforced the attractiveness of its financial markets during the conflict, underpinning the yuan’s resilience. However, further upside in the yuan may be capped by Beijing’s preference for exchange-rate stability, as reflected in the People’s Bank of China’s continued weaker-than-expected daily fixings, as well as potential dollar-buying interventions by major state-owned banks.

NZD/USD – Kiwi corrects lower and tests support at 0.5965
- NZD/USD pulls back to 0.5965 after rejection at the 0.6000 area.
- Fresh US-Iran hostilities are casting doubt about a fragile ceasefire.
- Upbeat manufacturing data from China provided some support to the NZD.
The New Zealand Dollar (NZD) holds marginal losses against the US Dollar (USD) on Monday, retreating to session lows of 0.5965 from highs a few pips below 0.6000. Manufacturing data from China has been supportive, although the skirmishes between the US and Iran are feeding a certain degree of cautiousness at the week’s opening.
The US military reported a new wave of airstrikes on Iran’s military sites, and Tehran said that they targeted a US base that was used to launch attacks on the country. US President Donald Trump keeps pondering whether to sign a ceasefire extension or not, and meanwhile, the Strait of Hormuz remains closed, keeping Oil near $100 and straining New Zealand’s Oil-importing economy.
Technical Analysis: On a bearish correction, amid a broader bullish trend
NZD/USD trades at 0.5971, with price action suggesting that the pair might be on the fourth wave of a 5-wave (Elliott Wave) bullish cycle. The Relative Strength Index (RSI) is hovering around 68, after pulling back from heavily overbought levels, while the Moving Average Convergence Divergence (MACD) histogram remains positive, all in all suggesting that pullbacks are likely to find buyers.
Immediate resistance is located at the 0.5995 session high, ahead of the February 26 high, near 0.6015. Further up, the area between the 127.2% Fibonacci extension of last week’s rally, at 0.6036, and the mid-February highs around 0.6050 looks like a plausible target for a potential fifth wave.
A break below 0.5965, on the contrary, would expose the May 27 high, near 0.5915. Below here, the May 28 low, near 0.5865, would come next
New Zealand Dollar Price Today
The table below shows the percentage change of New Zealand Dollar (NZD) against listed major currencies today. New Zealand Dollar was the strongest against the Swiss Franc.
| USD | EUR | GBP | JPY | CAD | AUD | NZD | CHF | |
|---|---|---|---|---|---|---|---|---|
| USD | 0.05% | -0.08% | 0.14% | 0.04% | 0.01% | 0.30% | 0.23% | |
| EUR | -0.05% | -0.11% | 0.07% | -0.01% | 0.03% | 0.27% | 0.17% | |
| GBP | 0.08% | 0.11% | 0.19% | 0.10% | 0.07% | 0.35% | 0.27% | |
| JPY | -0.14% | -0.07% | -0.19% | -0.08% | -0.10% | 0.19% | 0.09% | |
| CAD | -0.04% | 0.00% | -0.10% | 0.08% | -0.03% | 0.26% | 0.18% | |
| AUD | -0.01% | -0.03% | -0.07% | 0.10% | 0.03% | 0.23% | 0.19% | |
| NZD | -0.30% | -0.27% | -0.35% | -0.19% | -0.26% | -0.23% | -0.08% | |
| CHF | -0.23% | -0.17% | -0.27% | -0.09% | -0.18% | -0.19% | 0.08% |
The heat map shows percentage changes of major currencies against each other. The base currency is picked from the left column, while the quote currency is picked from the top row. For example, if you pick the New Zealand Dollar from the left column and move along the horizontal line to the US Dollar, the percentage change displayed in the box will represent NZD (base)/USD (quote).

USD/JPY Price Forecast: Yen languishes amid growing BoJ rate hike uncertainty
- USD/JPY rises to near 159.45 as BoJ rate hike uncertainty weakens Japanese Yen.
- The BoJ SoP of the April meeting showed that most policymakers expressed the need to raise interest rates in the near term.
- Investors await the US NFP data for fresh cues on the Fed’s monetary policy outlook.
The USD/JPY pair trades 0.12% higher at around 159.45 during the early European trading session on Monday. The pair gains as the Japanese Yen (JPY) broadly underperforms amid uncertainty regarding whether the Bank of Japan (BoJ) will raise interest rates in the policy meeting on June 16.
Japanese Yen Price Today
The table below shows the percentage change of Japanese Yen (JPY) against listed major currencies today. Japanese Yen was the weakest against the British Pound.
| USD | EUR | GBP | JPY | CAD | AUD | NZD | CHF | |
|---|---|---|---|---|---|---|---|---|
| USD | 0.05% | -0.10% | 0.13% | 0.07% | -0.07% | 0.28% | 0.21% | |
| EUR | -0.05% | -0.14% | 0.04% | 0.02% | -0.07% | 0.24% | 0.14% | |
| GBP | 0.10% | 0.14% | 0.19% | 0.15% | 0.02% | 0.38% | 0.27% | |
| JPY | -0.13% | -0.04% | -0.19% | -0.03% | -0.18% | 0.18% | 0.08% | |
| CAD | -0.07% | -0.02% | -0.15% | 0.03% | -0.15% | 0.21% | 0.12% | |
| AUD | 0.07% | 0.07% | -0.02% | 0.18% | 0.15% | 0.30% | 0.25% | |
| NZD | -0.28% | -0.24% | -0.38% | -0.18% | -0.21% | -0.30% | -0.09% | |
| CHF | -0.21% | -0.14% | -0.27% | -0.08% | -0.12% | -0.25% | 0.09% |
The heat map shows percentage changes of major currencies against each other. The base currency is picked from the left column, while the quote currency is picked from the top row. For example, if you pick the Japanese Yen from the left column and move along the horizontal line to the US Dollar, the percentage change displayed in the box will represent JPY (base)/USD (quote).
Higher oil prices due to the Middle East crisis-led energy supply shock have raised uncertainty over the Japan’s economic outlook.
Former BoJ Deputy Governor and current member of Japan’s Council on Economic and Fiscal Policy, Masazumi Wakatabe, said last week said in a meeting that it is important to understand whether the economy can withstand tighter monetary conditions, Reuters reported.
However, the BoJ Summary of Opinions (SoP) of the April policy meeting showed that a majority of policymakers supported an interest rate hike in the near term, while warning of high inflation risks.
Meanwhile, the US Dollar (USD) trades slightly higher at the start of the United States (US) Nonfarm Payrolls (NFP) data week. Investors will closely monitor the data to get fresh cues regarding the Federal Reserve’s (Fed) monetary policy outlook. In Monday’s session, investors will focus on the US ISM Manufacturing PMI data for May, which will be published at 14:00 GMT.
USD/JPY technical analysis
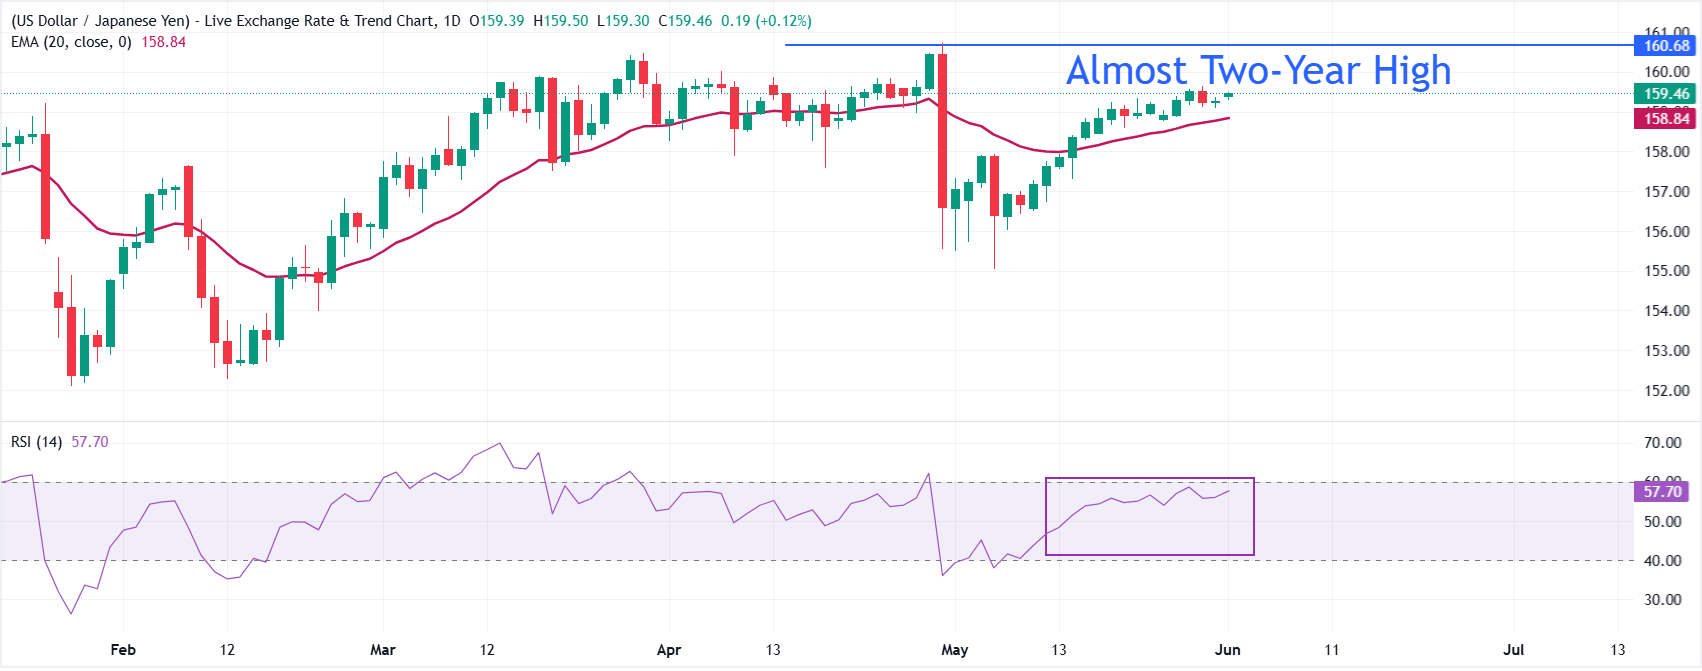
USD/JPY trades higher at around 159.45 at press time. The pair maintains a bullish near-term bias as spot holds above the 20-day Exponential Moving Average (EMA) at 158.84, keeping the recent uptrend structure intact.
The Relative Strength Index (RSI) around 58 stays in positive territory without yet signaling overbought conditions, which suggests buyers still retain the initiative while upside momentum is steady rather than stretched.
On the downside, initial support is located at the 20-day EMA near 158.84, where a daily close below would hint at a deeper corrective phase and expose lower levels on the chart towards 158.00. On the upside, the pair could advance towards an almost two-year high of 160.73 if it manages to decisively break above the May 28 high at 159.65.

EUR/JPY Price Forecast: Edges lower from upper descending channel top around 186.00
- EUR/JPY may retest the upper boundary of the descending channel around 186.00.
- The 14-day Relative Strength Index of 57 suggests upward momentum should persist.
- The primary support appears at the nine-day EMA at 185.33.
EUR/JPY steadies after six days of gains, trading around 185.70 during the Asian hours on Monday. The currency cross is maintaining a constructive bullish bias as it holds above both the nine-day and 50-day Exponential Moving Averages (EMAs).
The alignment of price over short- and medium-term moving averages hints at sustained underlying demand, while the 14-day Relative Strength Index (RSI) around 57 stays in positive territory without yet signaling overbought conditions, suggesting upside pressure could persist as long as these floors remain intact.
The technical analysis of the daily chart suggests the EUR/JPY cross is positioned near the upper boundary of the descending channel pattern around 186.00. The sustained break above the channel would indicate bullish confirmation. Further advance would support the EUR/JPY cross to explore the region around the all-time high of 187.95, recorded on April 17.
On the downside, the primary support lies at the nine-day EMA at 185.33, followed by the 50-day EMA of 184.98. A break below moving averages would revive the bearish bias and put downward pressure on the EUR/JPY cross to navigate the region around the three-month low of 181.87, recorded on March 16, followed by nearly six-month low of 180.81, reached on February 12.
Euro Price Today
The table below shows the percentage change of Euro (EUR) against listed major currencies today. Euro was the weakest against the British Pound.
| USD | EUR | GBP | JPY | CAD | AUD | NZD | CHF | |
|---|---|---|---|---|---|---|---|---|
| USD | 0.10% | -0.04% | 0.13% | 0.08% | -0.02% | 0.31% | 0.28% | |
| EUR | -0.10% | -0.12% | 0.00% | -0.02% | -0.07% | 0.23% | 0.16% | |
| GBP | 0.04% | 0.12% | 0.15% | 0.10% | -0.02% | 0.33% | 0.27% | |
| JPY | -0.13% | 0.00% | -0.15% | -0.03% | -0.13% | 0.21% | 0.14% | |
| CAD | -0.08% | 0.02% | -0.10% | 0.03% | -0.11% | 0.23% | 0.18% | |
| AUD | 0.02% | 0.07% | 0.02% | 0.13% | 0.11% | 0.28% | 0.27% | |
| NZD | -0.31% | -0.23% | -0.33% | -0.21% | -0.23% | -0.28% | -0.05% | |
| CHF | -0.28% | -0.16% | -0.27% | -0.14% | -0.18% | -0.27% | 0.05% |
The heat map shows percentage changes of major currencies against each other. The base currency is picked from the left column, while the quote currency is picked from the top row. For example, if you pick the Euro from the left column and move along the horizontal line to the US Dollar, the percentage change displayed in the box will represent EUR (base)/USD (quote).

CAD weakens as firmer USD counter recovering Oil prices
- USD/CAD gains positive traction for the second straight day amid a pickup in the USD demand.
- Geopolitical uncertainty and hawkish Fed bets continue to act as a tailwind for the Greenback.
- Rebounding Oil prices offset dismal Canadian GDP, underpinning the Loonie and capping gains.
The USD/CAD pair attracts some buyers for the second consecutive day and reclaims the 1.3800 mark during the Asian session on Monday. Spot prices, however, lack bullish conviction and remain below the highest level since April 13, near the 1.3870 region, touched last week amid a combination of diverging forces.
The uncertainty over US-Iran talks to end a three-month-old conflict and Israel’s incursion into Lebanon keeps geopolitical risk in play, underpinning the safe-haven US Dollar (USD) and acting as a tailwind for the USD/CAD pair. In fact, differences over Iran’s nuclear program and the Strait of Hormuz continue to complicate efforts to reach a deal. Moreover, Iran’s chief negotiator, Mohammad Bagher Qalibaf, stated that the country will not accept any agreement until its national rights are fully secured.
Adding to this, reports suggest that the US has hardened its negotiating position with Iran. This, along with bets that the US Federal Reserve (Fed) will hike interest rates by the end of this year, assists the USD to build on Friday’s modest bounce from a two-week low. The Canadian Dollar (CAD), on the other hand, is undermined by dismal domestic GDP figures, which showed that the economy contracted at 0.1% annualized pace in the first quarter of 2026, and further supports the USD/CAD pair.
Meanwhile, the latest development surrounding the Middle East crisis triggers a goodish recovery in Crude Oil prices, from over a one-month low touched on Friday. This, in turn, helps limit the downside for the commodity-linked Loonie and might keep a lid on any further appreciating move for the USD/CAD pair. Hence, it will be prudent to wait for strong follow-through buying before positioning for the resumption of the recent well-established uptrend witnessed over the past month or so.

EUR/USD Price Forecast: Starts the US NFP week cautiously
- EUR/USD edges down to near 1.1645 as the US Dollar trades slightly higher.
- This week, major triggers will be the flash Eurozone HICP and the US NFP data for May.
- The removal of Iran’s uranium enrichment remains the key demand by the US for a permanent peace deal.
The EUR/USD pair trades slightly lower to near 1.1645 during the Asian trading session on Monday. The major currency pair faces marginal selling pressure as the US Dollar (USD) ticks up, with investors awaiting key United States (US) economic releases this week, especially the Nonfarm Payrolls (NFP) data for May.
As of writing, the US Dollar Index (DXY), which tracks the Greenback’s value against six major currencies, trades 0.1% higher to near 99.03.
Investors will pay close attention to the US NFP data to get fresh cues on the Federal Reserve’s (Fed) monetary policy outlook. Later in the day, market participants will focus on the US ISM Manufacturing PMI data for May, which will be published at 14:00 GMT.
In the Eurozone, investors await the preliminary Harmonized Index of Consumer Prices (HICP) data for May, which will be released on Tuesday. The inflation data will influence market expectations for the European Central Bank’s (ECB) monetary policy outlook.
On the geopolitical front, negotiations between the US and Iran regarding a permanent peace deal remain ongoing, with Washington hardening its stance on Tehran destroying its uranium dust and giving up its nuclear ambitions.
EUR/USD technical analysis
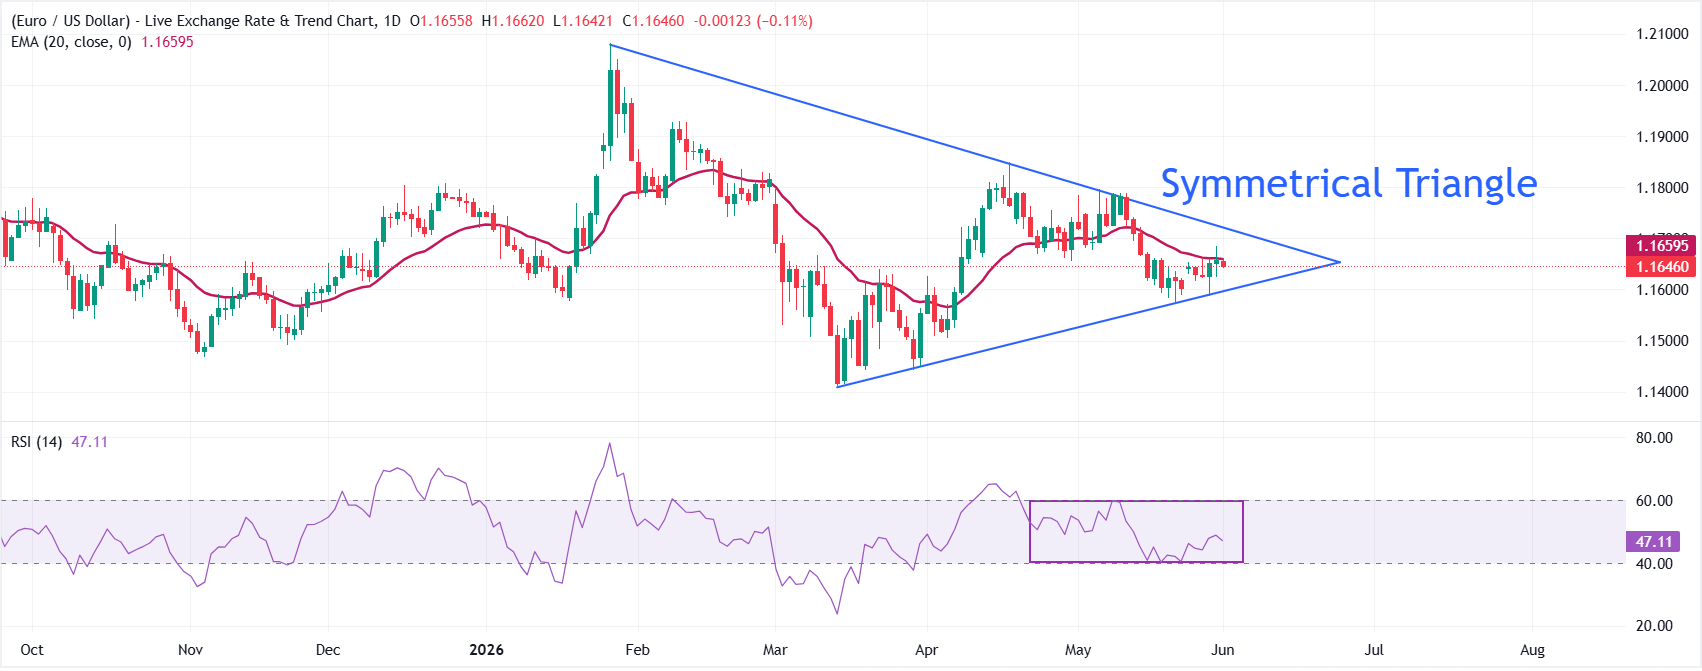
EUR/USD ticks lower at around 1.1645 in the Asian trade. The 20-day Exponential Moving Average (EMA) near 1.1646 acts as a key barrier for the Euro bulls. The pair holds just above the upward-sloping border of the Symmetrical Triangle formation near 1.1599.
The Relative Strength Index (14) has slipped to around 47, suggesting fading bullish momentum and reinforcing the idea of consolidation with a bearish lean rather than a decisive recovery.
On the topside, the 20-day EMA is the immediate resistance, followed by the downward-sloping border of the Triangle formation around 1.1719. On the downside, the first line of defense sits at the former ascending trend-line break at 1.1599; a sustained move below that support would expose a deeper pullback towards 1.1500.
RBNZ Regime Change: The Ultimate Hard-Hawk Pivot 🦅 Time to shine for NZD 🇳🇿
Governor Breman’s Ultimatum: “Sooner and by More” In the most explicit tightening signal of the current monetary cycle, RBNZ Governor Anna Breman blindsided markets by announcing that the Official Cash Rate (OCR) is highly likely to rise sooner and by a larger magnitude than the central bank had previously forecasted This is not a gentle directional hint – it is unambiguous, hard forward guidance that signals an operational regime shift. The RBNZ has effectively declared that it will prioritize its price stability mandate at any cost, effectively telling the market it is prepared to hike interest rates directly through economic weakness. Today’s hawkish statement triggered the undisputed dominance of the New Zealand Dollar across global forex markets. However, explicit forward guidance is a hallmark of Breman’s RBNZ. Since the market is quickly pricing in this aggressive new policy path, the bulk of the fundamental tailwind may already be absorbed, potentially limiting further structural upside for the NZD from here.
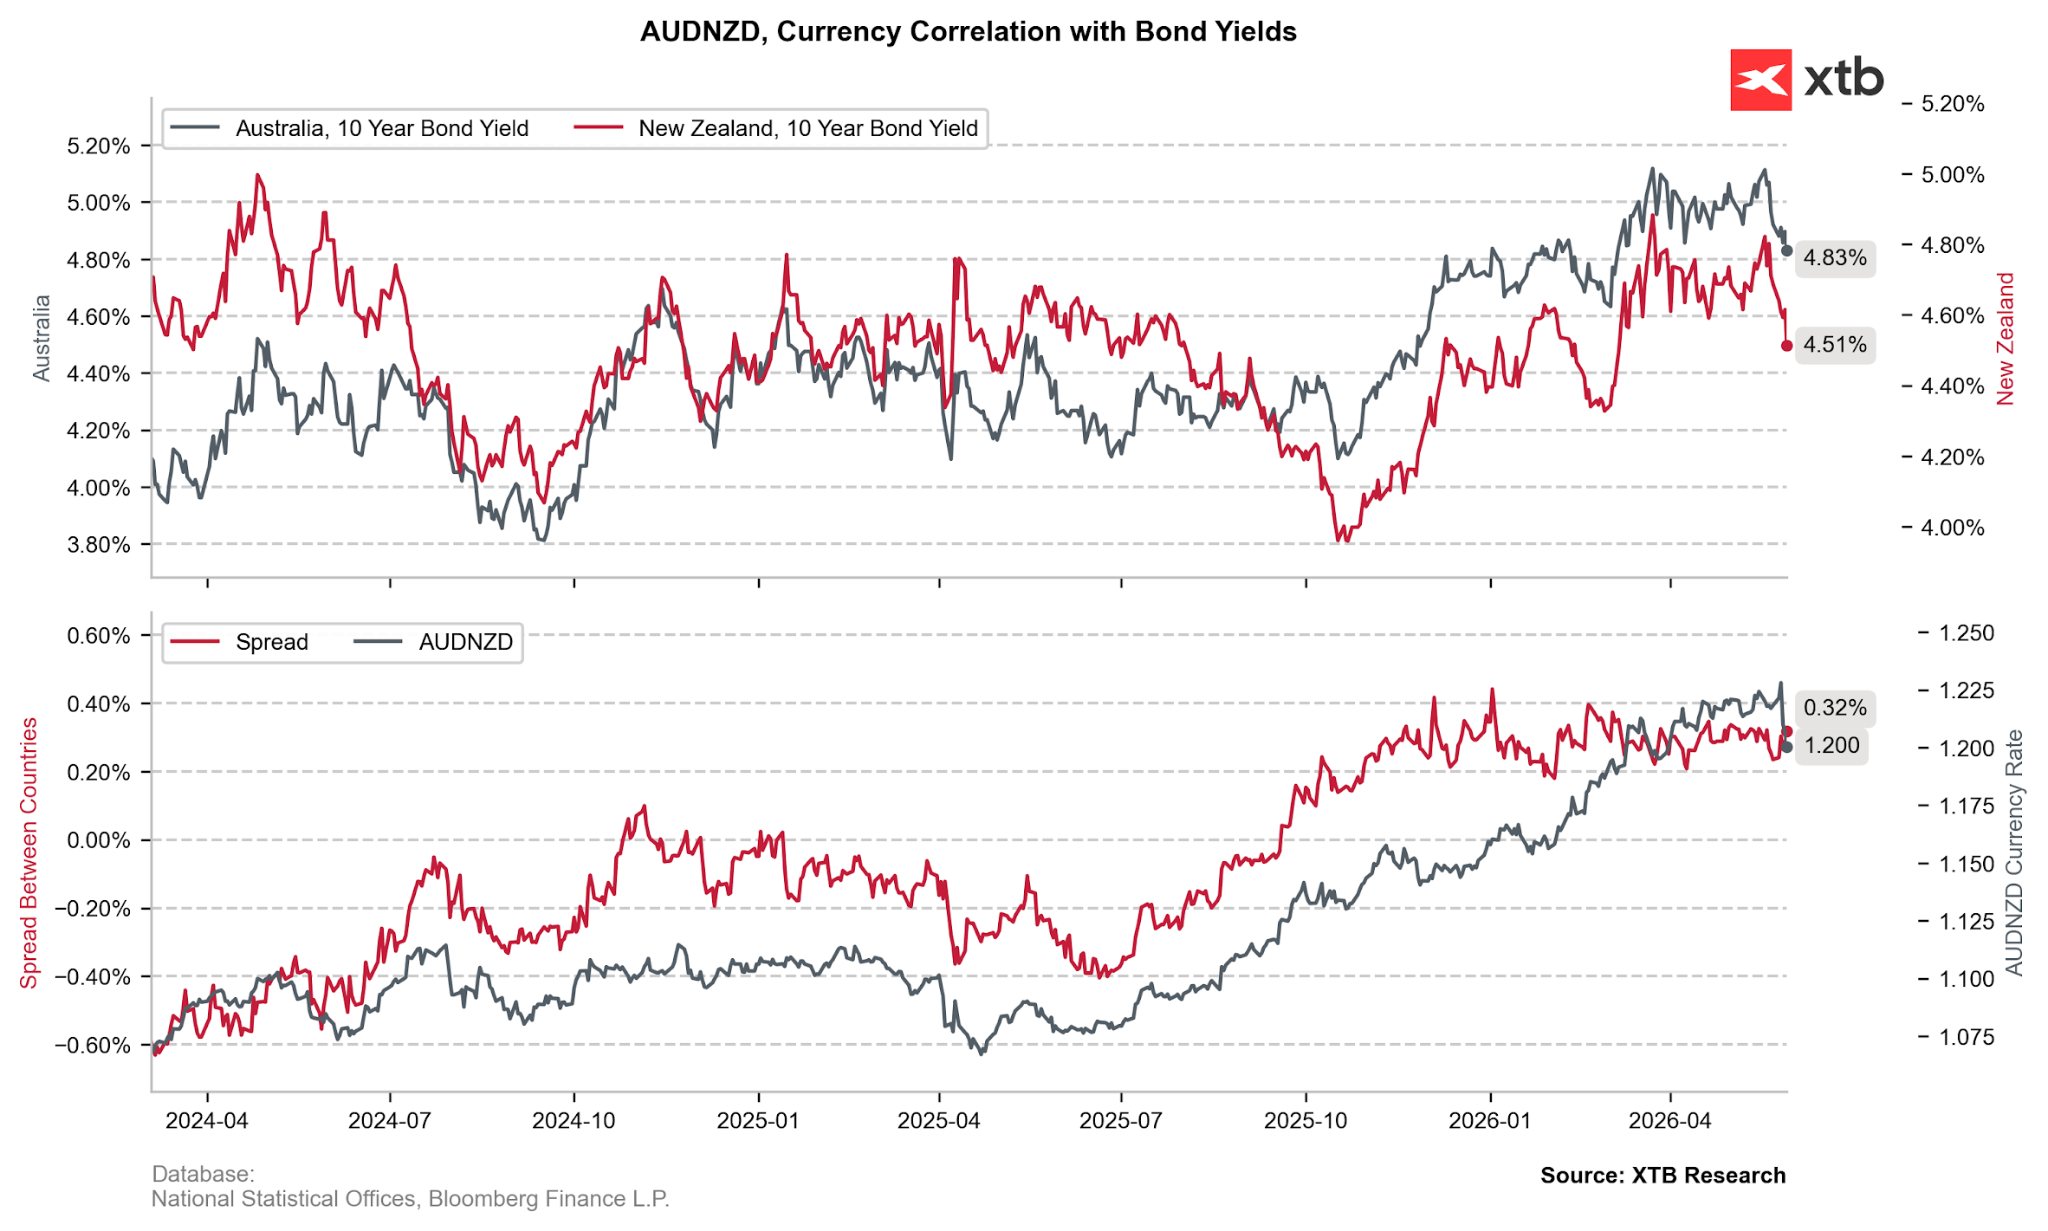
The abrupt sell-off of AUDNZD is the cleanest market demonstration of the RBNZ’s pivot. The pair lost 2.15% in just three sessions, reinforcing the correlation with the recently flat 10Y bond yield spread. Source: XTB Research The Stagflationary Catalyst: Middle East Conflict & Global Costs The justification for this aggressive posture stems from a deeply uncertain global macroeconomic environment. The RBNZ notes that New Zealand will not be insulated from international supply chain shocks:
- The Conflict Pulse: The ongoing Middle East conflict is simultaneously driving an inflation spike while choking economic growth across New Zealand and its primary trading partners.
- Supply Chain Degradation: Persistent supply chain disruptions and escalating input costs are bearing down heavily on the near-term economic outlook.
- Sacrificing Growth for Stability: For global macro investors, the message is transparent: the RBNZ has officially chosen its battle. It views a bloated, inflation-entrenched economy as a far greater threat than a technical recession. Expect aggressive tightening regardless of cooling activity data.
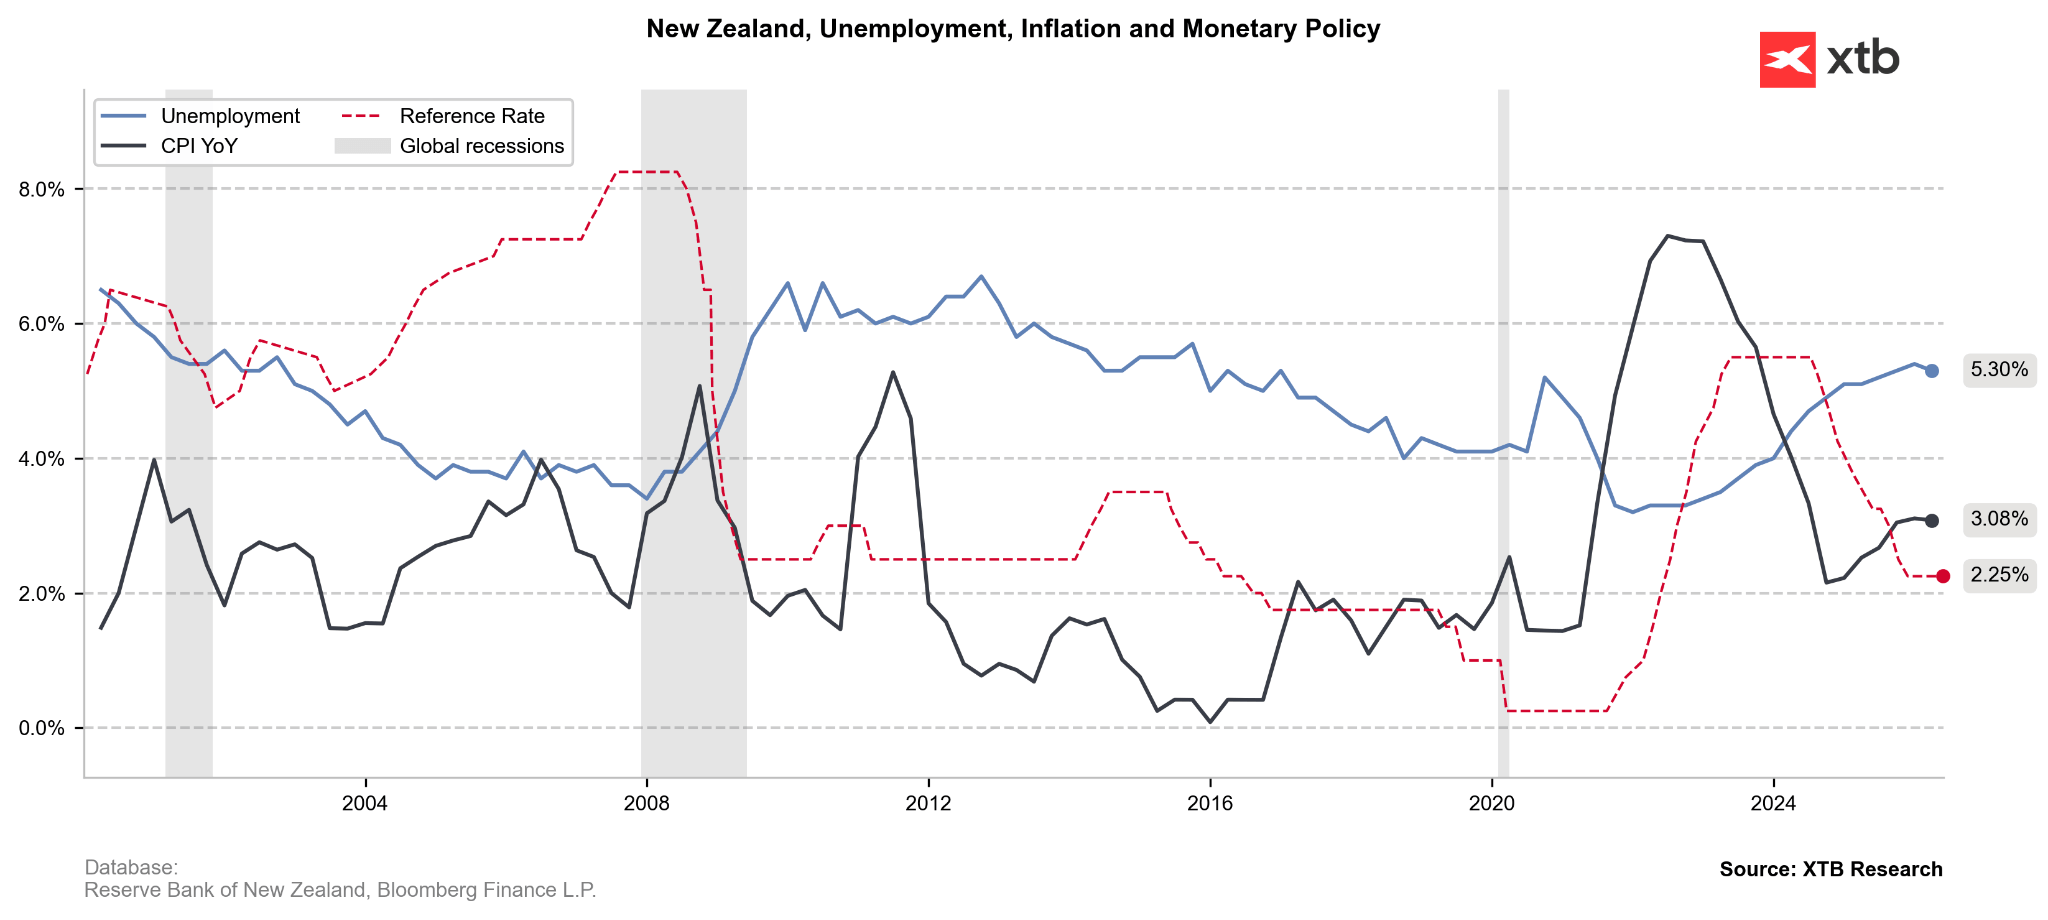
The elevated unemployment (5.3%) rate has been somewhat shielding the NZ’s economy from the risk of wage-induced inflationary spiral. Explicit inflation-focused policy guidance mitigates this dovish argument, justifying the newly discovered strength in NZD. Source: XTB Research The Psychology of Inflation: Unanchored Expectations Perhaps the most alarming component of Breman’s address was the explicit focus on the psychological dynamics of inflation: Expectations of higher costs could themselves become a driver of sustained inflation, creating a self-reinforcing dynamic that monetary policy must move to arrest before it becomes entrenched. — Anna Breman, RBNZ Governor This focus on psychology gives the RBNZ explicit air cover to hike rates even as domestic growth data softens. The hard data supports this anxiety: the latest ANZ-Roy Morgan consumer confidence survey revealed that two-year inflation expectations are sitting at a historically elevated 5.3% in May (down from a record 6.6% in April, but still far too high for central bank comfort)
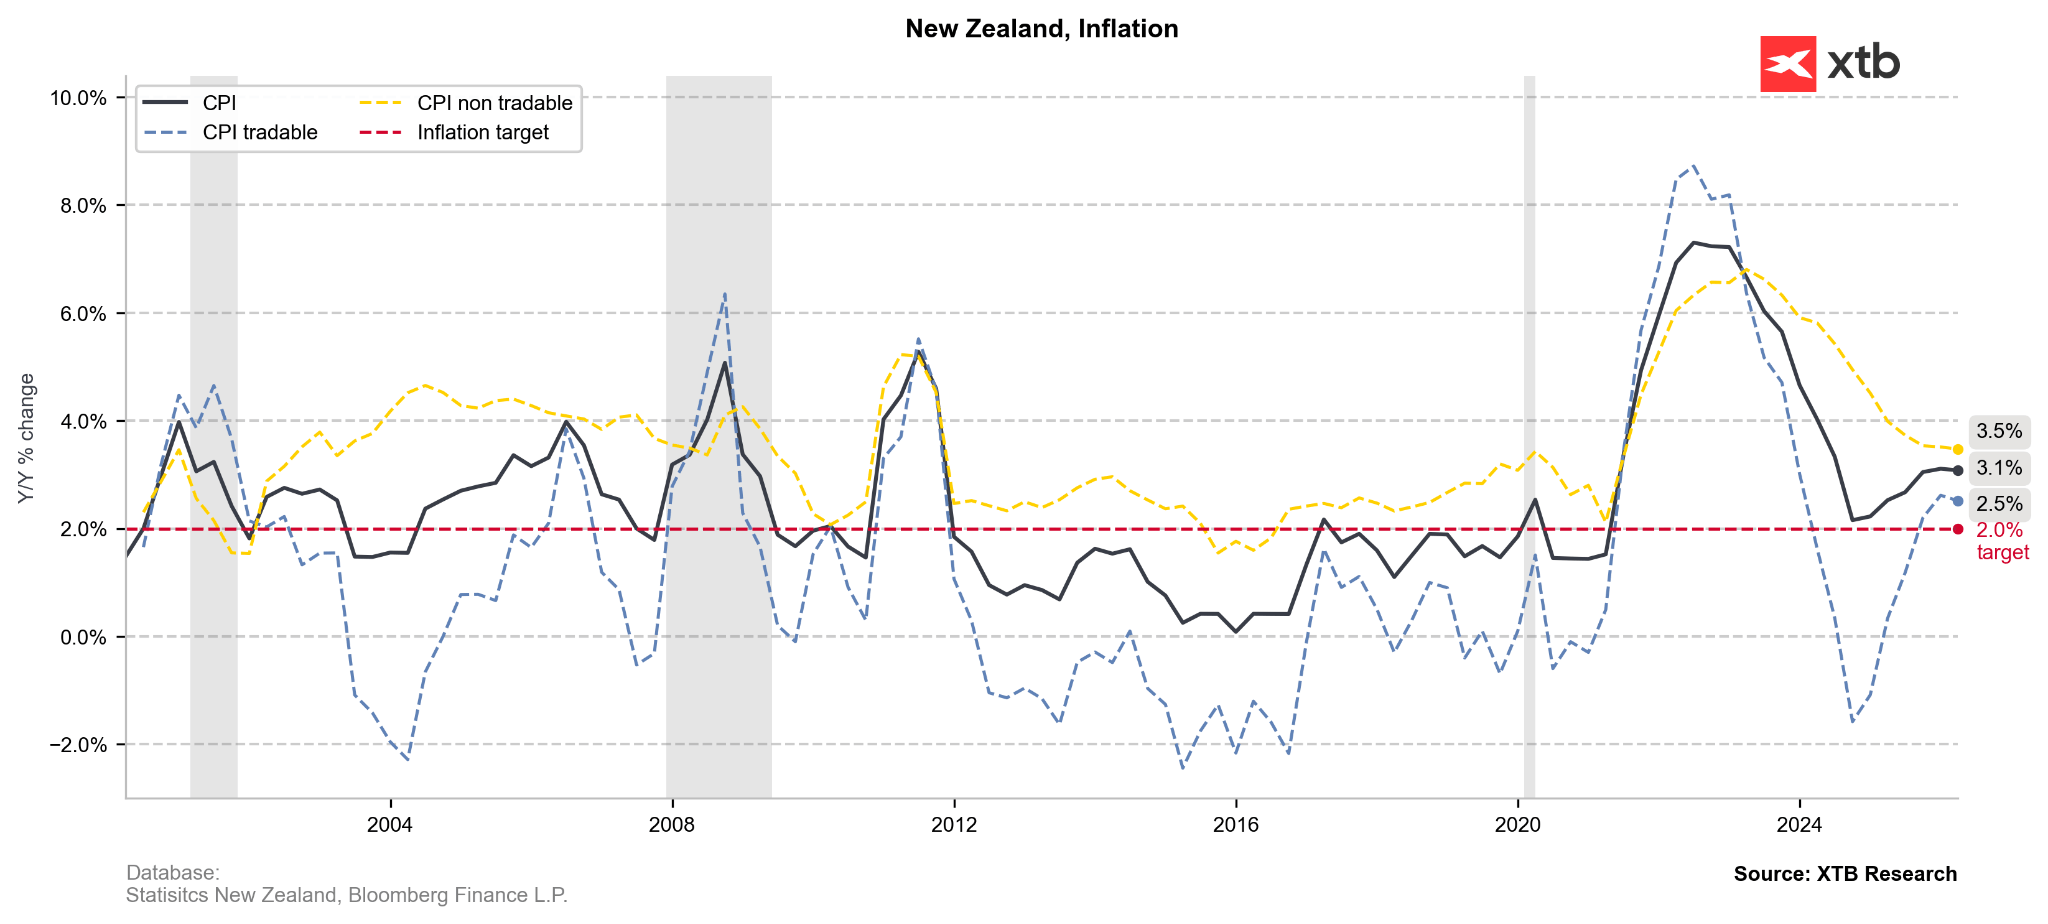
The jump in tradable goods inflation (blue) has mitigated the easing in the non-tradable goods sector, bucking the overall disinflationary process in NZ. With post-war stagflationary pressures, higher commodity prices and NZD-adverse risk sentiment, the hawkish pivot seems like a timely reaction aimed at anchoring inflationary expectations. Source: XTB Research. Laying the Groundwork: The Silk-ANZ Consensus Governor Breman’s Friday remarks represent the final brick in a hawkish wall that RBNZ officials built throughout the week:
- Assistant Governor Karen Silk (Thursday): Confirmed that the central bank’s core bias is firmly tilted toward rate increases at upcoming meetings, explicitly stating that July is a live decision. Crucially, Silk noted that the Fed-adjacent bank does not need to wait for quarterly CPI prints before pulling the trigger, and a swift end to geopolitical tensions will not undo the inflationary damage already baked into the system.
- Institutional Projections: Wall Street and local desks were already positioning for this shift. ANZ Research had previously flagged a sequence of RBNZ rate hikes beginning as early as July, targeting an aggressive return toward a neutral OCR setting of approximately 3%.
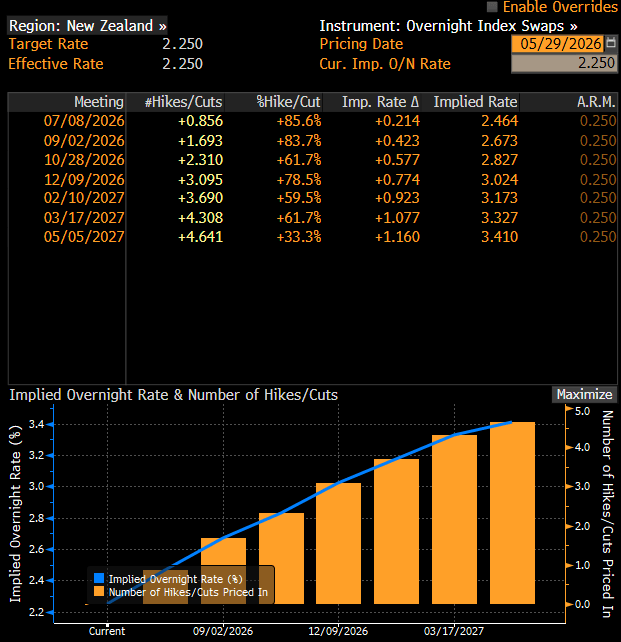
Swap markets are already pricing in three full interest rate hikes in NZ by the end of 2026, which would bring the OCR back to 3%. Source: Bloomberg Finance LP NZDUSD (D1) NZDUSD is testing a crucial historical resistance zone (yellow box) near 0.5980–0.6000, reinforced by the 78.6% Fibonacci retracement level. The dynamic rally triggered by the hawkish RBNZ has pushed price action above the 10, 30, and 100 EMAs, confirming strong bullish momentum. While the RSI at 62.7 reflects dominant buying pressure, it leaves room for further upside. A sustained break above 0.6000 targets prior highs; failure risks a correction back toward the 30 EMA at 0.5885.
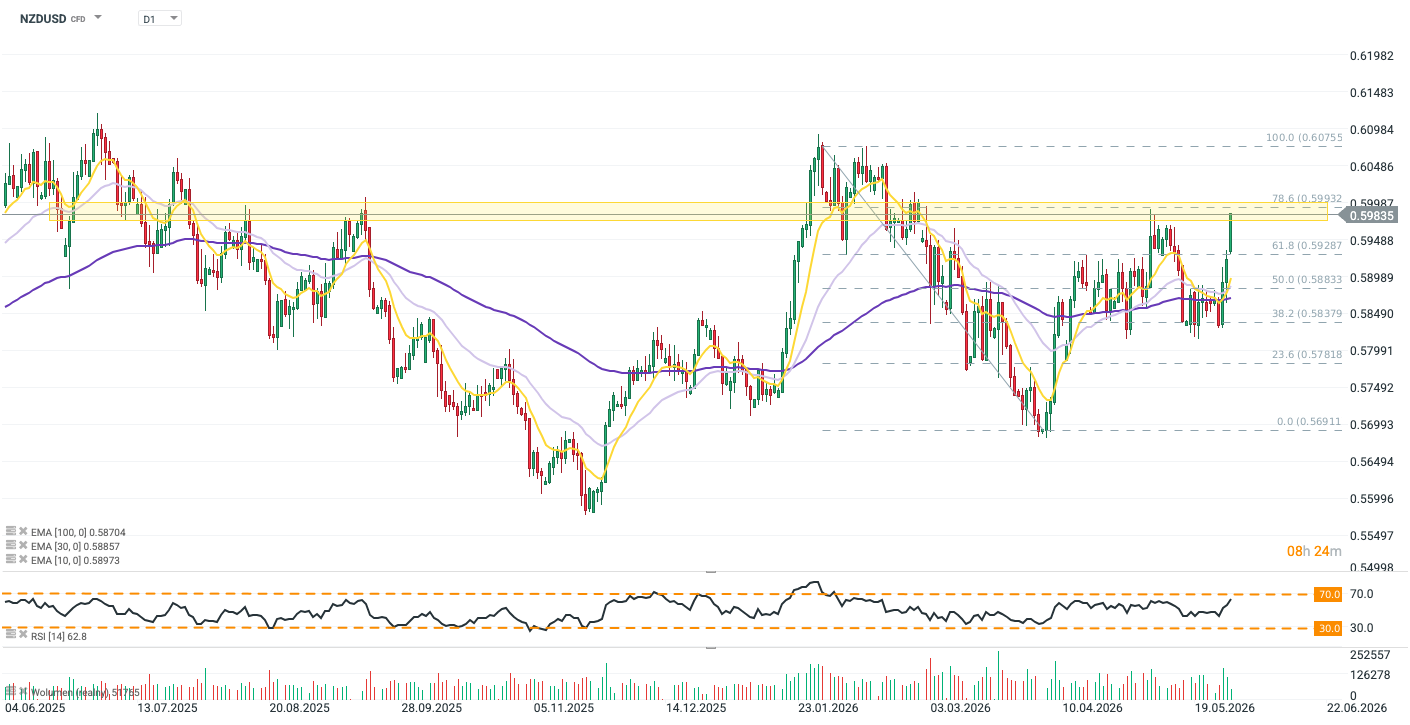
Chart of The Day – EUR/USD Awaits Germany CPI Reacting to Possible ECB Policy Change
g toward EURUSD. If the ECB ultimately decides to raise rates, the euro could benefit in the short term, although the central bank would risk further weakening economic activity in exchange for making additional progress in the fight against inflation. On the other hand, a decision to leave rates unchanged—despite markets being almost fully convinced of a hike—could weigh on the euro and pressure EURUSD, which is currently trading within an interesting technical formation.
Technical Analysis (D1 Timeframe)
On the daily chart, EURUSD remains trapped within a medium-term symmetrical triangle , a consolidation pattern that has been developing since March. The pair is now trading very close to the apex of the formation, suggesting that a breakout and a stronger directional move may be approaching. Price is currently oscillating around the 50-day EMA (1.1695) and the 200-day EMA (1.1670) . The two moving averages are trading very close to each other, confirming the lack of a clear trend and highlighting the market’s transition into a balanced, range-bound environment. EURUSD remains slightly below the 50-day EMA but above the 200-day EMA, maintaining a broadly neutral technical setup. The upper boundary of the triangle is currently located around 1.1680–1.1700 , while key support can be found near 1.1630–1.1650 . The market has respected both boundaries multiple times, with April and May highs repeatedly stalling near resistance and March and May lows establishing a rising support line. From a technical perspective, breakouts from symmetrical triangles often lead to sharp directional moves, particularly when they occur close to the apex of the pattern. MACD and RSI The MACD remains below the zero line, although the histogram is clearly reducing its negative readings. This suggests:
- Fading bearish momentum,
- The potential emergence of a bullish signal if the MACD line crosses above the signal line.
While this is not yet a definitive buy signal, selling pressure appears to be weakening. Meanwhile, the RSI is hovering around 48 , almost exactly at neutral territory. This leaves room for both an upside breakout and a downside move without indicating either overbought or oversold conditions. Key Levels to Watch Support:
- 1.1640–1.1650 (lower boundary of the triangle)
- 1.1600
- 1.1540
Resistance:
- 1.1680–1.1700 (upper boundary of the triangle)
- 1.1760
- 1.1820–1.1850
Bullish Scenario
A break above 1.1700 accompanied by a daily close above the upper boundary of the triangle would represent the first major signal of renewed bullish momentum. In such a scenario, EURUSD could initially target the 1.1760 area before potentially retesting April highs near 1.1820–1.1850 . Bearish Scenario If the pair fails to overcome resistance and instead breaks below support around 1.1640 , the risk of a move toward 1.1600 and subsequently 1.1540 would increase significantly. Such a breakout would also be supported by the MACD remaining below the zero line.
Conclusion
From a technical standpoint, EURUSD is currently at an equilibrium point. The most important feature on the chart remains the narrowing symmetrical triangle, which points to an approaching breakout. As long as the pair remains trapped between 1.1640 and 1.1700 , neither bulls nor bears have a clear advantage. However, the gradual fading of bearish momentum on the MACD slightly increases the probability of an upside breakout attempt in the coming sessions.
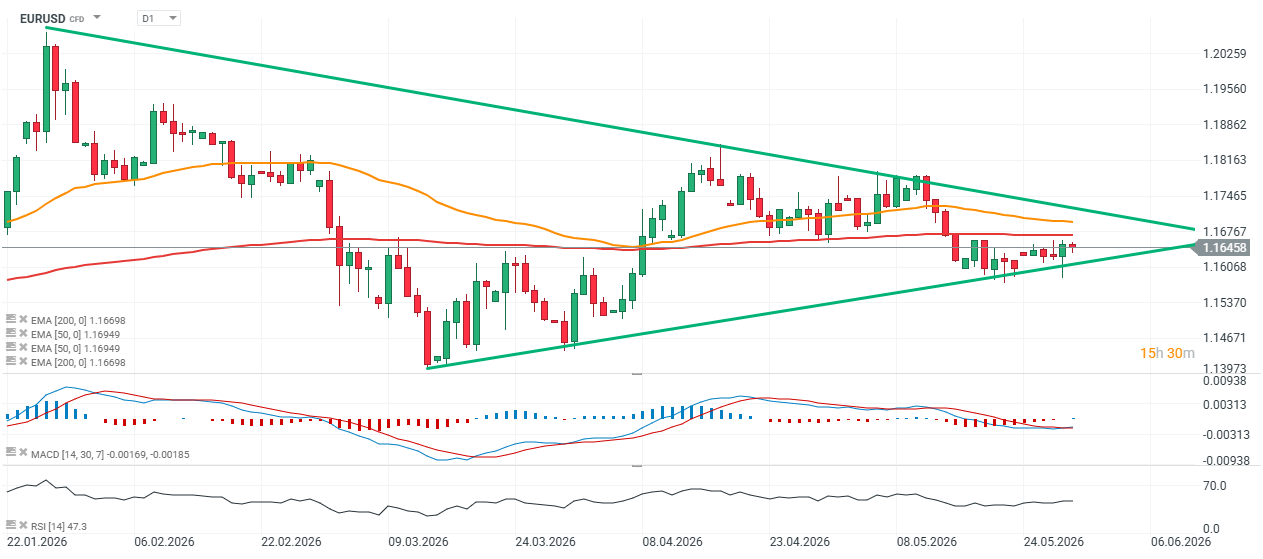
Source: xStation5
The material on this page does not constitute financial advice and does not take into account your level of understanding, investment objectives, financial situation or any other specific needs. All information provided, including opinions, market research, mathematical results and technical analyzes published on the Website or transmitted To you by other means, it is provided for information purposes only and should in no way be construed as an offer or solicitation for a transaction in any financial instrument, nor should the information provided be construed as advice of a legal or financial nature on which any investment decisions you make should be based exclusively To your level of understanding, investment objectives, financial situation, or other specific needs, any decision to act on the information published on the Website or sent to you by other means is entirely at your own risk if you In doubt or unsure about your understanding of a particular product, instrument, service or transaction, you should seek professional or legal advice before trading. Investing in CFDs carries a high level of risk, as they are leveraged products and have small movements Often the market can result in much larger movements in the value of your investment, and this can work against you or in your favor. Please ensure you fully understand the risks involved, taking into account investments objectives and level of experience, before trading and, if necessary, seek independent advice.
