EUR/USD may test the primary resistance at the nine-day EMA of 1.1730
The 14-day Relative Strength Index is near 50, indicating a lack of strong direction.
The lower ascending channel boundary is acting as immediate support, near the 50-day EMA at 1.1697.
EUR/USD inches higher after three days of losses, trading around 1.1710 during the Asian hours on Thursday. The daily chart technical analysis indicates a potential for a bearish reversal as the pair is positioned on the lower boundary of the ascending channel pattern.
The EUR/USD pair is holding just above the 50-day Exponential Moving average (EMA) but still capped by the nine-day EMA, which keeps the near-term tone broadly neutral with a slight bullish tilt. The price hovering between these averages suggests consolidation after recent gains, while the 14-day Relative Strength Index (RSI) around 50 hints at balanced momentum rather than a strongly directional move.
On the upside, the primary barrier lies at the nine-day EMA of 1.1730, followed by the 12-week high of 1.1849, reached on April 17. A break above this level would support the pair to test the upper boundary of the ascending channel around 1.2040. Further advances above the channel would lead the pair to explore the region around 1.2082, the highest since June 2021, reached on January 27.
The EUR/USD pair is positioned on the lower ascending channel boundary, aligned with the 50-day EMA at 1.1697. Further declines will put downward pressure on the pair to navigate the region around the nine-month low of 1.1411, recorded on March 13.
EUR/USD: Daily Chart
(The technical analysis of this story was written with the help of an AI tool.)
Euro Price Today
The table below shows the percentage change of Euro (EUR) against listed major currencies today. Euro was the strongest against the New Zealand Dollar.
USD
EUR
GBP
JPY
CAD
AUD
NZD
CHF
USD
-0.04%
-0.05%
-0.03%
-0.01%
0.02%
0.06%
-0.06%
EUR
0.04%
-0.03%
0.00%
0.03%
0.00%
0.06%
-0.02%
GBP
0.05%
0.03%
0.02%
0.06%
0.06%
0.09%
0.03%
JPY
0.03%
0.00%
-0.02%
-0.01%
0.03%
0.06%
-0.05%
CAD
0.01%
-0.03%
-0.06%
0.00%
0.04%
0.06%
0.00%
AUD
-0.02%
0.00%
-0.06%
-0.03%
-0.04%
0.05%
-0.00%
NZD
-0.06%
-0.06%
-0.09%
-0.06%
-0.06%
-0.05%
-0.07%
CHF
0.06%
0.02%
-0.03%
0.05%
-0.00%
0.00%
0.07%
The heat map shows percentage changes of major currencies against each other. The base currency is picked from the left column, while the quote currency is picked from the top row. For example, if you pick the Euro from the left column and move along the horizontal line to the US Dollar, the percentage change displayed in the box will represent EUR (base)/USD (quote).
GBP/USD trades with mild gains near 1.3550 in Wednesdayโs early European session.
The positive outlook of the pair remains intact above the key 100-day EMA.
The immediate resistance level is seen at 1.3630; the initial support level is located at 1.3540.
The GBP/USD pair trades on a positive note around 1.3550 during the early European trading hours on Wednesday. Nonetheless, the potential upside for the major pair might be limited, as UK political turmoil and ongoing tensions in the Middle East could weigh on the British Pound (GBP) against the Greenback.
UK Prime Minister Keir Starmer is facing rising pressure to set a date for his departure after elections across much of the country resulted in massive losses for his ruling Labour Party. While Starmer stated he will not resign, the resulting political “noise” and rising UK gilt yields have created localized pressure on the GBP.
Traders will closely watch the US Producer Price Index (PPI) report, which is due later on Wednesday. Markets expect the US PPI inflation to rise to 4.9% YoY in April from 4.0% in March. The core PPI, excluding volatile food and energy prices, is expected to show a rise of 4.3% YoY in April versus 3.8% prior. If the report shows a hotter-than-expected outcome, this could boost the US Dollar (USD) and create a headwind for the major pair.
Technical Analysis:
In the daily chart, GBP/USD holds a mild bullish bias as spot remains above the 20-day Bollinger simple moving average (SMA) and comfortably over the 100-day SMA, suggesting underlying dip-buying interest. The Relative Strength Index (RSI) hovers close to the mid-50s, hinting at steady rather than overstretched upside momentum while price grinds higher within the Bollinger envelope.
On the topside, immediate resistance emerges at the upper Bollinger band near 1.3630, where recent rallies could stall if buyers fail to extend the breakout. On the downside, initial support is seen at the 20-day Bollinger SMA around 1.3540, followed by the 100-day SMA at roughly 1.3483; a deeper pullback would then look to the lower Bollinger band near 1.3458 as a stronger floor.
EUR/USD struggles to gain any meaningful traction as a combination of factors supports the USD.
Fed rate hike bets and rising US-Iran tensions underpin the buck, capping the upside for the pair.
The technical setup warrants some caution for bearish traders and positioning for deeper losses.
The EUR/USD pair is seen consolidating the previous day’s heavy losses and oscillating in a narrow band, below mid-1.1700s, during the Asian session on Wednesday. Traders now seem hesitant and opt to move to the sidelines ahead of a meeting between US President Donald Trump and his Chinese counterpart, Xi Jinping.
In the meantime, hotter-than-expected US consumer inflation figures released on Tuesday lifted market bets for an interest rate hike by the US Federal Reserve (Fed) in 2026. Apart from this, the diminishing odds for a US-Iran peace deal, amid disagreements over Tehran’s nuclear program and the Strait of Hormuz, continue to underpin the US Dollar (USD) and act as a headwind for the EUR/USD pair.
From a technical perspective, the recent move up witnessed over the past two weeks or so has been along an upward-sloping channel. Moreover, spot prices hold above the 200-period Simple Moving Average (SMA) on the 4-hour chart, maintaining a modestly constructive near-term tone despite softening momentum.
Meanwhile, the Relative Strength Index (RSI) has eased towards the mid-40s, while the Moving Average Convergence Divergence (MACD) has slipped slightly below zero with the histogram turning negative. This hints that upside traction is losing strength even as the EUR/USD pair stays supported by its underlying trend structure.
That said, it will still be prudent to wait for a sustained break below the ascending channel support near the 1.1715 region and the 200-period SMA at 1.1692 before positioning for further losses. Acceptance below the latter would weaken the EUR/USD pair’s current constructive bias and expose deeper retracements within the broader range.
On the topside, initial resistance is aligned with the upper boundary of the parallel channel around 1.1830. A convincing breakout through the said barrier would open the way for a more decisive bullish extension.
(The technical analysis of this story was written with the help of an AI tool.)
EUR/USD 4-hour chart
US Dollar Price This week
The table below shows the percentage change of US Dollar (USD) against listed major currencies this week. US Dollar was the strongest against the Japanese Yen.
USD
EUR
GBP
JPY
CAD
AUD
NZD
CHF
USD
0.12%
0.16%
0.69%
0.11%
-0.15%
-0.03%
0.35%
EUR
-0.12%
0.03%
0.65%
-0.03%
-0.29%
-0.20%
0.21%
GBP
-0.16%
-0.03%
0.11%
-0.05%
-0.34%
-0.21%
0.17%
JPY
-0.69%
-0.65%
-0.11%
-0.64%
-0.86%
-0.73%
-0.30%
CAD
-0.11%
0.03%
0.05%
0.64%
-0.17%
-0.09%
0.22%
AUD
0.15%
0.29%
0.34%
0.86%
0.17%
0.12%
0.51%
NZD
0.03%
0.20%
0.21%
0.73%
0.09%
-0.12%
0.36%
CHF
-0.35%
-0.21%
-0.17%
0.30%
-0.22%
-0.51%
-0.36%
The heat map shows percentage changes of major currencies against each other. The base currency is picked from the left column, while the quote currency is picked from the top row. For example, if you pick the US Dollar from the left column and move along the horizontal line to the Japanese Yen, the percentage change displayed in the box will represent USD (base)/JPY (quote).
The US Consumer Price Index is expected to rise 3.7% YoY in April as energy prices remain persistently high.
Annual core CPI inflation is expected to edge slightly higher to 2.7%.
EUR/USDโs technical outlook highlights a bullish stance that lacks momentum.
The US Bureau of Labor Statistics (BLS) will publish the April Consumer Price Index (CPI) data on Tuesday. The report is expected to show another significant leap in consumer inflation after Marchโs sharp increase, driven by the elevated Oil prices due to the ongoing conflict between the United States (US) and Iran.
The monthly CPI is forecast to rise 0.6%, following the 0.9% increase recorded in March, while the annual reading is seen climbing to its highest level since September 2023 at 3.7%, from 3.3% in March. Core CPI figures, which exclude volatile food and energy prices, are expected to come in at 0.4% and 2.7%, on a monthly and yearly basis, respectively.
From the beginning of the conflict in the Middle East on February 28 to the end of April, the barrel of West Texas Intermediate (WTI) rose more than 50%. Although crude Oil prices corrected lower in the first week of May, they are still about 40% above where they were before the US-Iran war.
Previewing the inflation data, “our economists expect headline inflation to rise by +0.58% month-on-month, moderating from Marchโs +0.9%, but still relatively firm,โ said Deutsche Bankโs Jim Reid.
“In contrast, the core measure is projected to accelerate to +0.39% MoM from +0.2%, suggesting underlying price pressures remain sticky even as energy-related effects fade. The YoY rates would move from 3.3% to 3.8% for the former and from 2.6% to 2.8% for the latter,โ Reid added.
What to expect in the next CPI data report?
CPI figures for April will reflect the impact of persistently high Oil prices on inflation. Since this is largely anticipated, core inflation figures will help markets gauge whether rising energy costs are spilling over into the broader economy and driving up the prices of other goods and services.
A reading above the market expectation of 0.4% in the monthly core CPI could feed into concerns over high inflation getting entrenched in the economy. Conversely, a print below analystsโ forecast could ease fears over prices getting out of control. Still, even in this latter scenario, investors are unlikely to breathe a sigh of relief because the US-Iran crisis remains unresolved and the lack of naval activity in the Strait of Hormuz continues to pose a significant risk to global energy supply chains.
Minneapolis Federal Reserve (Fed) President Neel Kashkari said the price shock from a prolonged closure of the strait could put inflation expectations at risk and requires a strong policy response. Similarly, St. Louis Fed President Alberto Musalem noted that inflation is meaningfully above the Fedโs target and added that policymakers need to worry about the underlying inflation, along with tariff and Oil shocks.
How could the US Consumer Price Index report affect EUR/USD?
Markets currently see about a 73% chance of the Fed leaving the policy rate unchanged at 3.5%-3.75% by the end of the year, and price in about a 20% probability of a 25 basis points (bps) hike, according to the CME FedWatch Tool.
Source: CME Group
A stronger-than-forecast monthly core CPI print for April could cause investors to lean toward a rate hike later in the year. In this scenario, the US Dollar (USD) could gather strength with the immediate reaction.
On the other hand, a soft core CPI print could have the opposite effect on the USDโs valuation. However, unless there are any significant developments hinting at the US-Iran conflict coming to an end soon, any negative impact on the USD could remain short-lived.
“Investors will be on heightened alert for the possibility of further delays to the first rate cut โ or even an inability to ease in 2H26 altogether โ should energy prices rise sharply and persistently due to an escalation or prolongation of the Middle East conflict,โ UOB Groupโs Alvin Liew explains.
โA broader oil-related price spillover across the CPI basket would materially complicate the inflation outlook, raising the risk that the anticipated year-end cut is pushed into 2027,โ Liew elaborates.
Eren Sengezer, FXStreet European Session Lead Analyst, shares a brief technical outlook for EUR/USD.
โEUR/USDโs near-term technical outlook points to a bullish stance that lacks strength. The Relative Strength Index (RSI) indicator on the daily chart holds above 50 but retreats after testing 60, and the pair struggles to pull away from the 20-day Simple Moving Average (SMA) despite closing well above it to end the previous week.โ
โOn the upside, the first resistance area aligns at 1.1800-1.1820, where the upper limit of the Bollinger Band and the Fibonacci 61.8% retracement of the February-April downtrend align. In case EUR/USD manages to stabilize above this region, 1.1900-1.1910 (round level, Fibonacci 78.6% retracement) could be seen as the next hurdle ahead of 1.2000 (psychological level).โ
Looking south, a strong support area seems to have formed at 1.1730-1.1680 (Fibonacci 50% retracement, 100-day SMA, 200-day SMA). If EUR/USD drops below the lower limit of this range and starts using it as resistance, technical sellers could take action. In this case, 1.1660 (ascending trend line) could be seen as an interim support level before 1.1560 (Fibonacci 23.6% retracement).โ
EUR/JPY rises as the Japanese Yen weakens following disappointing Japanese household spending data and shrinking consumer demand.
The BoJ Summary shows some members favor rate hikes while others urge caution regarding Middle East instability.
The Euro gains ground as hawkish ECB rhetoric fuels expectations for continued interest rate hikes through June.
EUR/JPY extends its gains for the fourth successive day, trading around 185.40 during the Asian hours on Tuesday. The currency cross appreciates as the Japanese Yen (JPY) struggles following the disappointing release of Japan’s Household Spending data.
Japanโs economic outlook faced renewed pressure on Tuesday after the internal affairs ministry reported a significant 2.9% year-over-year drop in consumer spending for March. This steeper-than-expected decline marks the fourth consecutive month of shrinking personal expenditures, as persistent inflationary pressures continue to erode household purchasing power. The data underscores a fragile domestic recovery, further complicated by growing global economic anxiety stemming from the escalating tensions between the United States and Iran.
Inside the Bank of Japan (BoJ), policymakers appear to be navigating a complex path toward normalization. The Summary of Opinions from the April meeting revealed that while some members believe real interest rates are low enough to support further hikes, others remain wary of the unpredictable Middle East situation. Despite these geopolitical uncertainties, the consensus suggests that a rate hike remains likely as early as the next meeting. This hawkish tilt was complemented by diplomatic efforts, as Finance Minister Satsuki Katayama reaffirmed close cooperation on currency stability with US Treasury Secretary Scott Bessent.
Meanwhile, the EUR/JPY cross continues to gain traction, bolstered by a resilient Euro (EUR) and a decisively hawkish European Central Bank (ECB). Governing Council member Martin Kocher emphasized that the bank will not hesitate to push forward with interest rate hikes if energy prices remain elevated. With financial markets now pricing in a 92% probability of a rate hike in June and anticipating three total increases by 2026, the widening policy divergence between the ECB and the BoJ is providing a steady tailwind for the pair.
Japanโs Finance Minister Satsuki Katayama said that Japan and the United States (US) reaffirmed their โclose cooperation on currency moves after a meeting with US Treasury Secretary Scott Bessent, Reuters reported on Tuesday.
Key quotes
Reaffirmed close cooperation on joint statement from last year.
Discussed wide global cooperation on crucial mineral supply chains.
Two countries in close contact, will continue to coordinate closely with Bessent.
Will not discuss BoJ’s particular monetary policy tools.
China may close gap in high-tech sectors within six months to a year, but not currently.
Trust us, Japan is aligned in managing critical mineral supply chain.
Discussions on currency coordination with US have intensified.
No talks with Bessent on Tokyo’s fiscal policy.
Unable to disclose if monetary policy talks occurred.
Comfortable with economic panel suggestion that BoJ consider firms’ financing circumstances.
We have not yet stepped into oil futures market.
Hard to forecast June outlook, declines to comment on possibility of BoJ rate hike in June.
Market reaction
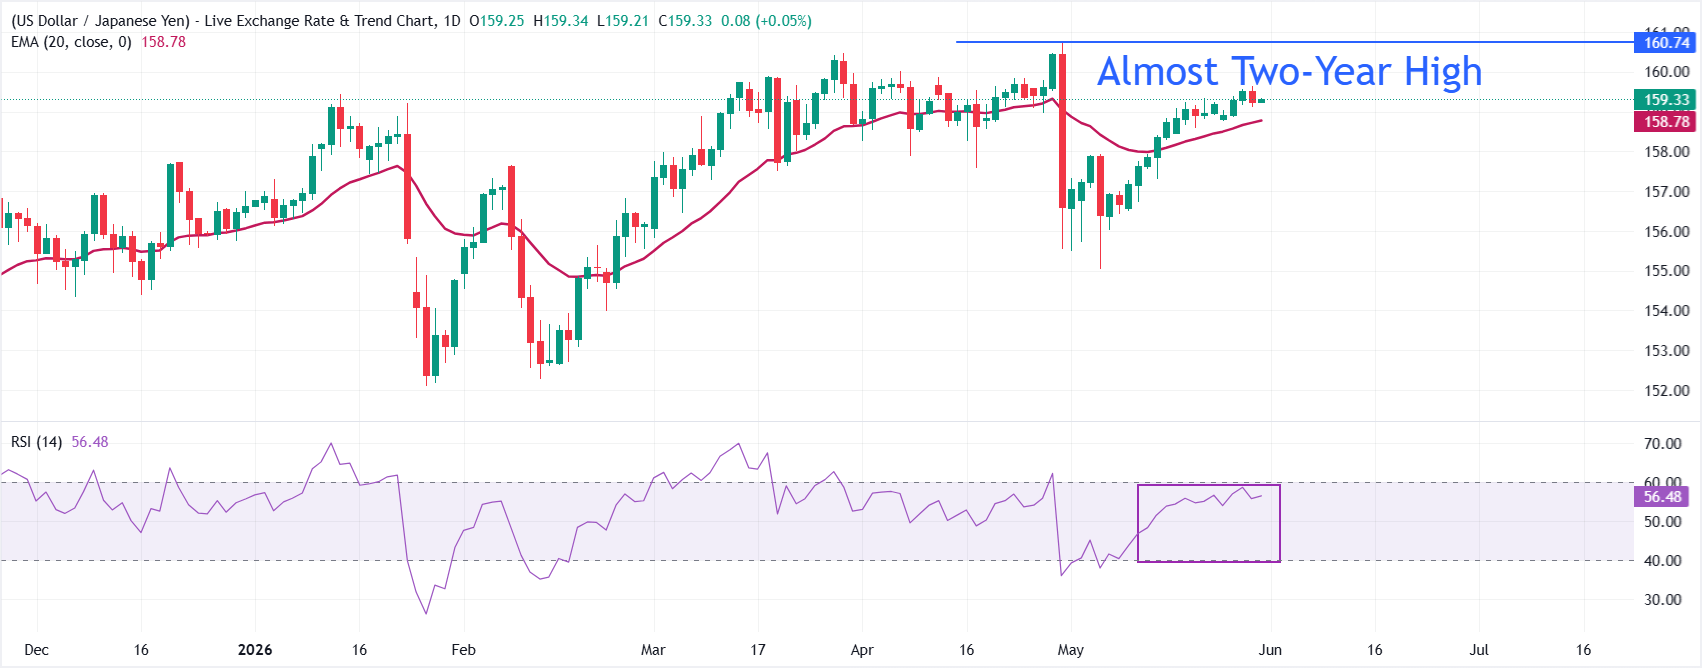
As of writing, the USD/JPY pair is up 0.22% on the day at 157.50.
Societe Generale analysts observe USD/CNY trading below 6.80, with the Chinese Yuan at its strongest level since February 2023 ahead of the US/China summit. They attribute Yuan outperformance to safe-haven demand and solid trade data, while expecting only incremental outcomes from Trumpโs visit, focused on trade discipline and limited confidence-building steps.
Safe-haven flows and trade surplus
“The Chinese yuan trades at the strongest level since February 2023, returning below 6.80/USD ahead of this weekโs US/China summit. The outperformance of the Yuan in EM Asia this year has been more about Chinaโs rising status as a safe-haven amid the geopolitical and energy storm.”
“Foreign trade data also continue to support the currency. Exports climbed 14.1% yoy, lifting the surplus to $84.82bn in April.”
“The visit of Trump is relatively low on expectations, underscored by a scaledโdown CEO delegation compared to 2017 and late invites that reflect internal policy divisions. The agenda will prioritize trade discipline and a possible short extension of the October trade truce, rather than headlineโgrabbing deal announcements.”
“China will likely press for relief from US technology export controls and greater policy certainty, while Washington is set to hold the line, keeping outcomes incremental
US April CPI on Tuesday is forecast at 0.6% MoM and 3.7% YoY, with a hotter print likely to weigh on Sterling.
Thursday’s UK Q1 GDP, consensus 0.6% QoQ, is the only domestic release with real potential to drive Sterling this week.
Iran-US clashes flared again over the weekend, with the Strait of Hormuz shut and global energy supply risk elevated.
Sterling pulled back from a fresh peak near 1.3650 on Monday, easing close to 1.3610 through European trade after the Asian session squeezed the Pound to a new local high. The rejection from the 1.3650 area produced a sharp intraday reversal, with a string of red candles unwinding most of the overnight push and pointing to fading upside momentum ahead of a heavy data week.
The week ahead is a US-heavy affair: Tuesday’s April Consumer Price Index (CPI) is the centerpiece, with consensus penciling in 0.6% MoM and 3.7% YoY headline alongside a 0.4% MoM, 2.7% YoY core read, in part reflecting the first full month of Iran-conflict energy pass-through. Wednesday’s Producer Price Index (PPI) print is forecast hotter again at 0.5% MoM and 4.9% YoY, with Thursday’s Retail Sales penciled at 0.5% MoM. A heavier Federal Reserve speaking calendar bookends each release, with Williams, Goolsbee, Kashkari, Schmid, Hammack, and Barr all scheduled, leaving the US Dollar exposed to two-way risk on every print and every headline. A hotter-than-expected CPI in particular would underline how Strait of Hormuz disruption is feeding through to US prices and tend to weigh on Sterling.
On the UK side, the calendar is thin. Thursday’s release block, headlined by the Q1 Gross Domestic Product (GDP) preliminary print at 0.6% QoQ and 0.8% YoY consensus alongside the March monthly read forecast at minus 0.2% MoM, is the only domestic catalyst with real potential to move Sterling. An upside surprise would help the Pound break free of its consolidation, while a softer set would deepen the stagflation narrative that has built since UK March CPI ran at 3.3% YoY. Bank of England (BoE) commentary from Greene on Monday and Mann on Wednesday will fill the gaps but is unlikely to drive direction. Fresh Iran-US clashes over the weekend, with the Strait of Hormuz still shut and Washington’s reopening proposal awaiting an Iranian response, continue to set the macro tone, while reported internal Labour pressure on Prime Minister Keir Starmer adds a modest political risk premium on the Pound that a soft GDP print would only widen.
GBP/USD 15-minute chart
Technical Analysis
In the fifteen-minute chart, GBP/USD trades at 1.3609. The pair holds a mild intraday bullish bias as it sits above the daily open at 1.3584, keeping the latest rebound intact despite the lack of nearby moving average references. However, the Stochastic RSI has recently shifted from overbought extremes toward the lower end of its range, hinting that upside momentum is cooling after the earlier advance.
On the downside, immediate support is seen at the daily open level around 1.3584, where buyers may look to defend the broader intraday up-move. A sustained break below this floor would weaken the constructive tone and expose deeper pullbacks, while holding above it would keep the short-term bias tilted to the upside even as momentum indicators stay in a corrective phase.
In the daily chart, GBP/USD trades at 1.3611 with a bullish near-term bias, as spot holds above both the 50-day and 200-day exponential moving averages (EMAs). The pair has extended its advance away from these reclaimed trend filters, suggesting underlying demand remains in control, while the Stochastic RSI around 61 indicates positive but not overstretched momentum, leaving room for further gains if buyers stay in charge.
On the topside, immediate support-turned-reference now comes from the 50-day EMA at 1.3480, followed by the 200-day EMA near 1.3399, which together mark a broader demand band on any corrective pullback. As long as daily closes remain above these EMAs, the technical backdrop would continue to favor dip-buying strategies over a deeper reversal.
To provide the best experiences, we use technologies like cookies to store and/or access device information. Consenting to these technologies will allow us to process data such as browsing behavior or unique IDs on this site. Not consenting or withdrawing consent, may adversely affect certain features and functions.
Functional
Always active
The technical storage or access is strictly necessary for the legitimate purpose of enabling the use of a specific service explicitly requested by the subscriber or user, or for the sole purpose of carrying out the transmission of a communication over an electronic communications network.
Preferences
The technical storage or access is necessary for the legitimate purpose of storing preferences that are not requested by the subscriber or user.
Statistics
The technical storage or access that is used exclusively for statistical purposes.The technical storage or access that is used exclusively for anonymous statistical purposes. Without a subpoena, voluntary compliance on the part of your Internet Service Provider, or additional records from a third party, information stored or retrieved for this purpose alone cannot usually be used to identify you.
Marketing
The technical storage or access is required to create user profiles to send advertising, or to track the user on a website or across several websites for similar marketing purposes.