

The offshore yuan traded around 6.83 per dollar on Wednesday, remaining near a recent more than three-year high, as it heads into a period of expected seasonal weakness that may arrive earlier than usual this summer. Chinese firms are accelerating foreign exchange hedging ahead of a record wave of dividend payments scheduled for June through August, with mainland companies listed in Hong Kong expected to distribute nearly $70 billion in payouts. Instead of waiting closer to payout dates, many are locking in rates early due to lower cost of currency purchases and forward rates are cheaper than the spot market. Pressure on the yuan comes from renewed US–China tensions, including Washington’s sanctions on a major refiner and warnings of possible secondary sanctions on banks. Meanwhile, China’s blocking of Meta’s acquisition of AI startup Manus, along with stricter export compliance and supply chain rules, has further contributed to a more cautious sentiment for the yuan.

EUR/USD – Likely find direction after Fed’s policy announcement
- EUR/USD trades calmly near 1.1700 ahead of the Fed-ECB monetary policy announcement.
- Both the Fed and the ECB will likely maintain the status quo.
- The German HICP is estimated to have grown at a stronger pace of 3% YoY in April.
The EUR/USD pair consolidates around 1.1700, inside Tuesday’s trading range, during the Asian trading session on Wednesday. The major currency pair has remained broadly sideways, with investors awaiting monetary policy announcements by the Federal Reserve (Fed) and the European Central Bank (ECB) on Wednesday and Thursday, respectively.
Both the Fed and the ECB are expected to leave interest rates unchanged at their current levels, and warn of upside inflation risks amid elevated energy prices due to the prolonged closure of the Strait of Hormuz.
Investors will pay close attention to commentaries from Fed Chair Jerome Powell and ECB President Christine Lagarde to get cues about whether their respective central banks are discussing the need to tighten monetary conditions in the near term.
Ahead of the Fed-ECB policy announcement, investors will focus on the preliminary German Harmonized Index of Consumer Prices (HICP) data for April, which will be published at 12:00 GMT. The data is expected to show that the German inflation accelerated to 3% Year-on-Year (YoY) from 2.7% in March.
EUR/USD technical analysis

EUR/USD trades flat at around 1.1700 as of writing. The pair reflects a sideways trend as it remains sticky to the 20-day exponential moving average (EMA), which is at 1.1698, but stays above the 38.2% Fibonacci retracement at 1.1666.
The Relative Strength Index (RSI) shifts into the 40.00-60.00 zone after failing to sustain above 60.00 for longer, which indicates loss of upside momentum, but the upside bias remains intact.
On the topside, immediate resistance emerges at the 50.0% Fibonacci retracement near 1.1745, followed by the 61.8% retracement around 1.1825, with further hurdles at 1.1938 and the cycle high near 1.2082. Looking down, the 38.2% retracement at 1.1666 is the initial support; a break below that area would expose deeper supports at the 23.6% level near 1.1567 and the structural floor around 1.1408.

EUR/JPY remains subdued below 187.00 as risk-off sentiment weighs on Euro
- EUR/JPY falls as the Euro weakens amid rising risk aversion over uncertainty surrounding a potential Middle East ceasefire.
- US officials say President Donald Trump has directed aides to prepare for a prolonged blockade of Iran.
- JPY remains firm amid BoJ rate-hike expectations and speculation about intervention to limit further currency weakness.
EUR/JPY edges lower after three days of gains, trading around 186.80 during the Asian hours on Wednesday. The currency cross declines as the Euro (EUR) struggles amid heightened risk aversion driven by uncertainty over a potential ceasefire in the Middle East.
The Wall Street Journal reported on Wednesday that US officials said President Donald Trump has instructed aides to prepare for a prolonged blockade of Iran. The report noted that Trump chose to keep pressuring Iran’s economy and oil exports by restricting shipping to and from its ports. Sources added that he viewed alternative options, such as resuming bombing or disengaging from the conflict, as riskier than maintaining the blockade.
Traders turn their attention to the European Central Bank (ECB) interest rate decision on Thursday, where markets expect a “hawkish hold” as policymakers weigh potential rate hikes in June or July. Analysts at Goldman Sachs anticipate two 25 basis point hikes in the coming months, starting in June and followed by another in September, which would lift the deposit rate back to 2.50%.
The EUR/JPY cross remains under pressure as the Japanese Yen (JPY) stays firm amid expectations of a near-term rate hike from the Bank of Japan, alongside speculation that authorities may intervene to curb further yen weakness.
However, the JPY has struggled to attract sustained buying interest despite the BoJ’s hawkish pause on Tuesday. Notably, three of the nine policy board members backed a rate hike, highlighting growing concern over inflation pressures linked to the Iran conflict.
BoJ Governor Kazuo Ueda reaffirmed the central bank’s commitment to gradual policy tightening, signaling that interest rates could continue to rise as economic, price, and financial conditions evolve. Meanwhile, Finance Minister Satsuki Katayama reiterated that authorities stand ready to intervene in currency markets at any time to support the Yen.

GBP/USD – Hovers around nine-day EMA near 1.3500
- GBP/USD may appreciate toward the two-month high of 1.3599.
- The 14-day Relative Strength Index near 56 signals positive momentum without indicating overbought conditions.
- The pair is testing the lower boundary of the ascending channel around 1.3510.
GBP/USD inches higher after registering little losses in the previous day, trading around 1.3520 during the Asian hours on Wednesday. The technical analysis of the daily chart indicates a potential for a bearish reversal as the pair is hovering around the lower boundary of the ascending channel pattern.
However, the GBP/USD pair maintains a modest bullish bias as it holds above the nine-day Exponential Moving Average (EMA) and the 50-day EMA. The clustering of these averages below the spot suggests a supportive backdrop after the recent advance, while the 14-day Relative Strength Index around 56 hints at positive but not overextended momentum, leaving room for further gains while the pair remains under nearby resistance.
The GBP/USD pair may rise toward the primary barrier at the two-month high of 1.3599, recorded on April 17. Further advances would support the pair to explore the region around the upper boundary of the ascending channel near the 1.3869, the highest level since September 2021, reached on January 27.
On the downside, the GBP/USD pair is testing the lower boundary of the ascending channel around 1.3510. aligned with the nine-day EMA of 1.3509. Further support lies at the 50-day EMA at 1.3440. A successful break below this confluence support zone would expose the five-month low of 1.3159, recorded on March 31, followed by the 1.3010, the lowest since April 2025, which was recorded in November 2025.
Pound Sterling Price Today
The table below shows the percentage change of British Pound (GBP) against listed major currencies today. British Pound was the strongest against the New Zealand Dollar.
| USD | EUR | GBP | JPY | CAD | AUD | NZD | CHF | |
|---|---|---|---|---|---|---|---|---|
| USD | -0.02% | -0.03% | -0.02% | -0.01% | 0.11% | 0.14% | -0.11% | |
| EUR | 0.02% | -0.03% | 0.02% | 0.00% | 0.11% | 0.18% | -0.08% | |
| GBP | 0.03% | 0.03% | 0.02% | 0.02% | 0.13% | 0.18% | -0.07% | |
| JPY | 0.02% | -0.02% | -0.02% | -0.01% | 0.13% | 0.18% | -0.04% | |
| CAD | 0.01% | -0.00% | -0.02% | 0.01% | 0.14% | 0.18% | -0.07% | |
| AUD | -0.11% | -0.11% | -0.13% | -0.13% | -0.14% | 0.05% | -0.25% | |
| NZD | -0.14% | -0.18% | -0.18% | -0.18% | -0.18% | -0.05% | -0.26% | |
| CHF | 0.11% | 0.08% | 0.07% | 0.04% | 0.07% | 0.25% | 0.26% |
The heat map shows percentage changes of major currencies against each other. The base currency is picked from the left column, while the quote currency is picked from the top row. For example, if you pick the British Pound from the left column and move along the horizontal line to the US Dollar, the percentage change displayed in the box will represent GBP (base)/USD (quote).

Trade of The Day – GBP/JPY – Long GBP/JPY at market price Target: 215.85
Facts:
The pair reached the lower limit of 1:1 structure at 215.14 Main trend on the pair remains upward
Recommendation:
Trade: Long GBPJPY at market price Target: 215.85, 216.30 Stop: 214.90
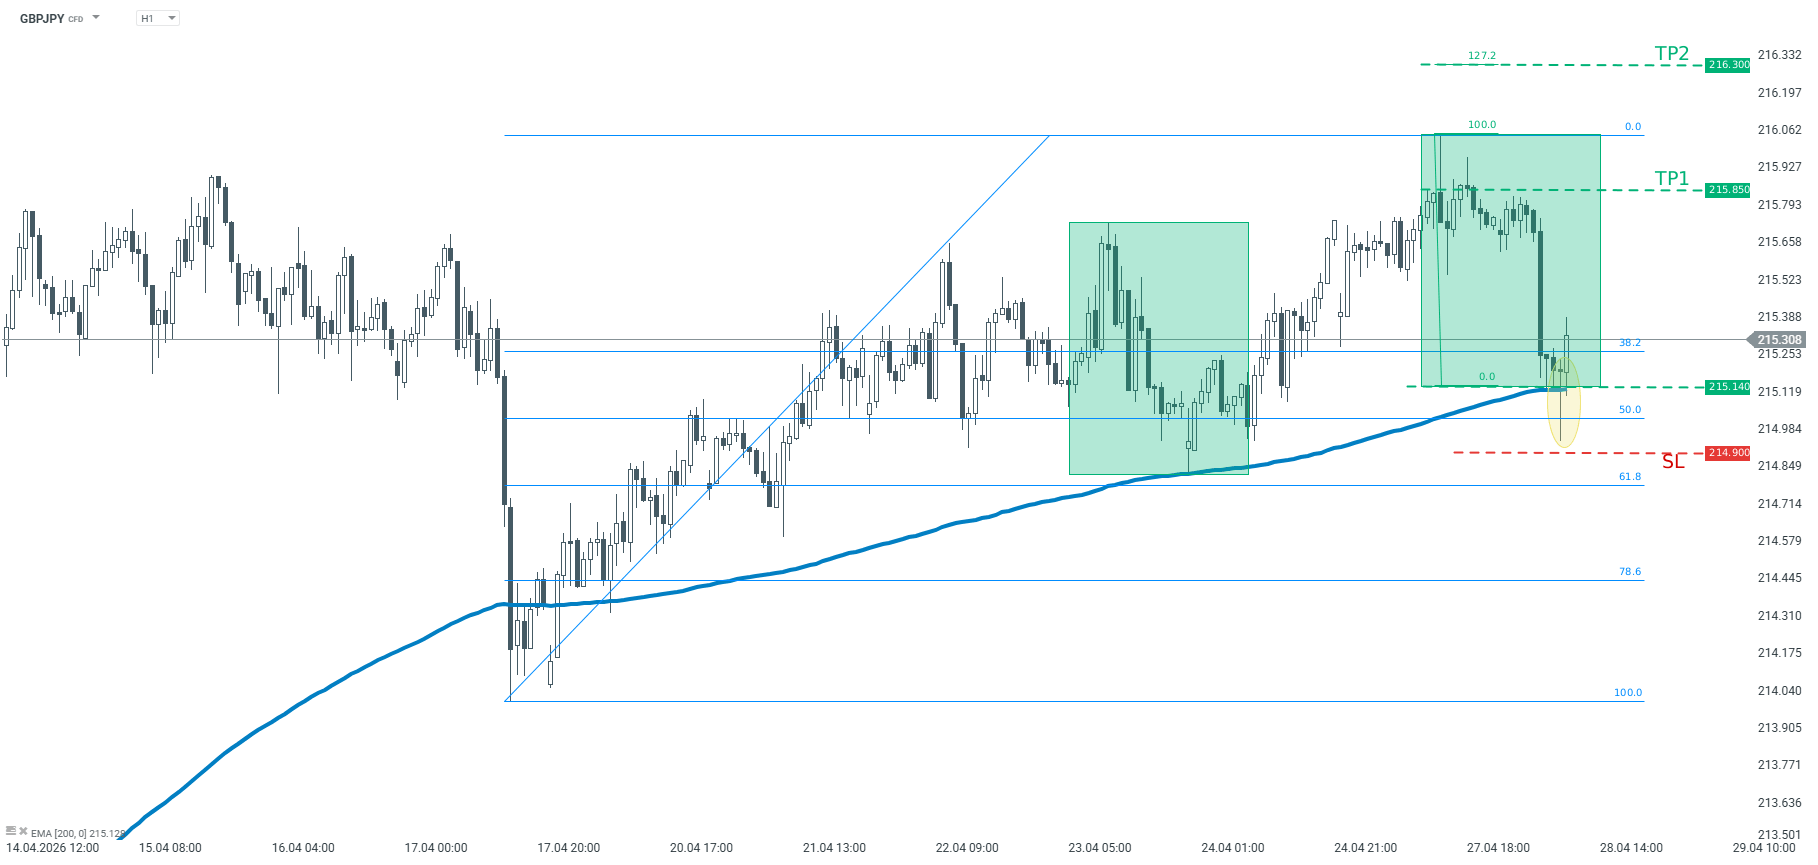
Opinion:
Looking at GBPJPY chart, one can observe that the price reached the key technical support today. This support is marked with the lower limit of 1:1 structure (green rectangles), as well as 200-period moving average. In addition the bullish candlestick pattern – pin bar appeared on the H1 chart. Should buyers manage to hold the price above the support at 215.14, another upward impulse may be on the cards. We recommend taking a long position on GBPJPY at market price with two targets: 215.85 and 216.30 We recommend placing a stop loss order at 214.90.

Chart of The Day – USD/JPY with mixed reaction to cautious Bank of Japan decision. Is stagflation heading to Japan?
The Bank of Japan kept interest rates unchanged at 0.75%, in line with market expectations, although the reaction of the USDJPY pair to the decision appears rather mixed. Bank of Japan (BoJ) Governor Kazuo Ueda spoke at a press conference, explaining the reasons behind maintaining the key interest rate at 0.75% during the April meeting. Rate hikes will continue in line with developments in the economy and inflation, with particular attention paid to the impact of the situation in the Middle East. The goal remains to achieve a stable 2% inflation rate, although Japan’s economic growth is expected to slow in 2026. Higher oil prices are likely to reduce corporate profits and households’ real income, although the economy will be supported by government measures such as fuel subsidies.
Key takeaways from the BoJ conference
The situation in the Middle East remains uncertain. Japan’s economy is recovering moderately, although some signs of weakness are visible. Economic growth is likely to slow in fiscal year 2026 due to developments in the Middle East. Close attention must be paid to how these developments affect financial markets, FX markets, as well as Japan’s economy and prices. There is also a need to carefully monitor the risk of inflation deviating significantly to the upside, which could negatively impact the economy. Real interest rates remain at very low levels. The BoJ will continue to raise rates and adjust the degree of monetary accommodation depending on economic activity, prices, and financial conditions. The timing and pace of adjustments will be assessed in the context of the impact of Middle East developments and the likelihood of achieving the baseline scenario. The decision was made by a 6–3 vote, with Nakagawa, Takata, and Tamura dissenting, as they proposed raising the rate to 1%.
Board members’ remarks
Tamura suggested including a statement that underlying inflation is in line with the target, while Takata proposed noting that CPI has already reached the target level. Both proposals were ultimately rejected. Additional comments Oil prices may have a stronger impact on inflation than before. The Bank needs more time to assess the effects of the Middle East situation. Underlying inflation is currently slightly below 2%. It is difficult to determine when the next rate hike will occur. Monetary policy will be conducted in a way that avoids falling “behind the curve.” The decision to hold rates reflects a lower probability of the baseline scenario being realized. The dissent of three board members highlights the difficulty of conducting monetary policy under current conditions. There is no immediate need to raise rates, but they may become necessary if supply shocks generate secondary effects. The risk of rising inflation could be a reason for rate hikes, though not the only one.
BoJ Quarterly Outlook Report
Real interest rates remain very low. Underlying inflation is expected to reach levels consistent with the 2% target in the second half of fiscal 2026 and in 2027. Risks to economic growth are tilted to the downside, while risks to inflation are tilted to the upside. Economic growth is expected to slow in 2026 but should moderately accelerate from 2027 onward. Rising oil prices are expected to affect both CPI and incomes.
BoJ forecasts Core CPI
- 2026: 2.8% (previously 1.9%)
- 2027: 2.3% (previously 2.0%)
- 2028: 2.0%
Real GDP
- 2026: 0.5% (previously 1.0%)
- 2027: 0.7% (previously 0.8%)
- 2028: 0.8%
Key risks highlighted by the BoJ
The BoJ noted that rising oil prices may now pass through more easily into the prices of goods and services than in the past. There is also a risk of stronger increases in food prices, particularly if higher raw material costs feed into production costs. The Bank pointed to the possibility of significant disruptions in global supply chains, which could materially affect the production activity of Japanese firms. The report also addressed artificial intelligence. Strong corporate investment in AI could support the global economy, but if it is not matched by profit growth, it may lead to adjustment pressures in asset markets. The BoJ also emphasized that exchange rate movements now have a greater impact on inflation than in the past, while trade policies implemented so far have partly altered the course of globalization. Medium- to long-term inflation expectations are rising moderately. USDJPY charts (H1, D1)
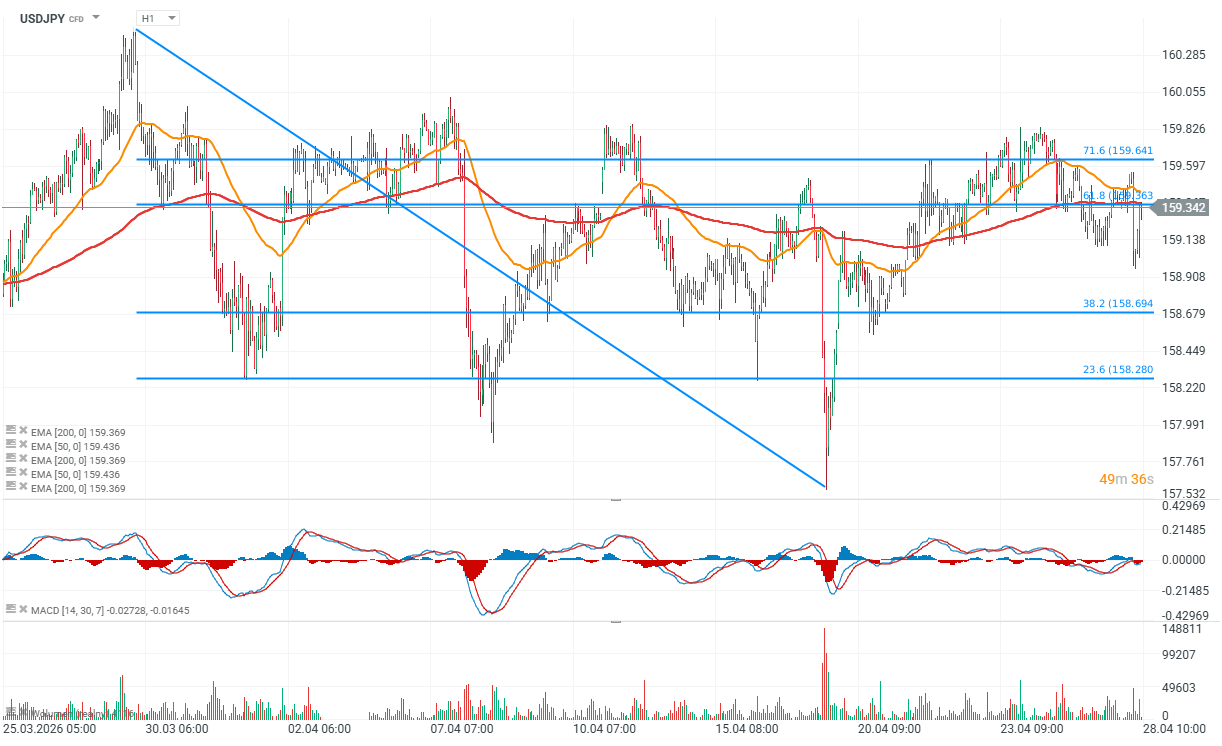
Source: xStation5
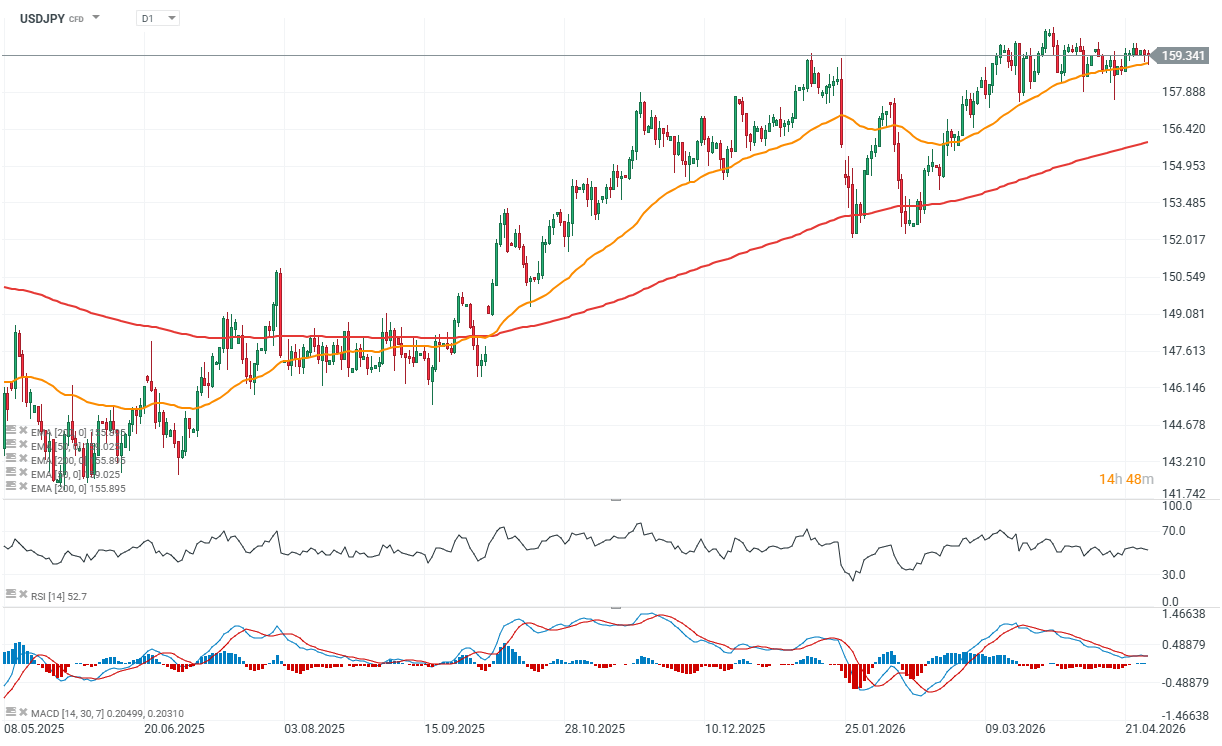
Source: xStation5

USD/INR boards fresh rally as oil prices remain elevated
- The Indian Rupee falls further against the US Dollar as higher oil prices boost demand for the Greenback by Indian importers.
- Fresh concerns over India Inc.’s earnings projections have dampened the FIIs interest in the Indian stock market.
- This week, investors will pay close attention to the Fed’s monetary policy.
The Indian Rupee (INR) weakens further after a brief pause against the US Dollar (USD) in the opening session on Tuesday. The USD/INR pair jumps to near 94.50 as elevated oil prices continue to hurt the Indian Rupee.
As of writing, the WTI Oil price trades 0.6% higher to near $95.60 and is close to its two-week high of $97 posted on Thursday.
Currencies from economies, such as India, which rely heavily on oil imports to meet their energy needs, tend to underperform in a high oil price environment.
Oil prices have remained higher due to uncertainty over the reopening of the Strait of Hormuz, a critical passage to almost 20% of global energy supply.
According to a Reuters report, oil-linked flows and hedging-related US Dollar demand are key headwinds for the Indian Rupee
Hormuz closure keeps oil prices elevated
The uncertainty regarding the reopening of the Hormuz remains escalated, as Washington has not shown any signs of interest in proposals delivered by Iran to end the war. On late Monday, White House press secretary Karoline Leavitt stated that US President Trump discussed Iran’s proposal with the national security team, which calls for the reopening of the Strait of Hormuz and a permanent ceasefire. Leavitt didn’t reveal any information regarding the odds of whether it will be taken forward by Washington.
“I wouldn’t say they’re considering it. I would just say that there was a discussion this morning that I don’t want to get ahead of, and you’ll hear directly from the president, I’m sure, on this topic,” Leavitt said.
On Monday, US President Trump received another proposal from Iran, which he called “better” than the one, which it was expected to present in canceled peace talks in Islamabad over the weekend, but “still not good enough”.
FIIs extends selling pressure in Indian stock market
In the last six trading days, Foreign Institutional Investors (FIIs) have remained net sellers and have offloaded their stake worth Rs. 18,291.34 crore after a little buying in the April 15-17 period. FIIs appear to be dumping their stake in the Indian equity market due to elevated oil prices, which have raised concerns over India Inc.’s earnings projections.
Fed seems to maintain status quo
This week, the major trigger for the US Dollar will be the Federal Reserve’s (Fed) monetary policy announcement on Wednesday, in which it is expected to leave interest rates unchanged in the range of 3.50%-3.75% for the third time in a row. Investors will pay close attention to Fed Chair Jerome Powell’s comments regarding the monetary policy outlook in the wake of the energy price shock amid the Hormuz closure.
Technical Analysis: USD/INR approaches all-time high of 95.20

USD/INR trades higher at around 94.50, maintaining a bullish near-term bias, as it holds above the 20-day Exponential Moving Average (EMA) at 93.53. The positioning above this rising EMA suggests the broader uptrend remains intact, while the Relative Strength Index (RSI) around 61 indicates firm but not overstretched upside momentum.
On the downside, the 20-day EMA at 93.53 stands as the first layer of dynamic support, and a daily close below this level would hint at a deeper corrective phase within the broader trend. Looking up, the pair aims to revisit the all-time high around 95.20. The spot would enter uncharted territory if it manages a decisive break above 95.20.

EUR/GBP flat lines above 0.8650 as markets await BoE, ECB rate decisions
- EUR/GBP holds steady around 0.8660 in Tuesday’s early European session.
- BoE is expected to hold rates steady despite inflation risk.
- Markets anticipate the ECB holding the key rates on Thursday.
The EUR/GBP cross trades on a flat note near 0.8660 during the early European trading hours on Tuesday. Traders prefer to wait on the sidelines ahead of the Bank of England (BoE) and the European Central Bank (ECB) interest rate decisions later on Thursday.
The BoE is likely to keep interest rates steady at 3.75% at its April policy meeting on Thursday as policymakers buy time to assess the risks stemming from the energy crunch. BoE governor Andrew Bailey said in the last meeting that, given the UK’s weak labor market and a lack of corporate pricing power, there was no immediate need to change policy.
However, a UK economist at JPMorgan pointed to strong business activity readings and expansion in Gross Domestic Product (GDP) in February as underscoring the inflation risks. “We expect the BoE to create space for a potential near-term hike, with incoming data determining whether and when it will act,” he said.
The ECB is expected to keep its key interest rates unchanged at its next meeting on Thursday. While rates are expected to hold, markets anticipate the ECB may signal future hikes to combat persistent inflation. All eyes will be on ECB President Christine Lagarde’s press conference after the meeting for clues about the outlook for rates.
Goldman Sachs analysts see the ECB delivering two 25 basis point (bps) rate hikes in the months ahead. The first being in June, with the next in September, in bringing the deposit rate back to 2.50%.
