Goldman Sachs has significantly raised its forecasts for the USD/JPY pair, becoming one of the most bearish investment banks on the Japanese currency. The bank’s strategists now expect the exchange rate to rise from their previous 12-month target of 155 to 165 yen per U.S. dollar, which would mark the weakest level for the yen since 1986—nearly 40 years ago.
Key Takeaways
- Goldman Sachs raised its 12-month USD/JPY forecast from 155 to 165.
- The bank also lifted its 3-month forecast from 160 to 162 and its 6-month target from 158 to 163.
- The yen remains close to its weakest levels in four decades, with USD/JPY currently trading around 162.
- According to Bloomberg’s survey, Goldman is now among the most bearish institutions on the Japanese currency.
- Options markets imply roughly a 72% probability that USD/JPY reaches 165 by June next year.
- Hedge funds are holding their largest net short positions in the yen since 2017.
Why Does Goldman Expect Further Yen Weakness?
According to Goldman Sachs FX strategist Karen Reichgott Fishman, three key factors are driving the bank’s revised outlook:
- persistently high U.S. Treasury yields,
- mounting fiscal pressures in Japan,
- and the Bank of Japan’s very gradual pace of interest rate hikes.
At the same time, Goldman acknowledges that the yen already appears significantly undervalued based on its fundamental valuation models. However, that alone is not enough to trigger a sustained recovery. The bank argues that the wide interest rate differential between the United States and Japan, together with the divergence in monetary policy, continues to strongly favor the U.S. dollar.
Carry Trades Remain a Major Driver
Goldman Sachs continues to favor using the yen as the preferred funding currency for carry trades. The strategy is straightforward:
- investors borrow low-cost yen,
- sell the currency in the FX market,
- and invest the proceeds in higher-yielding assets such as U.S. bonds or emerging-market currencies.
As long as the Bank of Japan maintains relatively accommodative financial conditions, carry trades are likely to remain attractive, adding further depreciation pressure on the yen.
Can Japan Stop USD/JPY From Rising?
Goldman remains skeptical about the effectiveness of future currency interventions. Although Japan’s Ministry of Finance has hinted that future interventions could become less predictable, the bank believes even direct yen-buying operations would likely generate only a temporary correction. Unless there is a meaningful decline in U.S. Treasury yields, a more hawkish Bank of Japan, or a significant narrowing of the U.S.-Japan interest rate gap, the fundamental drivers of yen weakness are likely to remain firmly in place.
Markets Are Increasingly Pricing in USD/JPY at 165
One notable aspect of Goldman’s outlook is how closely it aligns with broader market positioning. Currently:
- hedge funds hold their largest net short yen positions in eight years,
- FX derivatives imply roughly a 72% probability of USD/JPY reaching 165 by the middle of next year,
- and an increasing number of investors view shorting the yen as one of the most crowded trades in global currency markets.
While this reinforces the prevailing uptrend, it also increases the risk of sharp corrections should expectations for the Federal Reserve or the Bank of Japan change unexpectedly.
What Could Change the Outlook?
The key near-term event will be the release of this week’s Federal Reserve meeting minutes. Investors will focus primarily on:
- signals regarding future Fed rate cuts,
- the direction of U.S. Treasury yields,
- upcoming Bank of Japan policy decisions,
- and the possibility of intervention by Japanese authorities.
A hawkish set of Fed minutes could strengthen the U.S. dollar further, putting renewed pressure on both the yen and the euro. Conversely, weaker U.S. economic data could lower Treasury yields and provide temporary relief for non-dollar currencies.
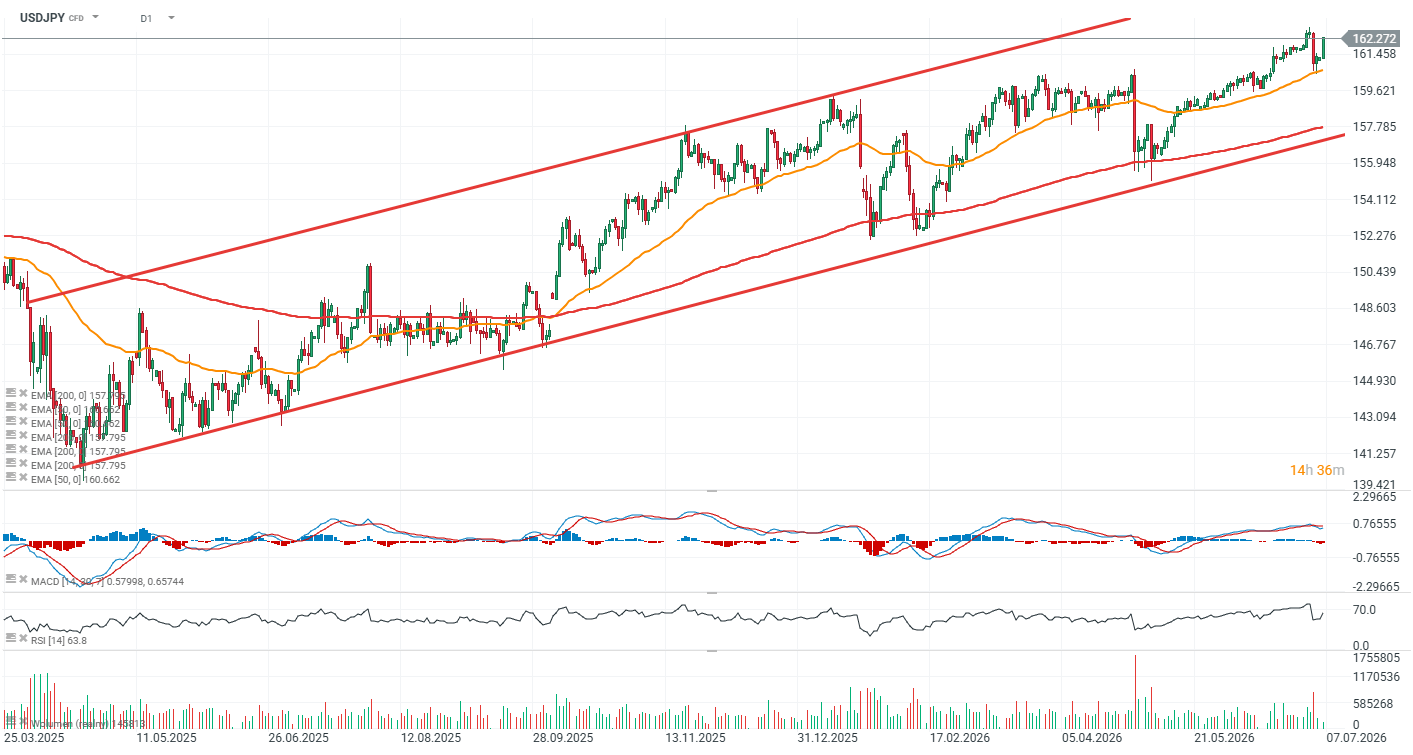
USD/JPY Technical Analysis (D1)
USD/JPY remains in a strong uptrend and continues to trade within a well-defined ascending price channel. The lower boundary of the channel is currently located near 158, a level that was last tested in May. In the short term, resistance is seen around 162.8 , corresponding to the pair’s recent swing highs. A sustained break above this level could reinforce bullish momentum, while a rejection may trigger another pullback toward the lower boundary of the ascending channel. 165 level i now probably the strongest resistance zone.