NFP preview:
Will there be a World Cup boost? The June payrolls report is released today at 1330 BST, a day early this month due to the Independence day holiday on Friday. The market is expecting an approximately 113k increase in payrolls, which is a step down from the 172k print for May, the unemployment rate is expected to remain stable at 4.3%, and average hourly earnings could pick up a notch to 3.5% from 3.4% YoY. The strong reading for May makes the June report a test: can the upside momentum be maintained, or was the May figure an anomaly? Federal government jobs jumped last month, but this is expected to be one-off. If we get a reading that is close to consensus, then it would suggest modest growth in US jobs numbers are continuing. This would point to a resilient labour market that is not falling off a cliff.
Resilient labour market
Average monthly jobs growth this year has been above 80k, and we do not expect a number lower than this. The Atlanta Fed’s GDPNow model is predicting robust GDP growth for Q2 of 2.5%, which should easily support US job growth of 100k plus. We expect the bulk of jobs to have been created in the education and healthcare sector, with decent gains for construction and leisure and hospitality. The question is, could there be a World Cup boost? Stadium attendance at games so far in the US has hit a record high, of more than 3.5mn, which could boost hotels and the leisure sector.
Will payrolls boost Fed rate hike chances?
This payrolls report comes a day after the new Federal Reserve Chair, Kevin Warsh, spoke at the ECB’s central bankers conference in Portugal. Kevin Warsh said a few things that are worth noting. Firstly, that inflation expectations are moderating, secondly, that AI’s impact on the jobs market is not yet visible and thirdly, that his task forces could change what economic data the Fed focuses on. The latter point is worth noting. Although we think that payrolls will remain important for central bank decision making, change is coming at the Fed. As we lead up to this payrolls report, the market continues to price in a 28% chance of a rate hike at the Fed’s next meeting on 29th July.
Interest rate futures markets have repriced rates higher after a surprisingly hawkish FOMC meeting, and if we get a significant upside surprise for payrolls today, of 180k plus, then we could see the chance of a July rate hike surge past 50%. So far, the lead indicators have been mixed. Although the ISM manufacturing employment index was stronger, it remained below 50. Added to this, the ADP private sector payrolls report was slightly weaker than expected and was 113k for last month. The 4-week moving average for initial jobless claims ticked higher last week, but at 224k, it is still low.
The impact of a downside surprise
A downside surprise of 70k or lower could see the US Treasury curve steepen, as 2-year Treasury yields fall, and long-end bond yields rise. We think a weaker number could also lead to a recalibration of US interest rate expectations, and we think the Fed would be unlikely to hike rates in July if the labour market is showing signs of softening, especially if the unemployment rate also rises.
What’s next for the dollar
This data will also be the next major driver of the dollar, at least until we get the June CPI report. The US dollar index is at a 14-month high, and the US dollar is the best performing currency in the past year. In the past month, the USD index has risen by 2.5%. The break above 100.50 2 weeks ago was an extremely bullish development, and is supportive of further gains. However, the forex market can be contrarian around payrolls reports, so we could see some buying the rumour, before selling the fact later on Thursday. The technicals continue to point in a bullish direction, so the path of least resistance is for further gains for the Greenback. If payrolls are weak, and the dollar does experience a sell off, as long as the dollar index does not fall below 100.50, then the uptrend remains intact.
Chart 1: The dollar index
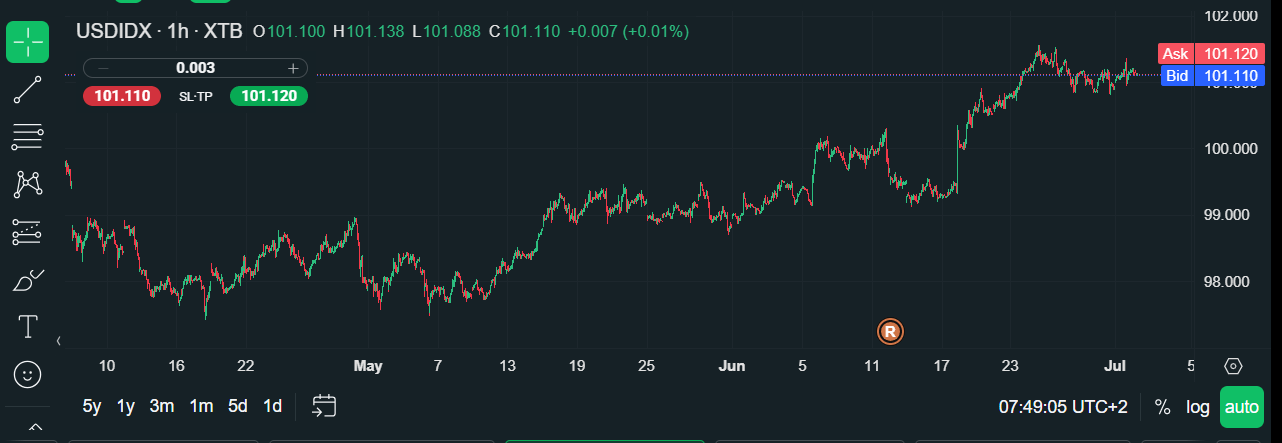
Source: XTB