EUR/JPY could face initial resistance around the rising wedge top at 186.90.
The 14-day Relative Strength Index near 60 indicates firm upside momentum without entering overbought territory.
The primary support lies at the nine-day EMA of 186.04.
EUR/JPY gains ground after registering minor losses in the previous day, trading around 186.50 during the Asian hours on Monday. The currency cross is keeping a bullish near-term bias as it holds above both the nine-period and 50-period Exponential Moving Averages (EMAs). The configuration of the short-term EMA above the longer-term EMA suggests a constructive trend backdrop.
Meanwhile, the 14-day Relative Strength Index (RSI) near 60 points to firm but not yet overbought upside momentum, hinting that buyers still retain control unless price slips back below the nearby averages. However, the daily chart technical analysis shows that the EUR/JPY cross is rising within a rising wedge, indicating a strong bearish reversal risk.
The EUR/JPY cross could find the primary resistance at the upper boundary of the rising wedge around 186.90. Further advances could support the currency cross to explore the region around the all-time high of 187.95, which was recorded on April 17.
On the downside, the initial support lies at the nine-day EMA of 186.04, followed by the 50-day EMA at 185.31, aligned with the lower boundary of the rising wedge. A break below the wedge put downward pressure on the EUR/JPY cross to navigate the region around the five-month low of 181.87, recorded on March 16, and the seven-month low of 180.81.
The past week was marked by crude oil prices returning to triple digits on expiring September contracts and a continuation of the equity market selloff. Geopolitics once again served as the primary driver for investors, fueled not only by the situation in the Middle East but also by broad new US tariffs. Wall Street earnings season delivered solid corporate results, though these proved insufficient to lift investor sentiment. A fresh wave of reports from tech giants such as Microsoft and Apple might alter that dynamic. Furthermore, decision day arrives for two key central banks, namely the Federal Reserve and the Bank of Japan. Given this concentration of high-impact events, three markets warrant close attention in the coming days: USD/JPY , Gold and US100 .
USDJPY
The Japanese currency has struggled recently, with the past week defined by mounting inflationary pressure in Japan driven in part by higher global energy costs. This week brings a direct showdown between two major central banks. On Wednesday, the FOMC will announce its policy decision, followed by the second press conference from the new Fed Chair Kevin Warsh. On Friday, the Bank of Japan will present its stance on interest rates, preceded in the morning by the Tokyo consumer price index release. Market consensus anticipates that both the Fed and the BoJ will hold interest rates at current levels, with the BoJ policy rate currently at 1.0 percent. Investors will focus heavily on potential guidance regarding future monetary tightening, particularly given that the yen trades near 40-year lows alongside rising import costs. Historical currency interventions in Japan demonstrate that verbal pressure alone, lacking decisive BoJ action, offers only temporary relief for the yen. Moreover, sentiment conveyed by the US central bank remains the primary catalyst for USD/JPY trends. Should the Fed maintain a hawkish stance while the BoJ holds back from aggressive signals due to growth concerns, USDJPY could resume its upward trajectory toward the 165 level. Conversely, a hawkish surprise from the BoJ, supported by a hotter Tokyo CPI reading and upwardly revised inflation forecasts, could trigger a sharp rally in the yen and force a rapid unwinding of massive speculative short positions.
Gold
While last week was shaped by shifting sentiment surrounding Middle Eastern geopolitical tensions and oil prices, this week presents a direct test for the gold market from US monetary policy and incoming economic data. The principal catalyst for volatility will be Wednesday’s FOMC decision, followed on Thursday by US GDP figures and the June PCE inflation metric, which remains the Federal Reserve’s preferred inflation gauge. Gold continues to show high sensitivity to real interest rates and the trajectory of US Treasury yields. The bullion’s historic gains during periods when rate cuts are priced in clearly illustrate this relationship: as real yields decline, capital shifts smoothly into non-yielding assets. If Thursday’s PCE report points to persistent inflationary pressures and the Fed signals that rates must remain elevated for longer, gold could stay under pressure, particularly if crude oil marches back toward 100 dollars per barrel. In the alternative scenario, featuring a cooler PCE reading and waning geopolitical risk, the precious metal would gain strong momentum to break out of its recent downtrend.
US100 (Nasdaq 100 Futures)
The past week delivered another wave of selling across the global semiconductor and AI memory sectors. This week introduces the next slate of Big Tech quarterly earnings on Wall Street, coinciding directly with the Federal Reserve meeting. On Wednesday, Microsoft and Meta Platforms will report their quarterly results, followed by Apple and Amazon on Thursday. These announcements overlap with the FOMC interest rate decision on Wednesday and the US GDP and PCE releases on Thursday. Investors will scrutinize not only top-line revenue growth but primarily the return on capital expenditure dedicated to artificial intelligence infrastructure. Stretched valuations among Big Tech firms leave a remarkably narrow margin for error. Market dynamics seen during previous tech corrections demonstrate that even minor disappointment regarding forward margin outlooks can trigger index-wide selling, regardless of robust current earnings. Strong reports from market leaders coupled with measured commentary from the Fed could provide the US100 with the momentum needed to rebound from its recent pullbacks. Conversely, disappointing forward guidance paired with hawkish rhetoric from Kevin Warsh risks deepening the ongoing correction.
Brent futures (OIL) down 3.5%! Diplomacy is back? Oil prices sharply turned lower following reports that, under pressure from Beijing, Pakistan and Iran are considering a return to the negotiating table with the US. Brent futures (OIL) immediately pulled back by 1% to around $90.50 per barrel, deepening today’s losses and erasing nearly all of yesterday’s gains (currently: -3.5%).
Mixed Signals from the Middle East: A Potential Return of Diplomacy?
Following the recent escalation of Middle East tensions and oil prices returning to a monthly high, the market is eagerly snapping up the slightest mention of returning diplomacy, attempting to extract some end-of-week optimism. Over the longer term, Pakistan’s efforts alone will not be enough, especially since both sides of the conflict are playing solely to safeguard their own interests, and reports of resuming talks are accompanied by further warnings for US citizens in the region.
Below are the key headlines from recent hours:
Omani delegation in Tehran regarding the Strait of Hormuz: An Omani delegation arrived in Iran to discuss mechanisms for managing ship traffic in the Strait of Hormuz. Tehran advocates co-managing the waterway alongside Oman, but the US and Gulf states reject such a setup.
China and Pakistan push for a resumption of peace talks: Under pressure from China, Pakistan is considering attempting to resume stalled negotiations between the US and Iran aimed at ending the nearly five-month-old war. Exploratory discussions took place this week in Islamabad during a visit by the Iranian interior minister.
Tough rhetoric from Iran’s foreign minister: Abbas Araghchi stated that Iran will not bow to the US nor tolerate threats, pointing to Washington’s stance as the main obstacle to peace talks. He also reported continuous consultations with Russia and China, pledging unconditional protection of Iran’s interests in the Strait of Hormuz.
US warning for citizens in the Middle East: The US Embassy in Jordan urged Americans to reconsider travel to the Middle East due to escalation risks and potential attacks by Iran and its allies. Warnings were issued regarding airspace closures and flight cancellations, and citizens were advised to avoid US military bases in Jordan.
Trump warns Iran’s allies: In his latest social media post, the US President stated that Russia or China supplying weapons to Iran “will end badly for them.” Donald Trump added, however, that Xi and Putin said they do not plan such sales.
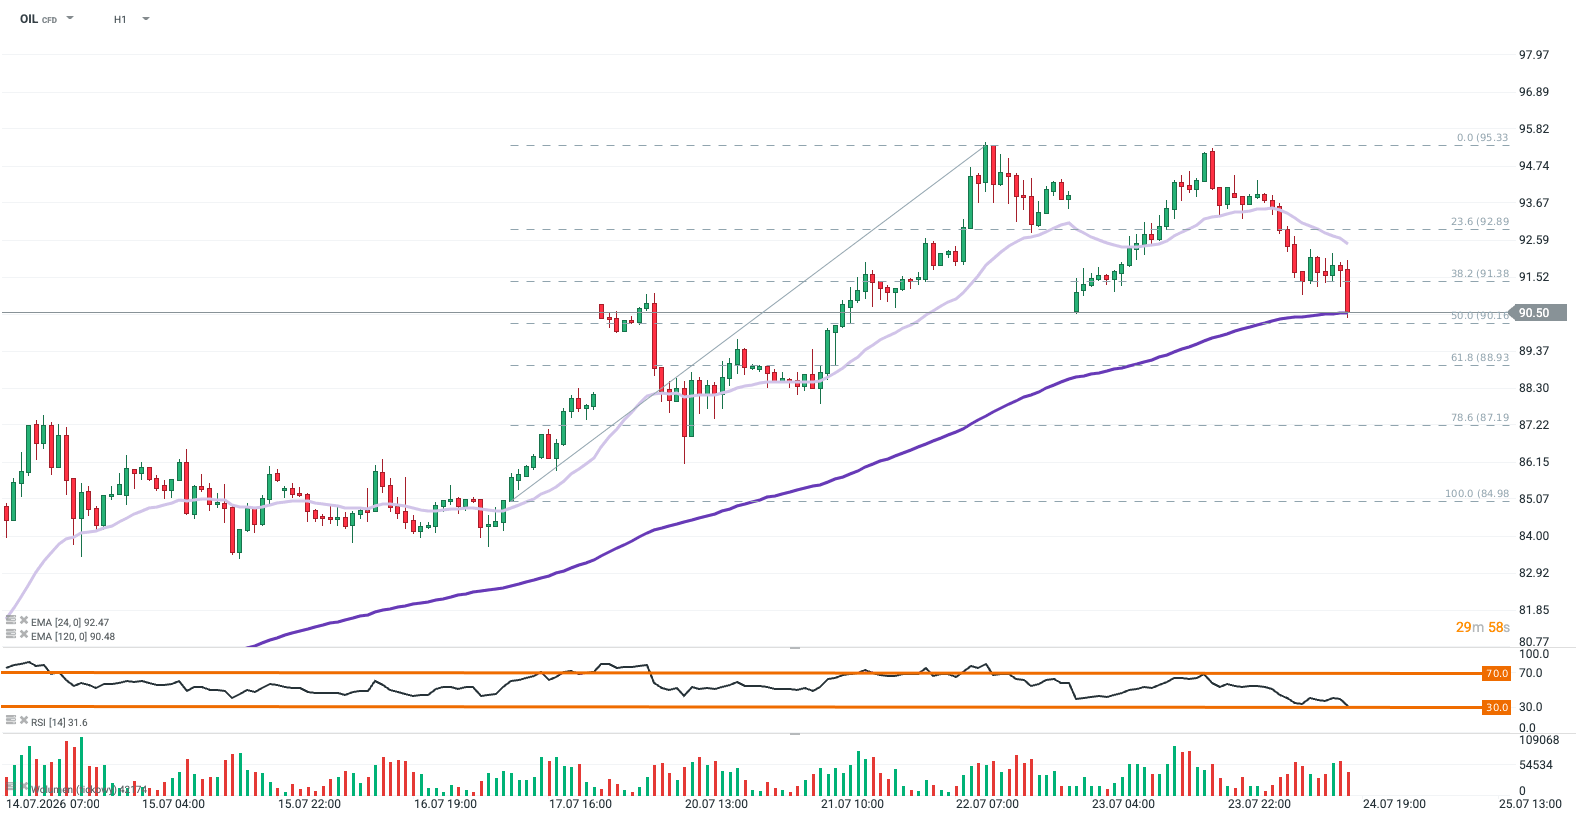
Technical Analysis: OIL (Brent Futures)
Reports of potential de-escalation in the Middle East sparked selling pressure on Brent crude (OIL). On the H1 chart, price dynamically dropped into a key support zone defined by the 120-period EMA ($90.48) and the 50.0% Fibonacci retracement ($90.16). A breakdown below this area could open the door for further declines toward the 61.8% Fibo level ($88.93). Conversely, defending current levels could favor a corrective bounce. The immediate resistance lies at the 38.2% Fibo retracement ($91.38), followed by the 24-period EMA ($92.47). The RSI is approaching oversold territory (32.1), suggesting the possibility of a temporary easing in bearish pressure, especially if no new pro-war comments emerge from the White House.
EUR/USD trades lower near 1.1370 despite stronger-than-expected German and Eurozone PMI data.
US Services PMI jumped to 53.6, keeping the US Dollar supported, while Manufacturing PMI eased to 53.8.
Attention turns to next week’s Fed meeting with rates expected to remain at 3.50%–3.75%.
EUR/USD trades lower near the 1.1370 area on Friday, struggling despite stronger-than-expected Eurozone business-activity figures. The US Dollar Index (DXY) remains firmer near 101.50, offering limited support to the pair.
Germany’s preliminary HCOB Composite Purchasing Managers Index (PMI) climbed to 51.2 in July from 49.5, exceeding expectations of 49.8 and returning to expansion territory. Manufacturing PMI improved to 52.2 from 50.3, while Services PMI rose to 49.6 from 48.6 but remained below the 50.0 threshold separating expansion from contraction.
Activity across the wider Eurozone also strengthened. The Composite PMI increased to 51.9 from 50.0, beating the 50.3 forecast. Manufacturing PMI advanced to 52.0, while Services PMI rose sharply to 51.6 from 49.4, indicating that the services sector returned to expansion.
The United States (US) preliminary S&P Global Manufacturing PMI eased to 53.8 and missed expectations of 54.5, while the Services PMI surged to 53.6 from 51.2, significantly exceeding the 51.0 forecast. The strong services reading may keep US Treasury yields supported and prevent a deeper decline in the Greenback.
Risk sentiment also improved after reports that Pakistan and Iran are exploring a potential path toward renewed US-Iran negotiations under a China-backed diplomatic initiative. A possible reduction in regional tensions has contributed to a sharp decline in Oil prices and reduced some safe-haven demand for the US Dollar, although significant obstacles to negotiations remain.
Investors will now turn their attention to the Federal Reserve’s (Fed) July 28–29 meeting. The Fed is expected to maintain its target range at 3.50%–3.75%. The meeting will not include new economic projections or an updated dot plot, leaving the policy statement and Chair Kevin Warsh’s press conference as the main drivers for EUR/USD.
Short-term technical analysis:
On the 4-hour chart, EUR/USD trades at 1.1369 with a bearish near-term bias, holding beneath both the 20-period Simple Moving Average (SMA) at 1.1397 and the 100-period SMA at 1.1422. The pair is also trading under nearby horizontal caps at 1.1387 and 1.1391, reinforcing a topside ceiling, while the Relative Strength Index (RSI) hovers near 37, hinting at persistent downside pressure but not yet oversold conditions.
On the downside, immediate support is clustered just below the market at 1.1368 and 1.1366, where a break would open the door to an extension of the recent decline. On the topside, a recovery above the 1.1387–1.1391 band is needed to ease immediate pressure, with the 20-period SMA at 1.1397 then acting as the next barrier ahead of the 100-period SMA at 1.1422, whose clearance would be required to challenge the broader bearish structure.
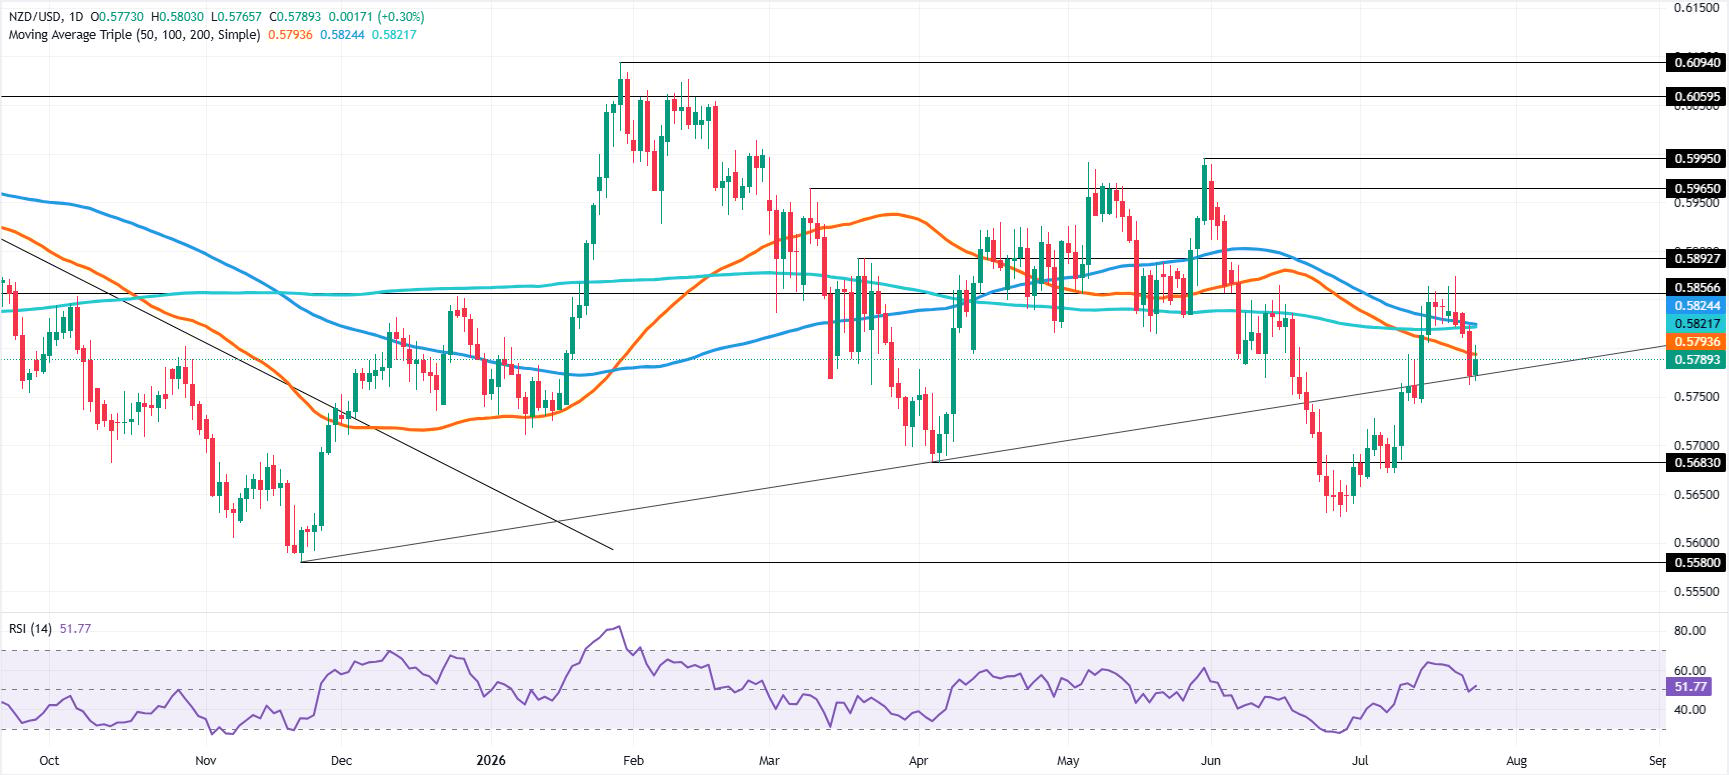
RSI turns bullish but fading slope warns of downside risk.
Break below 0.5762 exposes 0.5743 and 0.5700 supports.
The New Zealand Dollar gains over 0.30% against the US Dollar on Friday. The pair is poised to test key resistance levels with the 50-day Simple Moving Average (SMA) at 0.5793, slightly below the 0.5800 figure. At the time of writing, the NZD/USD trades at 0.5789, after bouncing off daily lows of 0.5767.
NZD/USD Price Forecast: Technical outlook
The Kiwi Dollar seems to recover during the day, but the overall trend is downwards, until the pair reclaims the May 29 high of 0.5995. Momentum turned bullish as depicted in the Relative Strength Index (RSI), but seems to be fading as the index is about to pierce bearish territory.
As of writing, the NZD/USD is testing key resistance below 0.5800. A breach of the latter will expose the confluence of the 100- day and 200-day Simple Moving Averages (SMAs) at 0.5823, followed by the July 21 high at 0.5874. Above this area, the next resistance is the 0.5900, followed by the May 29 high beneath 0.6000.
On the other hand, if NZD/USD breaches the low of the week (LOW) of 0.5762, it opens the door for further downside. The next key support is the July 13 low of 0.5743, followed by 0.5700. Beneath lies the July 7 high at 0.5672.
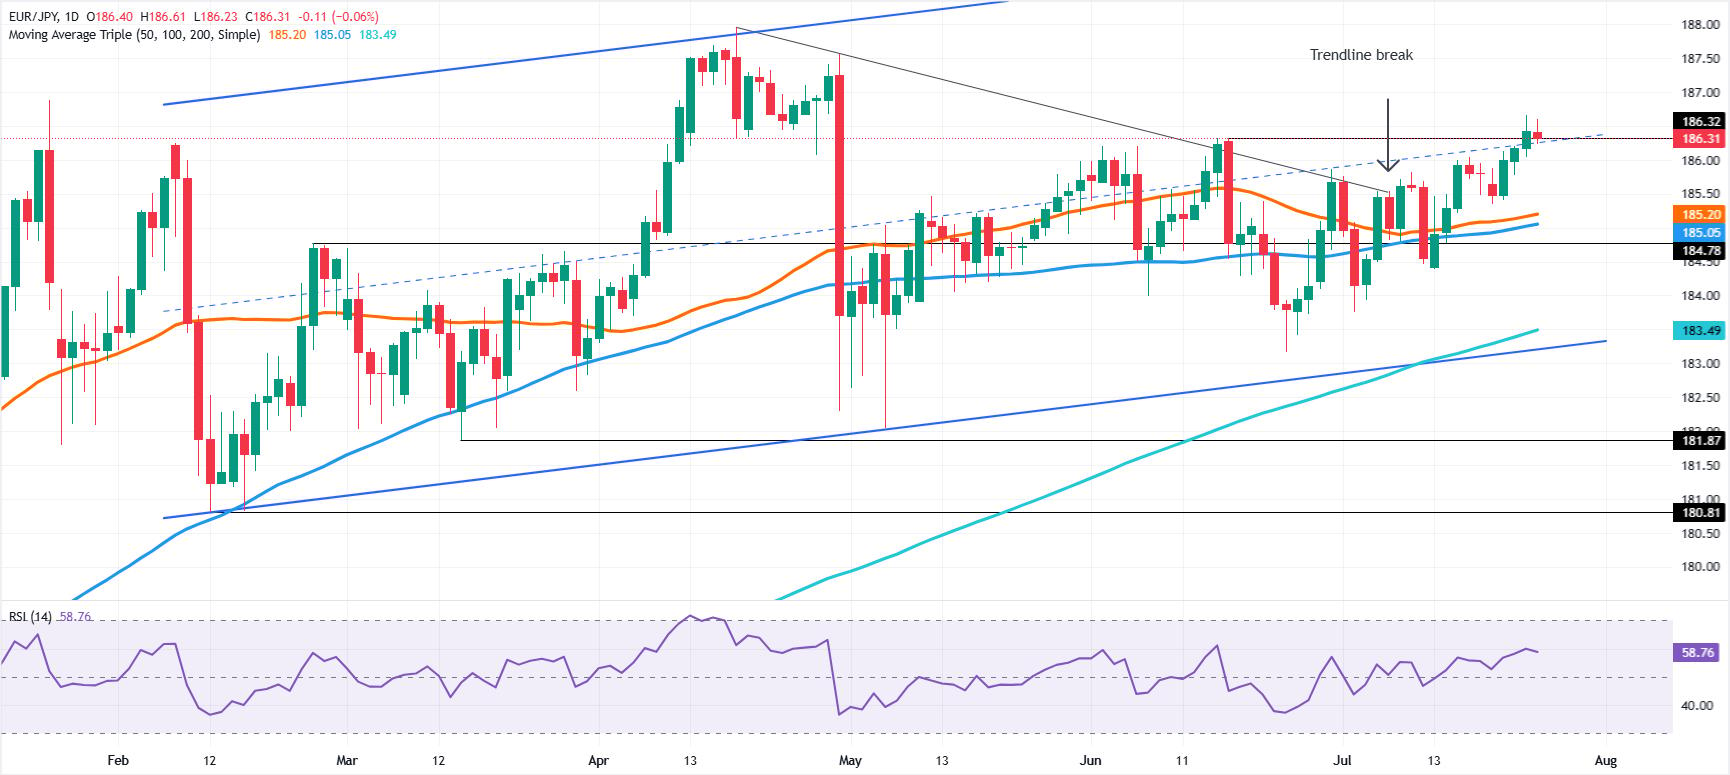
Break above 187.00 exposes YTD high and 190.00 resistance.
The EUR/JPY consolidates around 186.00, edges down by 0.06% amid a souring of risk appetite amid the escalation of the US-Iran war, and strengthens safe-haven assets like the Japanese Yen.
EUR/JPY Price Forecast: Technical outlook
The EUR/JPY trades sideways after reaching the year-to-date (YTD) high of 187.95. The cross-pair dipped toward the 183.00 area following the Bank of Japan’s (BoJ) last intervention, and since then buyers have reclaimed key resistance levels to reach the 186.00 mark.
At the time of writing, the EUR/JPY remains capped within the 186.00-187.00 range, amid fears that Japanese authorities could intervene in the foreign exchange markets. But bulls seem to be gaining momentum as indicated by the Relative Strength Index (RSI) in bullish territory.
Buyers need to clear 187.00 to challenge the YTD high at 187.95. Once those levels are taken out, the next resistance would be the 189.00 mark ahead of the 190.00 psychological level.
On the other hand, if sellers push the EUR/JPY below the July 20 low of 185.35, it exacerbates a move toward the 50-day Simple Moving Average (SMA) at 185.20, followed by the 100-day SMA at 185.05. Still lower lies the 200-day SMA at 183.29.
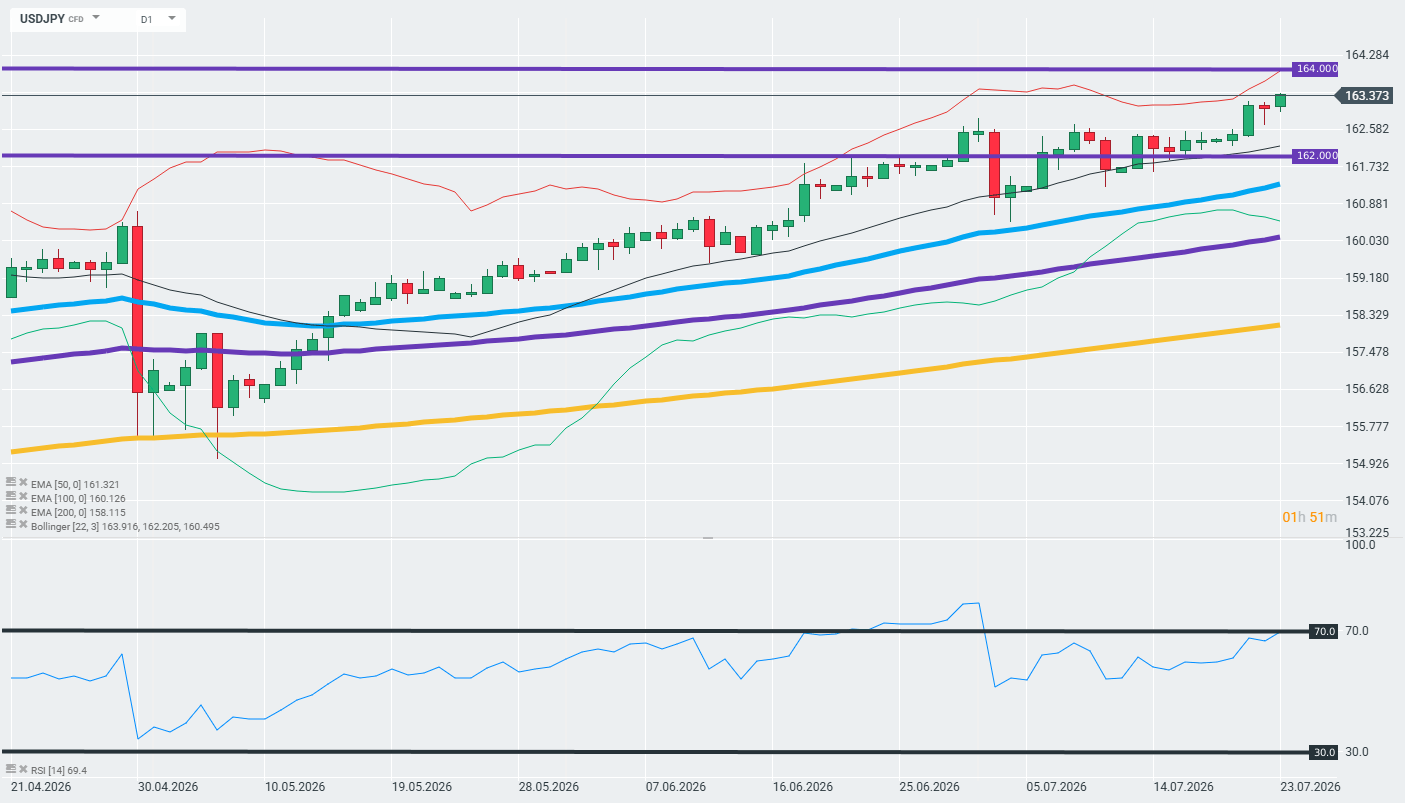
USD/JPY is breaking out to new 40-year highs above 163.30 , and the market is signalling that the acceleration in the pace of the BOJ’s rate rises is already largely priced in.
Traffic conditions on the D1
The price has broken through the previous resistance level of 163.00 (purple line) and is reaching new highs in the 163.30–163.40 range, whilst the RSI (14) remains in a strong uptrend at around 69.4, close to the overbought zone. The candlesticks are holding above the EMA50 (161.32), EMA100 (160.13) and EMA200 (158.12), and the EMA configuration (rising, in the order 50 > 100 > 200) confirms a strong bullish trend. The price is close to the upper Bollinger Band (163.92), which signals strong momentum but also the risk of a short-term correction before the next attempt to break through the resistance at 164.00.
Why do the markets already price in faster BOJ rate rises?
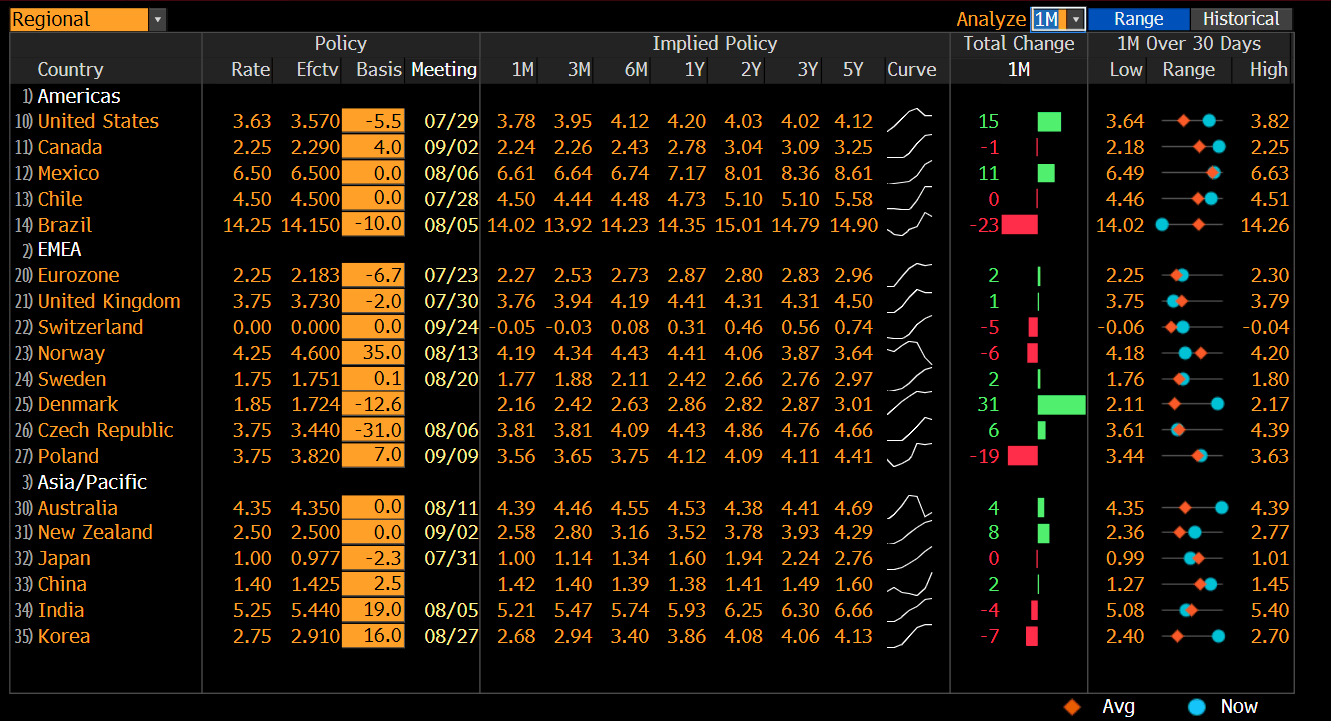
The OIS (overnight index swap) market for 22 July 2026 implies a rate of 0.981 per cent, compared with an effective rate of 0.977 per cent, whilst contracts up to the 18 December meeting are already pricing in a rise to 1.277 per cent – effectively discounting approximately 1.2 rate rises in full. This means that reports of the BOJ’s readiness to accelerate the pace of rate rises come as no surprise to the market – investors began pricing in a more aggressive cycle well ahead of the consensus among economists.
This is also confirmed by the table of 1-month price changes: the cumulative change (“Total Change 1M”) for Japan is zero, which indicates that the market is no longer revising its forecasts upwards, but is instead stabilising following the earlier movement – the “faster pace” is, to a large extent, already behind us in terms of prices. Source: Bloomberg Financial LP
Carry trade remains dominant despite rate rises
The interest rate differential between Japan (1.00%, following a rise to a 31-year high) and the effective US rate (3.63%) remains huge, and the two-year US-Japan yield spread has widened to 285 basis points – its widest level since August last year. Even a potential further 25 bp rate rise would do little to reduce the appeal of this spread, which is fuelling carry trades based on the low cost of yen-denominated financing relative to high-yielding currencies such as the BRL, MXN and AUD.
The fundamental ‘loop’ driving the yen’s weakness
Apart from monetary policy, the yen is suffering from a ‘doom loop’ – Prime Minister Sanae Takaichi’s loose fiscal policy (debt-to-GDP ratio over 200 per cent) combined with the BOJ’s insufficiently tight monetary policy, which is pushing the yield on 10-year JGBs up to 2.90 per cent, the highest level in 30 years. Finance Minister Satsuki Katayama has once again signalled her readiness to take “decisive action” in the foreign exchange market, however, interventions to date (totalling around US$215 billion since 2022) have failed to reverse the trend of yen weakness on a sustained basis, which undermines the credibility of such announcements in the eyes of investors.
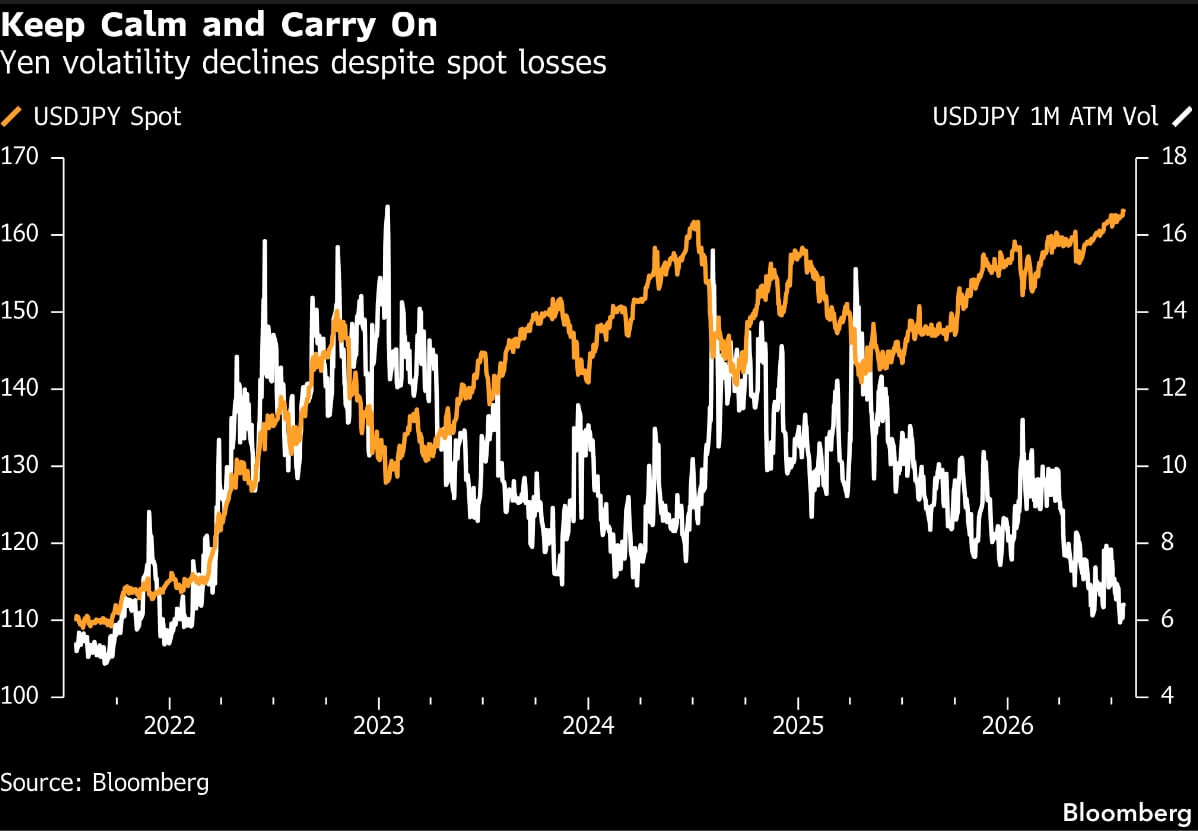
The options market confirms that there are no fears of a shock
The falling 1-month ATM implied volatility for USD/JPY since 2022, despite the deepening weakness in the spot market, suggests that options are not pricing in any significant risk of a sudden reversal – such as a sharp intervention or an unexpected rate hike – but rather a continuation of the current narrative regarding the currency. Source: Bloomberg Financial Lp
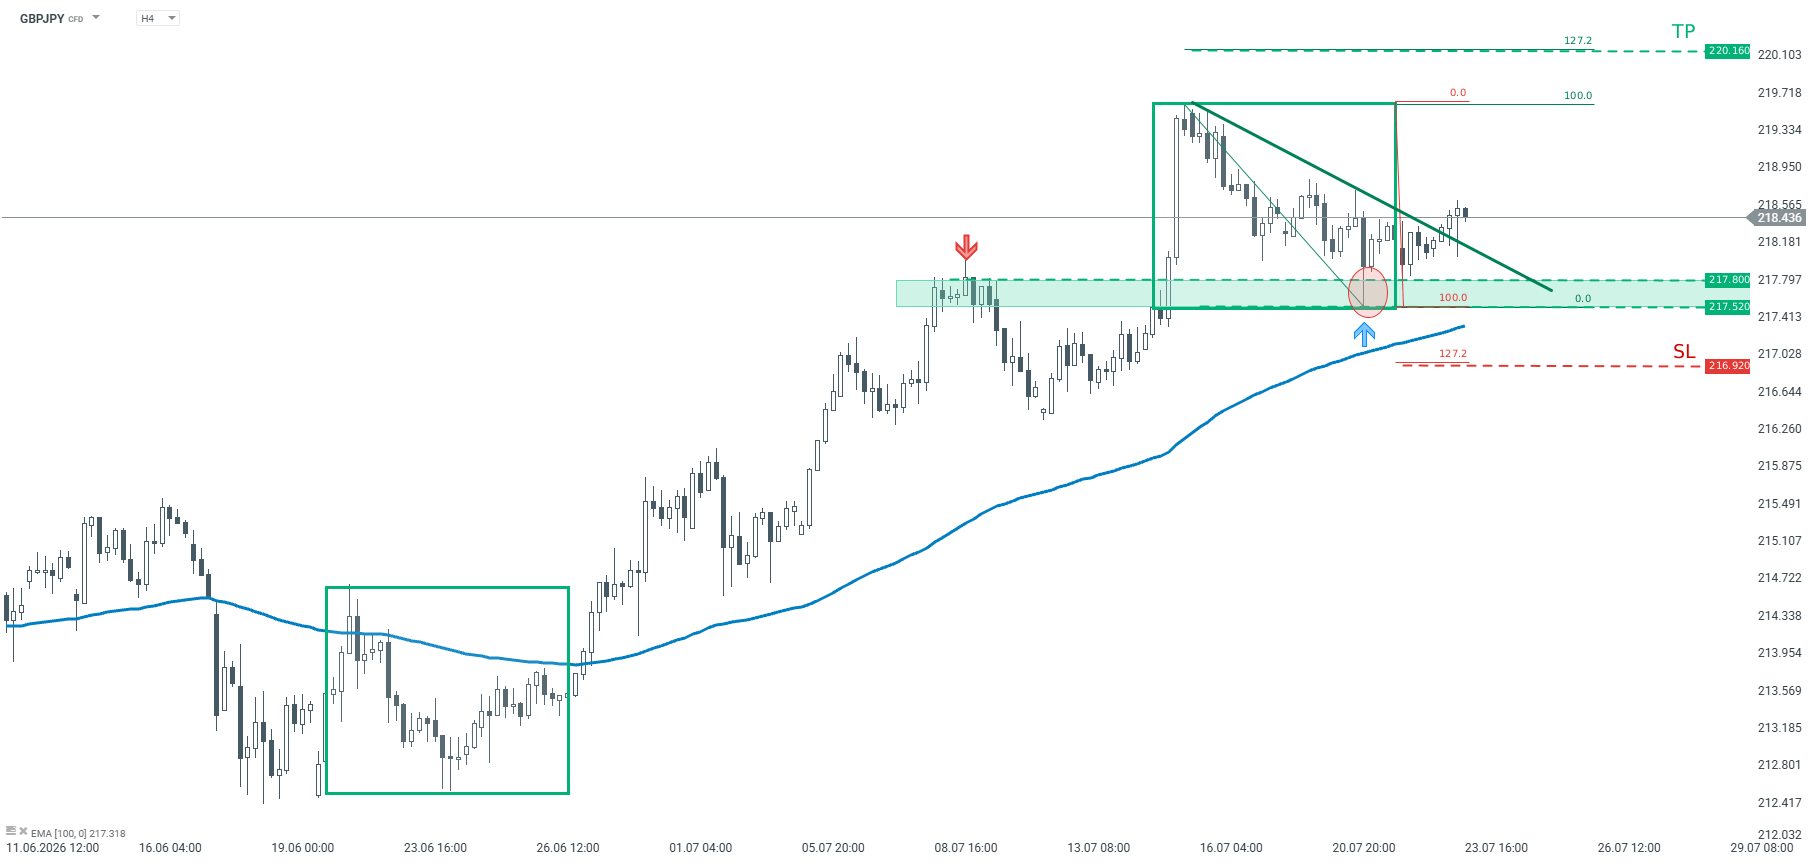
The bounced off the lower limit of 1:1 structure at 217.52
Main trend on the pair remains upward
Recommendation: Trade: Long GBPJPY at market price Target: 220.16 Stop: 216.92
Opinion: Looking at GBPJPY chart, one can observe that the price reached the key technical support on Tuesday. This support is marked with the lower limit of 1:1 structure (green rectangles), as well as previous price reactions. In addition the price sits above the 100-period moving average from the H4 interval. Should buyers manage to hold the price above the support area 217.52-217.80, another upward impulse may be on the cards. We recommend taking a long position on GBPJPY at market price with two targets: 215.85 and 216.30 We recommend placing a stop loss order at 216.92
To provide the best experiences, we use technologies like cookies to store and/or access device information. Consenting to these technologies will allow us to process data such as browsing behavior or unique IDs on this site. Not consenting or withdrawing consent, may adversely affect certain features and functions.
Functional
Always active
The technical storage or access is strictly necessary for the legitimate purpose of enabling the use of a specific service explicitly requested by the subscriber or user, or for the sole purpose of carrying out the transmission of a communication over an electronic communications network.
Preferences
The technical storage or access is necessary for the legitimate purpose of storing preferences that are not requested by the subscriber or user.
Statistics
The technical storage or access that is used exclusively for statistical purposes.The technical storage or access that is used exclusively for anonymous statistical purposes. Without a subpoena, voluntary compliance on the part of your Internet Service Provider, or additional records from a third party, information stored or retrieved for this purpose alone cannot usually be used to identify you.
Marketing
The technical storage or access is required to create user profiles to send advertising, or to track the user on a website or across several websites for similar marketing purposes.