EUR/USD turns positive around 1.1730 as the US Dollar gives back early gains.
Iran prepares to reopen the Hormuz if the US lifts the blockade on Iranian sea ports.
Investors await the Fed-ECB monetary policy announcements.
The EUR/USD pair claws back its early losses and turns positive around 1.1730 during the Asian trading session on Monday. The major currency pair gains as the US Dollar (USD) turns upside down.
During the press time, the US Dollar Index (DXY), which gauges the Greenback’s value against six major currencies, trades 0.06% lower to near 98.45. The USD Index opened significantly higher around 99.35 as the United States (US) canceled a visit to Islamabad for another round of peace talks with Iran, despite Iran’s foreign minister Seyed Abbas Araghchi visiting Pakistan to resume talks.
Meanwhile, Iran has offered a new proposal to the US to reopen the Strait of Hormuz and end the war that includes putting off nuclear negotiations, according to Axios, Bloomberg reported. The report shows that nuclear talks would come later, only after a US blockade of the Strait of Hormuz were lifted. This indicated Iran’s readiness to end the almost two-month-long conflicts in the Middle East.
This week, investors brace for high volatility in the major currency pair as both the Federal Reserve (Fed) and the European Central Bank (ECB) are scheduled to announce monetary policies on Wednesday and Thursday, respectively.
EUR/USD technical analysis
EUR/USD trades marginally higher at around 1.1730 as of writing. The pair holds a constructive near-term bias as it trades above the 20-day exponential moving average (EMA) at 1.1696, suggesting buyers retain control after reclaiming this dynamic support.
The Relative Strength Index (RSI) at 54.9 sits moderately above the 50 line, hinting at firm but not overstretched bullish momentum as price pushes deeper into the upper half of the recent Fibonacci retracement grid.
On the topside, immediate resistance emerges at the 50.0% Fibonacci retracement at 1.1749; a sustained break higher would expose the 61.8% retracement at 1.1828, followed by 1.1941 and the cycle high region near 1.2085. On the downside, initial support is provided by the 20-day EMA at 1.1696, with additional protection at the 38.2% Fibonacci level at 1.1670; a deeper pullback would bring the 23.6% retracement at 1.1572 into view ahead of the structural floor around 1.1413.
Tensions in the Middle East remain elevated, with Brent crude once again trading above $100 per barrel. At the same time, Wall Street appears to be largely ignoring the risk of what could become one of the most significant energy crises in history, continuing to push toward fresh all-time highs. Meanwhile, earnings season is entering a critical phase, with results from major tech giants such as Meta, Microsoft, and Alphabet.
However, markets will not focus solely on geopolitics and Big Tech earnings. Next week will also bring key interest rate decisions from major central banks (Fed, BoJ, BoE, ECB, and BoC). Most institutions are expected to keep policy unchanged, although surprises cannot be ruled out. In this context, investors should closely monitor USDJPY, gold, and the US500 index.
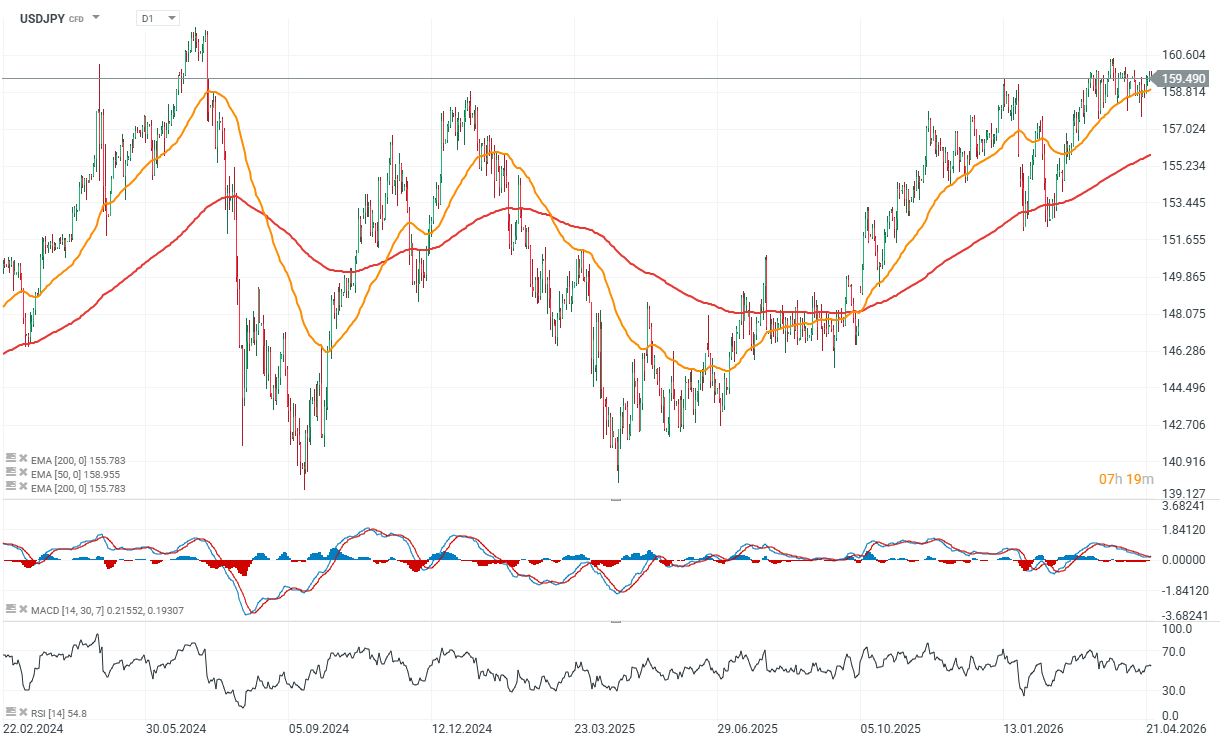
USDJPY
As early as next Tuesday, we will get interest rate decisions from both the Bank of Japan and the Federal Reserve. While not long ago markets were pricing in a possible rate hike in Japan, the country is currently facing significant pressure from rising energy prices, which are weighing on economic conditions. As a result, markets now expect rates to remain unchanged, similarly to the Fed decision scheduled for Wednesday, April 29.
It is also worth noting that this will most likely be Jerome Powell’s final meeting as Chair of the Federal Reserve, although there is still a possibility that his potential successor, Kevin Warsh, may not be confirmed by Congress before May 15. USDJPY remains elevated, with the 160 level continuing to act as a strong resistance zone.
Source: xStation5
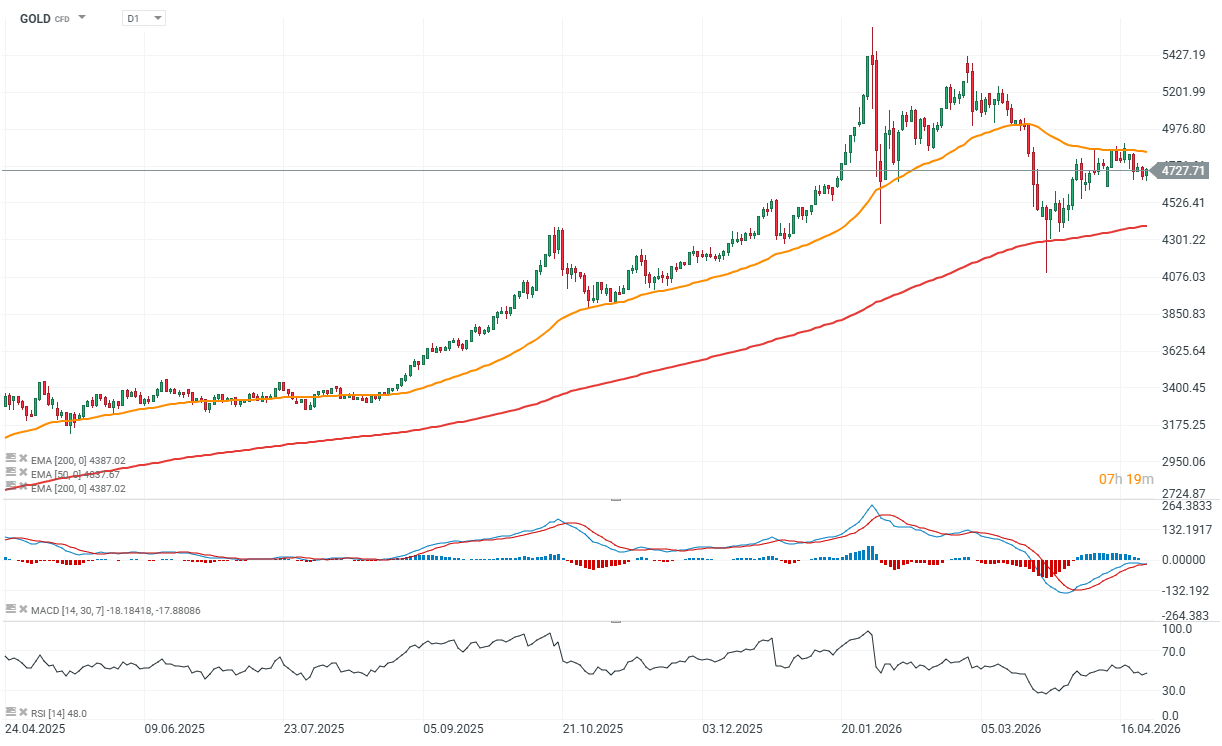
GOLD
The gold market is largely overlooking the broader energy backdrop. This is partly because oil prices, while elevated, are still hovering around $100 per barrel, and a comprehensive agreement between the U.S. and Iran remains distant. At this stage, gold is reacting primarily to expectations around inflation and interest rates. Moderately rising inflation tends to support gold, but a sharp and sustained spike—similar to that seen in the late 1970s and early 1980s—could force a significant repricing of U.S. rate expectations.
Powell’s remarks following the Fed decision will be key, particularly in terms of how the central bank assesses inflation risks. If geopolitical tensions ease and inflation proves transitory, investors may refocus on structural drivers such as high global debt levels and the ongoing diversification of reserves away from the U.S. dollar toward gold.
Source: xStation5
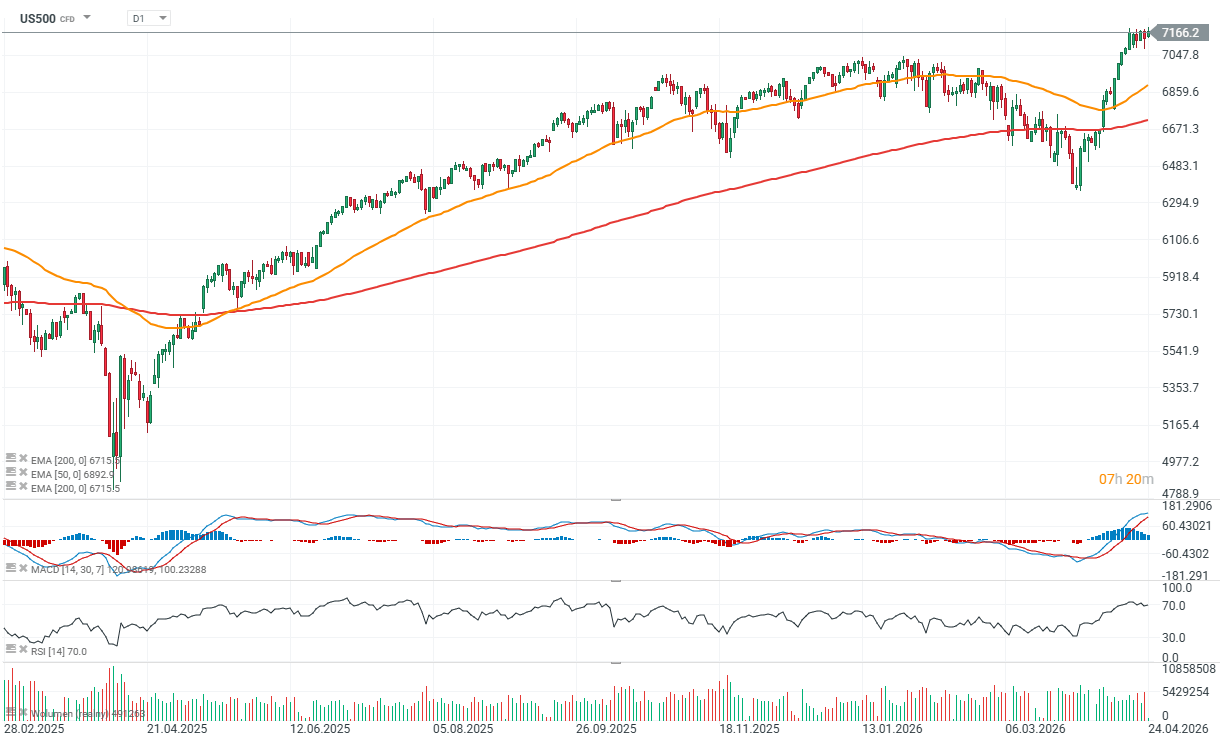
US500
The S&P 500 index and its futures have reached new all-time highs, suggesting that investors are largely dismissing geopolitical risks and focusing instead on expectations of improving economic conditions. So far, earnings results have been strong. Tesla reported both revenue and profit growth, while also pointing to robust long-term prospects in AI and robotics. This week’s results from Meta, Microsoft, and Alphabet will be crucial. These companies are likely to determine whether the AI-driven narrative can continue to push major U.S. indices to even higher levels. All three are scheduled to report after the close of Wednesday’s trading session.
Source: xStation5
The material on this page does not constitute financial advice and does not take into account your level of understanding, investment objectives, financial situation or any other specific needs. All information provided, including opinions, market research, mathematical results and technical analyzes published on the Website or transmitted To you by other means, it is provided for information purposes only and should in no way be construed as an offer or solicitation for a transaction in any financial instrument, nor should the information provided be construed as advice of a legal or financial nature on which any investment decisions you make should be based exclusively To your level of understanding, investment objectives, financial situation, or other specific needs, any decision to act on the information published on the Website or sent to you by other means is entirely at your own risk if you In doubt or unsure about your understanding of a particular product, instrument, service or transaction, you should seek professional or legal advice before trading. Investing in CFDs carries a high level of risk, as they are leveraged products and have small movements Often the market can result in much larger movements in the value of your investment, and this can work against you or in your favor. Please ensure you fully understand the risks involved, taking into account investments objectives and level of experience, before trading and, if necessary, seek independent advice.
The Bank of England is worried about a stock market crash and expects an ‘adjustment’ in equity prices. The Deputy Governor, Sarah Breedon, told the BBC that she did not know when or by how much stocks would fall, but she claimed that macroeconomic risks were not fully priced into stock prices, after US indices hit record highs earlier this week. It doesn’t take a genius to expect a market correction at some point; there have always been market corrections for as long as trading has existed. Breedon is also the head of Financial Stability at the BOE, so it is her job to worry about these issues. However, should investors be worried too?
BOE paid to worry about market risks
Breedon flagged a few issues that were keeping her ‘awake at night’. These include: the energy price spike caused by the events in the Middle East, and a private credit crunch. The latter is not the same as the banking credit crunch of 2008, but the scale of the private markets has been noted by the BOE. The private credit markets are now worth more than $500bn, and Breedon is concerned that its resilience to economic downturns has not been tested. The BOE is still concerned about US tech stocks, in particular, their extremely high valuations and the amount of money companies such as Microsoft, Meta and Amazon are investing into AI. Breedon notes that AI stocks are extremely expensive, and if there is a macroeconomic shock then these valuations could mean that tech stocks fall sharply. For those who have just funded their stocks and shares ISA, a BOE official talking about a stock market crash is alarming. It is worth breaking down Breedon’s concerns to assess what they mean for the near term.
Energy price spike and the risk to the global economy
All Breedon’s concerns are valid, and it is her job to manage the risks that could impact asset prices. Her first concern around the Middle East crisis and the energy price spike is completely out of any individual investors’ control. No one can say when the Strait of Hormuz will reopen or when the oil price will fall back to pre-war norms. We know that the price of oil is damaging for businesses, from airlines to supermarkets, that must shoulder higher costs. This could lead to lower consumption and lower profits for these companies in the future. On the other hand, energy prices could normalize in the coming months if the war ends. The trouble is, we don’t know what will happen between Iran and the US next. However, there are some strategies to help you deal with this risk. The first is to stay invested. Very few people see this war as dragging on for years. If you invest in stocks and shares, then you should think about holding them for the long term so that you can ride the ups and downs of the global economy.
The costs of not holding stocks
Secondly, although it can feel like a complex environment to hold stocks, you must compare this to the impact of keeping your money in cash. It is a myth to think that cash is a safe investment, especially when inflation is rising. In March, UK CPI rose to 3.3%, if you keep your money in a cash account with a lower interest rate than the inflation rate, this means that in real terms your money is losing value every year. In contrast, UK and US stock markets are posting positive gains so far this year. The main US index is higher by 3%, while the FTSE 100 is up 4.7%. This is something that also needs to be considered when talking about stock market risks.
Is an AI bubble on the cards?
Regarding AI and tech concerns, AI stocks have been in focus in recent months, and it is true that they are trading at huge valuations. Four of the five of the world’s biggest companies are linked to AI. Nvidia, the world’s most highly valued company, it is worth $4.85 trillion, makes the chips for AI, while Alphabet, Microsoft and Amazon are hyperscalers who have invested hundreds of billions of dollars into AI in recent years. These companies’ stock prices have risen by a huge amount, in five years Nvidia’s stock price is higher by 1200%, but earnings have also been high.
Next week, Microsoft is set to announce revenues of $81.4bn for the first three months of the year, a 16% increase in 12 months. Nvidia is expected to breach the $500bn revenue threshold by 2028. Although some debt has been issued by the likes of Microsoft, Amazon and Meta, have mostly fueled their AI spending without debt, and this means that if there is a stock market adjustment like Breedon warns, it may not cause financial strain like we saw in the aftermath of 2008. Breedon is right to be concerned about AI. Revenue generated from AI is expected to hit $50bn in the US this year, on the back of $1 trillion in investment.
AI investment now counts for a large amount of US economic activity, about 1.6% of GDP in 2026, which means that any retrenchment in AI spending could cause economic headwinds. Concerns about private credit are also valid at this stage. It is a relatively new market, and there is concern that private credit funds have poured funds into data centers and other AI investments that could turn sour. There are lots of ‘what if’ scenarios to consider, but it can be more effective to look at the data. In Q1, Fitch Ratings said that the default rate for the US private debt markets was on an upward trend at 5.8% in January, up from 5.6% in December.
Fitch pointed out that while default rates are rising, they remain concentrated and are not broad based. However, it is worth noting that an economic recession caused by the energy price spike could prove to be a significant test for the private credit industry. Overall, while worry is warranted, panic is not justified at this stage. It is the BOE’s job to monitor these events and try and mitigate any negative effects from the worst case scenario playing out. But the truth is, the worst case does not always play out, and expecting it to can impact portfolio returns.
The material on this page does not constitute financial advice and does not take into account your level of understanding, investment objectives, financial situation or any other specific needs. All information provided, including opinions, market research, mathematical results and technical analyzes published on the Website or transmitted To you by other means, it is provided for information purposes only and should in no way be construed as an offer or solicitation for a transaction in any financial instrument, nor should the information provided be construed as advice of a legal or financial nature on which any investment decisions you make should be based exclusively To your level of understanding, investment objectives, financial situation, or other specific needs, any decision to act on the information published on the Website or sent to you by other means is entirely at your own risk if you In doubt or unsure about your understanding of a particular product, instrument, service or transaction, you should seek professional or legal advice before trading. Investing in CFDs carries a high level of risk, as they are leveraged products and have small movements Often the market can result in much larger movements in the value of your investment, and this can work against you or in your favor. Please ensure you fully understand the risks involved, taking into account investments objectives and level of experience, before trading and, if necessary, seek independent advice.
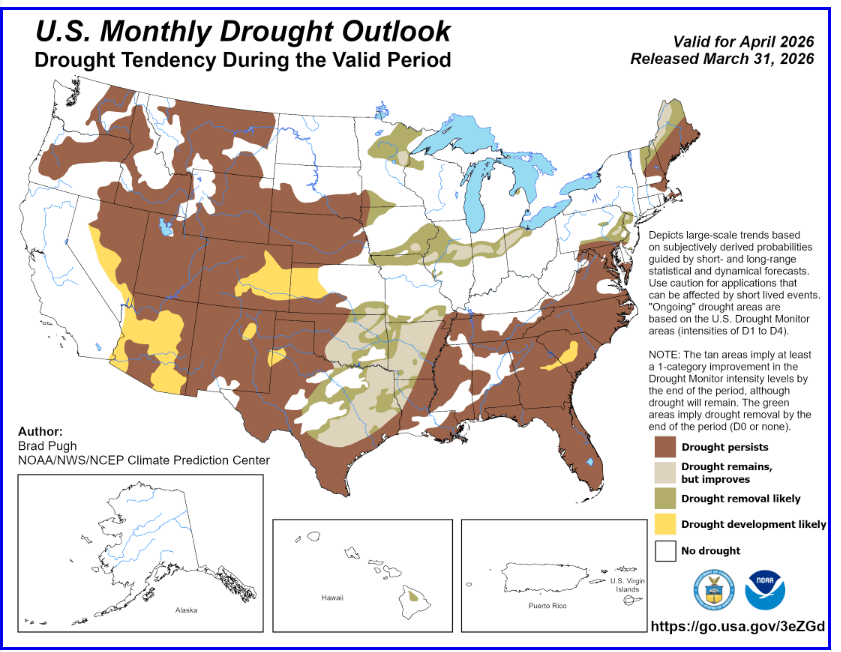
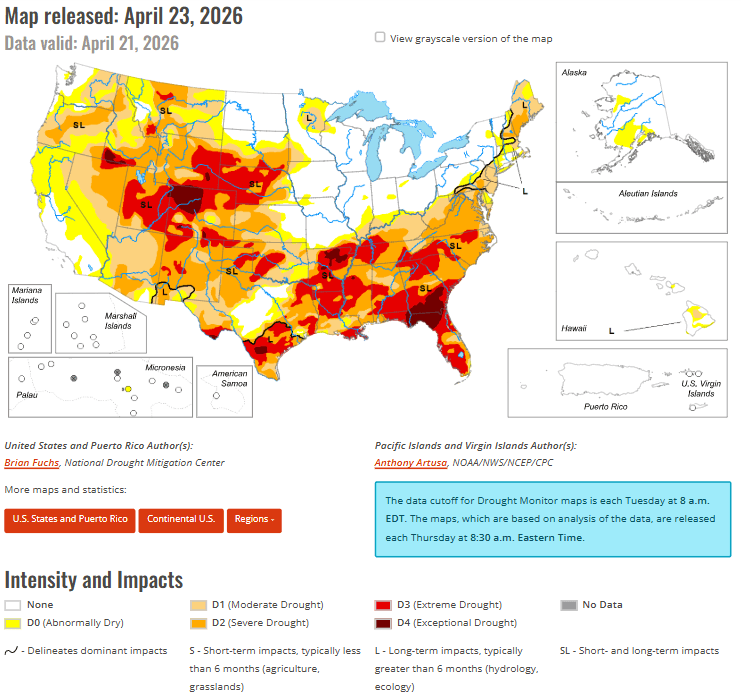
Futures on wheat, corn, and soybeans traded on the Chicago Board of Trade (CBOT) have moved higher in recent weeks. According to NOAA weather reports, significantly above-average temperatures and below-average precipitation in March led to the expansion and intensification of drought conditions across the western United States and the Great Plains. Drought is expected to persist across the western regions through April, with further development most likely in parts of Arizona and Nevada.
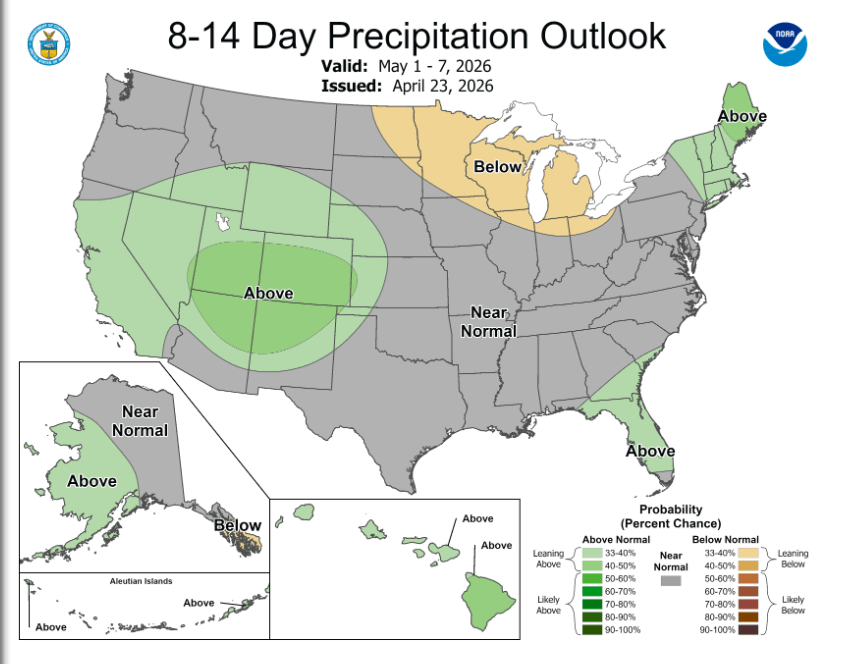
A wet start to the month may delay widespread drought development in the Pacific Northwest, the Northern Intermountain West, and northern California. However, drought expansion is still expected in these regions later in the spring.
Drought development is forecast for eastern Colorado, western Kansas, northeastern New Mexico, and the Texas Panhandle.
In contrast, improvement or easing of drought conditions is more likely in eastern Oklahoma, central to northeastern Texas, northwestern Louisiana, the Ozarks region, and the Midwest
In the southeastern United States, drought is expected to persist and potentially intensify, while in parts of the Northeast, conditions are more likely to improve or be fully alleviated.
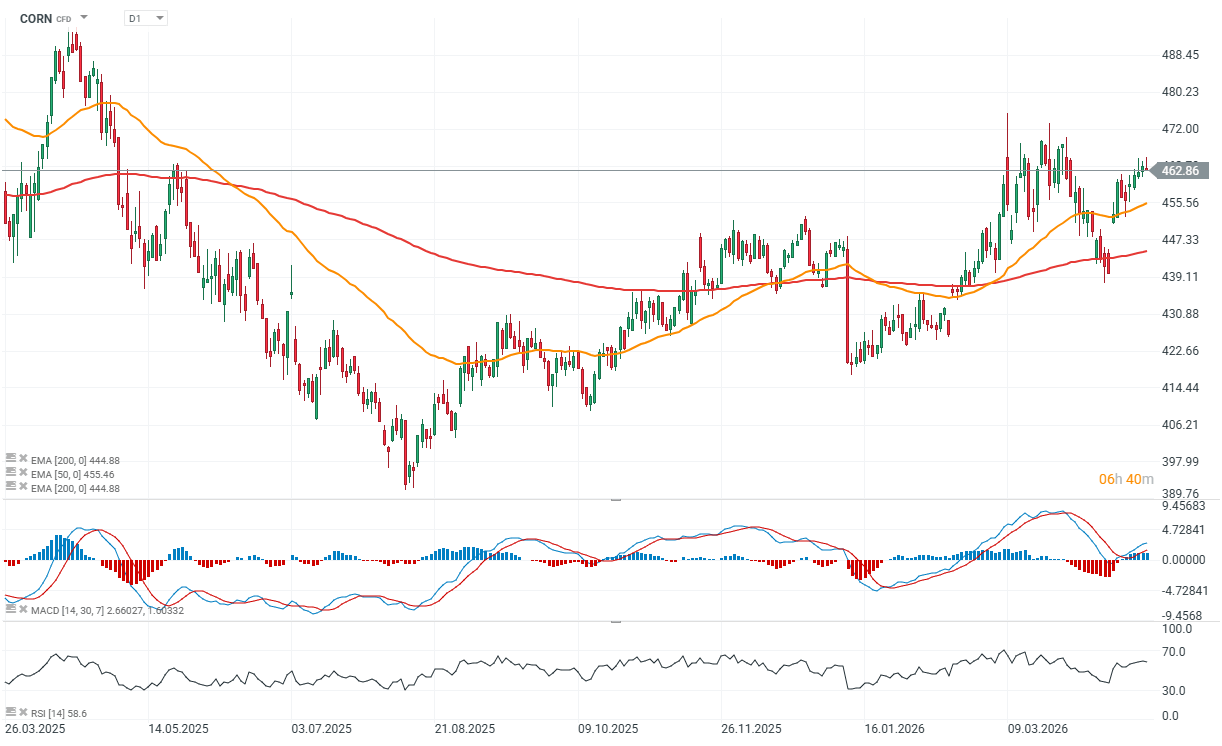
The corn market is starting the session on a stable footing after pulling back from recent highs. Importantly, the short-term structure remains constructive, with prices forming higher lows across most recent sessions, suggesting underlying demand is still present, albeit without strong momentum. The past two weeks have brought gradual but consistent gains, supporting the bullish case. Key drivers include concerns over soil moisture in the U.S. Midwest and the potential for reduced acreage, alongside solid export demand, which continues to cushion downside moves.
That said, the weather outlook remains mixed. Conditions have improved in parts of the central and eastern Corn Belt, but western regions and the southeastern U.S. remain dry. The share of corn affected by drought has risen to 27% (vs. 26% a year ago), which is beginning to matter for the market. Rainfall is expected across the Plains and Midwest in the coming days, potentially improving crop conditions in the short term, although cooler temperatures may slow fieldwork. In South America, the picture is also mixed—harvests in Argentina are progressing, while Brazil faces hot and dry conditions in key safrinha regions, which could impact supply in the weeks ahead. Globally, the International Grains Council has cut its corn production forecast by 3 million tonnes to 1.3 billion tonnes, signaling emerging cost pressures in the agricultural sector.
Exports – solid, but need to accelerate
Export data remains decent, though not strong enough to shift sentiment decisively. For the week ending April 16:
1.316 million tonnes were sold for the current marketing year
440,000 tonnes for the next marketing year
This brings total sales to 1.76 million tonnes. Cumulative exports have reached 88.4% of the USDA forecast, slightly above the 5-year average of 87.3%. However, weekly sales need to average around 496,000 tonnes to meet the annual target.
Key levels and baseline scenario
From a trading perspective, the structure remains relatively clear:
support for July contract: around 450
support for December contract: 478 , with a secondary level at 456
resistance for July contract: 468–472
The market appears to be stabilizing with a slight bullish bias, but lacks a strong catalyst for a breakout. Pullbacks are likely to find support in fundamentals, particularly export demand and weather uncertainty. In short: fundamentals are not decisively bullish, but strong enough to limit deeper declines. The market remains in a “waiting for a catalyst” phase.
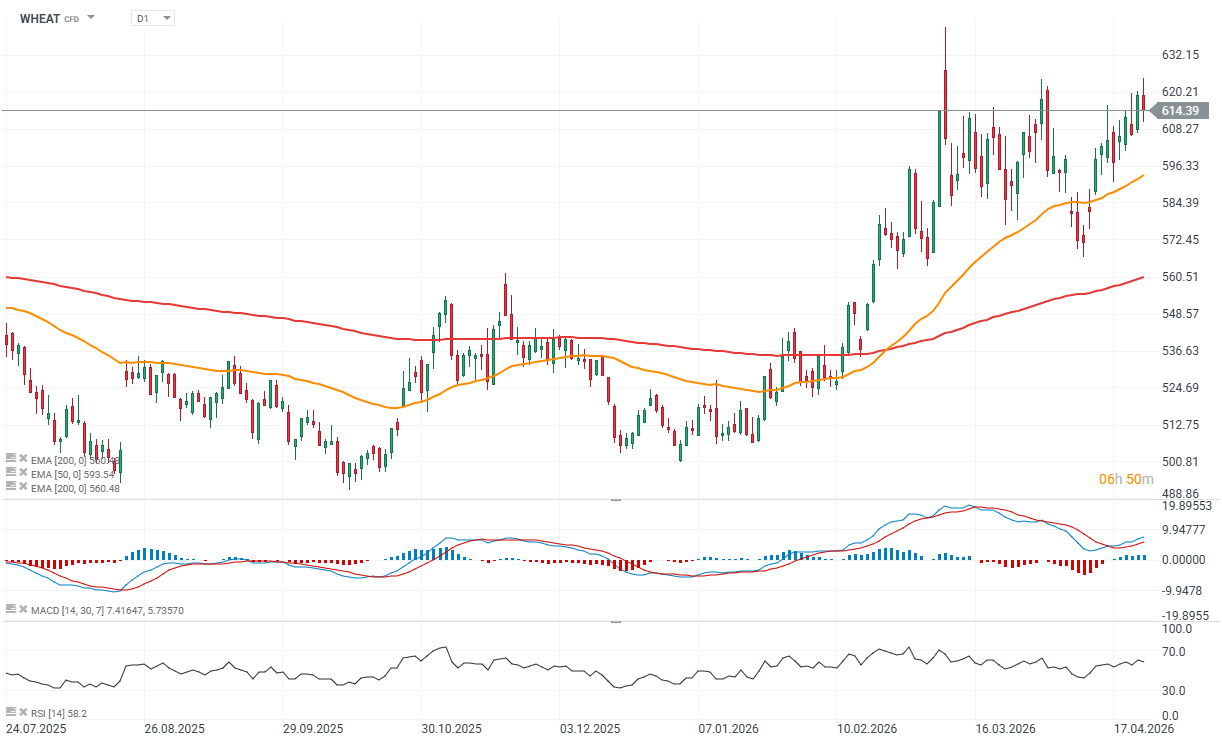
Wheat is pulling back after sharp gains, particularly in Kansas contracts. This looks more like a correction than a trend reversal, as updated weather models show rainfall across much of the Plains (excluding the far Southwest), temporarily easing the weather premium. However, crop damage has likely already occurred, and even improved conditions may not significantly restore yields. As such, the current pullback appears technical rather than fundamentally driven.
Global fundamentals – tight supply remains key
The main supportive factor remains unchanged: weaker global production prospects. Lower planted acreage is expected not only in the U.S., but also in Ukraine, Argentina, Australia, France, and Zimbabwe. The International Grains Council has reduced its global production forecast by another 1 million tonnes to 821 million tonnes, and further downward revisions are possible. This keeps supply tight and supports prices in the medium term.
Geopolitics and costs – underlying support
Geopolitical tensions continue to play a role. Ongoing disruptions and risks to trade routes suggest that energy and fertilizer costs are unlikely to decline meaningfully in the near term. This directly impacts production costs and limits supply expansion, effectively acting as a floor for prices.
Export demand – steady but not aggressive
Export activity remains moderate. For the week ending April 16:
129,000 tonnes were sold for the current season
8,000 tonnes for the next season
Totaling 137,000 tonnes, cumulative sales have reached 100.1% of the USDA forecast (vs. 92.8% 5-year average), meaning export targets have effectively already been met. There are also reports of U.S. buyers sourcing Polish milling wheat due to relatively high domestic prices, indicating active global trade flows.
Correction within an uptrend
In market terms, this is a classic scenario: a short-term pullback driven by improved weather forecasts, while underlying fundamentals remain supportive. The market continues to price in weather risk, and any deterioration in conditions or further supply cuts could quickly reignite upward pressure.
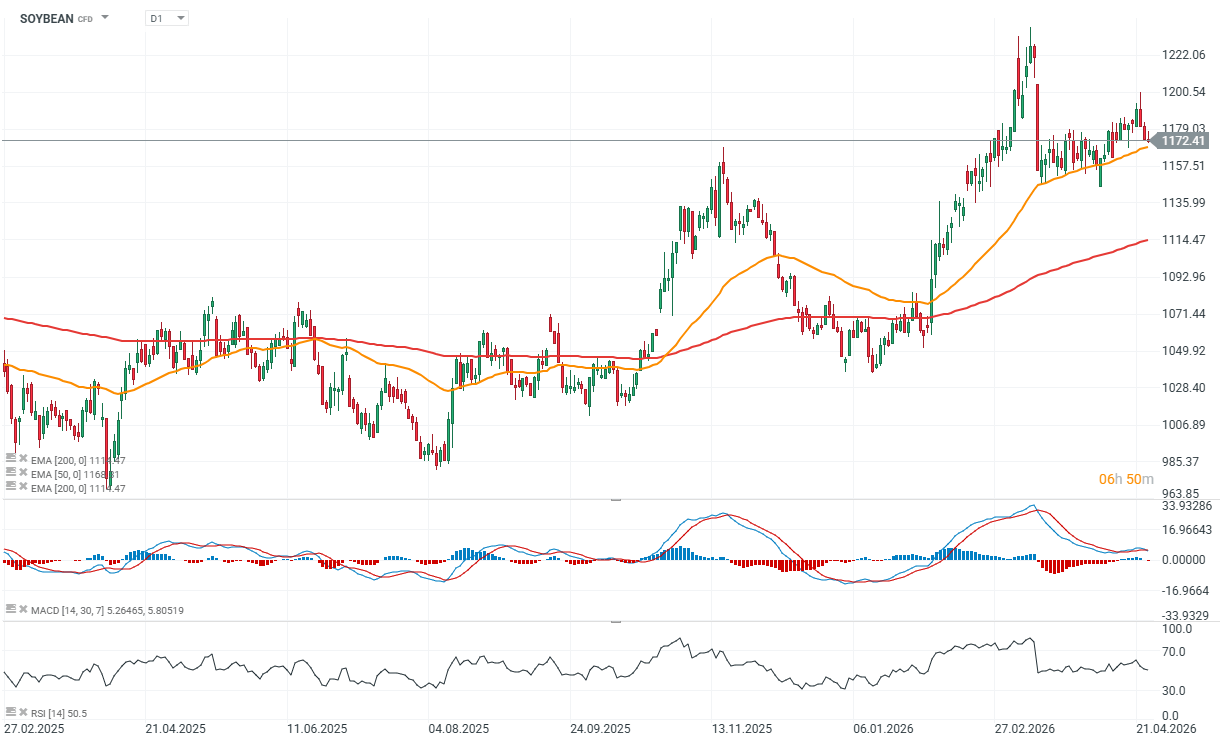
The soybean market continues to weaken following Wednesday’s reversal, with the short-term technical picture deteriorating. Bullish momentum has faded, as earlier supportive factors—such as potential acreage declines, drought concerns, and the end of the Brazilian harvest—are no longer sufficient. Argentina’s harvest is progressing, and U.S. weather conditions are generally better than a year ago, with a larger share of drought-free areas. Forecasted rainfall across the Midwest and Plains may slow fieldwork but improve crop conditions, reducing perceived risk.
Fund positioning and technical pressure
Recent declines were driven primarily by long liquidation, especially in beans and meal. Funds still hold significant long positions across the soybean complex, but the failure to break higher and the rejection of resistance have shifted the balance toward the bears. Technically, the market looks weaker, with fading momentum and no clear support emerging. In the near term, capital flows and positioning matter more than fundamentals.
Exports – no clear catalyst Export data remains mixed:
Soybeans : 364,000 tonnes sold + 5,000 tonnes for next season (91.9% of USDA forecast vs. 93.9% 5-year average; needs ~173,000 tonnes weekly)
Soybean meal : 162,000 tonnes sold (with slight downward revisions) (79.9% vs. 74.6% average; needs ~148,000 tonnes weekly)
Overall, there is still no strong demand signal to shift sentiment. Market outlook: downside risk building Technically, the market is weakening, with July contracts potentially testing the lower boundary around 1160 . A break below this level could trigger a deeper sell-off, particularly if funds accelerate long liquidation. Declining open interest suggests this process may already be underway. That said, weather remains a key wildcard—any renewed deterioration could quickly shift sentiment back in favor of the bulls.
Source: xStation5
The material on this page does not constitute financial advice and does not take into account your level of understanding, investment objectives, financial situation or any other specific needs. All information provided, including opinions, market research, mathematical results and technical analyzes published on the Website or transmitted To you by other means, it is provided for information purposes only and should in no way be construed as an offer or solicitation for a transaction in any financial instrument, nor should the information provided be construed as advice of a legal or financial nature on which any investment decisions you make should be based exclusively To your level of understanding, investment objectives, financial situation, or other specific needs, any decision to act on the information published on the Website or sent to you by other means is entirely at your own risk if you In doubt or unsure about your understanding of a particular product, instrument, service or transaction, you should seek professional or legal advice before trading. Investing in CFDs carries a high level of risk, as they are leveraged products and have small movements Often the market can result in much larger movements in the value of your investment, and this can work against you or in your favor. Please ensure you fully understand the risks involved, taking into account investments objectives and level of experience, before trading and, if necessary, seek independent advice.
Break below 0.7800 exposes 0.7775 and 0.7748 support levels.
USD/CHF dropped on Friday but finished the week with gains of over 0.35%, trading at 0.7841 as market participants grew confident that US-Iran talks could resume over the weekend to resolve the conflict.
USD/CHF Price Forecast: Technical Outlook
From a technical perspective, USD/CHF appears poised to remain in a consolidation within the 0.7800-0.7900 range. Momentum, as measured by the Relative Strength Index (RSI), suggests further downside, as the index is bearish and pointing lower.
Price action suggests the uptrend might be pausing after hitting a nine-day high of 0.7877, but closing near the 50-day SMA at 0.7840 and failing to clear key resistance at the 100-day SMA at 0.7863 open the door to further downside.
If market mood remains optimistic, the USD/CHF could test lower levels, with the first area of interest at 0.7800. On further weakness, April 17 low of 0.7775 ─the last cycle low─, would be the next key support ahead of clearing the path towards the March 10 daily log of 0.7748, ahead of February’s 27 daily low of 0.7672.
On the other hand, if buyers reclaim the 100-day SMA, the next line of resistance would be the 0.7900 mark. A breach of the latter will expose the 200-day SMA at 0.7936 ahead of 0.8000.
USD/CHF Price Chart – Daily
USD/CHF daily chart
Swiss Franc Price This week
The table below shows the percentage change of Swiss Franc (CHF) against listed major currencies this week. Swiss Franc was the strongest against the Japanese Yen.
USD
EUR
GBP
JPY
CAD
AUD
NZD
CHF
USD
0.15%
-0.35%
0.35%
-0.14%
-0.38%
-0.34%
0.43%
EUR
-0.15%
-0.51%
0.00%
-0.27%
-0.52%
-0.56%
0.28%
GBP
0.35%
0.51%
2.17%
0.26%
0.02%
-0.02%
0.79%
JPY
-0.35%
0.00%
-2.17%
-0.51%
-0.67%
-0.71%
0.04%
CAD
0.14%
0.27%
-0.26%
0.51%
-0.13%
-0.21%
0.55%
AUD
0.38%
0.52%
-0.02%
0.67%
0.13%
0.02%
0.79%
NZD
0.34%
0.56%
0.02%
0.71%
0.21%
-0.02%
0.77%
CHF
-0.43%
-0.28%
-0.79%
-0.04%
-0.55%
-0.79%
-0.77%
The heat map shows percentage changes of major currencies against each other. The base currency is picked from the left column, while the quote currency is picked from the top row. For example, if you pick the Swiss Franc from the left column and move along the horizontal line to the US Dollar, the percentage change displayed in the box will represent CHF (base)/USD (quote).
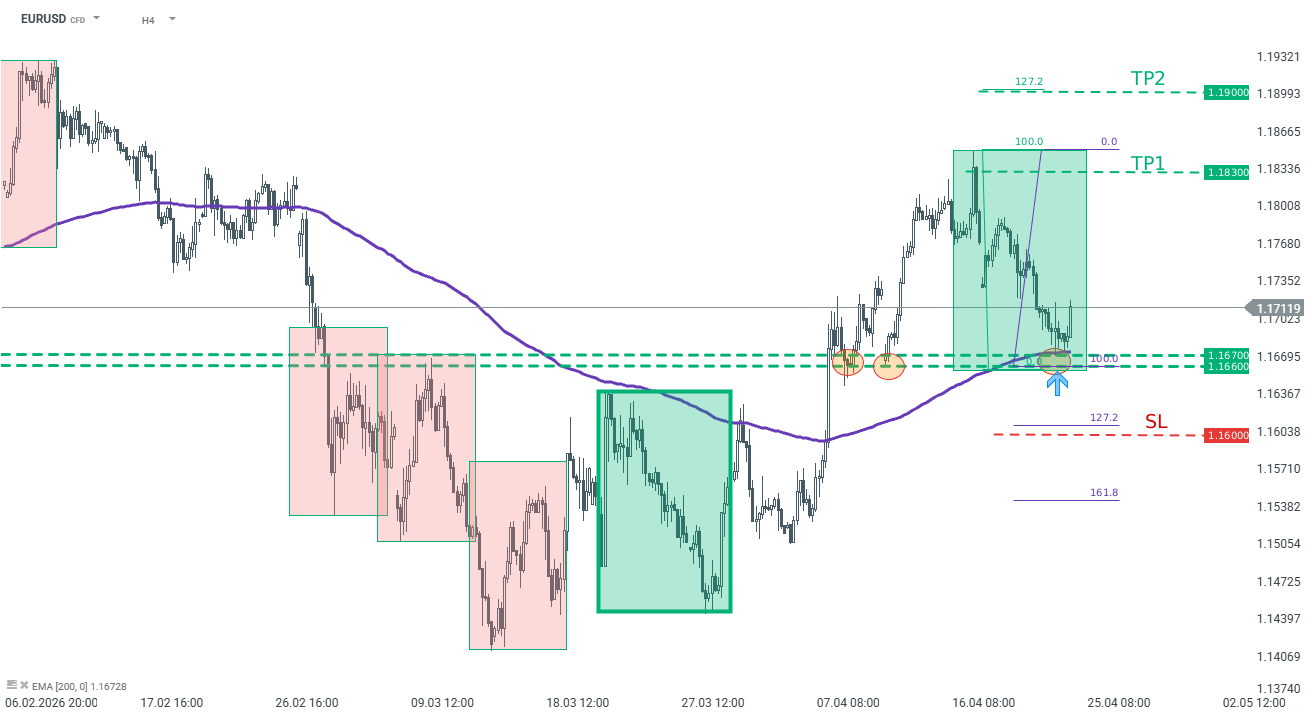
Facts: The pair bounced off the key technical support near 1.1660 Mid-term trend remains upward Recommendation: Trade: Long position on EURUSD at market price Target: 1.1830, 1.1900 Stop: 1.1600
Opinion : EURUSD has been trading in an upward trend recently. Looking at the H4 interval, one can see that the recent downward correction reached the key support, where buyers appeared .The area 1.1660-1.1670 is marked with previous price reactions, 200-period moving average, as well as lower limit of 1:1 structure. According to the classic technical analysis and Overbalance methodology, continuation of the upward move looks to be the base case scenario. We recommend going long EURUSD at market price with two targets: 1.1830 and 1.1900. We also recommend placing a stop loss order at 1.1600. Source: xStation5
USD/CAD may fall toward the descending channel support at 1.3560.
The 14-day Relative Strength Index falls to 44, signaling strengthening bearish momentum.
The immediate barrier lies at the nine-day EMA of 1.3714.
USD/CAD continues its winning streak for the fourth successive day, trading around 1.3710 during the early European hours on Friday. However, the technical analysis of the daily chart indicates the pair is remaining within the descending channel pattern, signaling a persistent bearish bias.
The USD/CAD pair holds a modest bearish near-term bias as spot remains capped under the nine-day Exponential Moving Average (EMA) and the 50-day EMA. The pair has been fading from last month’s highs while the 14-day Relative Strength Index (RSI) slips to 44, hinting at strengthening bearish momentum and leaving the downside vulnerable as long as price trades beneath these overlapping EMA barriers.
On the downside, the USD/CAD pair may navigate the region around the lower boundary of the descending channel around 1.3560. A sustained break below the channel would reinforce the bearish bias and put downward pressure on the pair to fall toward 1.3473, the lowest since September 2024.
The immediate barrier lies at the nine-day EMA of 1.3714, followed by the 50-day EMA at 1.3750, aligned with the upper descending channel boundary. Further advances above this confluence resistance zone would cause the emergence of the bullish bias and support the USD/CAD pair to explore the region around the four-month high of 1.3967, reached in December 2025.
USD/CAD: Daily Chart
Canadian Dollar Price Today
The table below shows the percentage change of Canadian Dollar (CAD) against listed major currencies today. Canadian Dollar was the weakest against the Japanese Yen.
USD
EUR
GBP
JPY
CAD
AUD
NZD
CHF
USD
0.06%
0.04%
-0.03%
0.08%
0.10%
0.12%
0.16%
EUR
-0.06%
-0.01%
0.00%
0.03%
0.03%
0.06%
0.10%
GBP
-0.04%
0.00%
-2.13%
0.04%
0.06%
0.09%
0.11%
JPY
0.03%
0.00%
2.13%
0.11%
0.12%
0.14%
0.17%
CAD
-0.08%
-0.03%
-0.04%
-0.11%
0.00%
0.02%
0.07%
AUD
-0.10%
-0.03%
-0.06%
-0.12%
0.00%
0.01%
0.05%
NZD
-0.12%
-0.06%
-0.09%
-0.14%
-0.02%
-0.01%
0.04%
CHF
-0.16%
-0.10%
-0.11%
-0.17%
-0.07%
-0.05%
-0.04%
The heat map shows percentage changes of major currencies against each other. The base currency is picked from the left column, while the quote currency is picked from the top row. For example, if you pick the Canadian Dollar from the left column and move along the horizontal line to the US Dollar, the percentage change displayed in the box will represent CAD (base)/USD (quote).
What is the technical outlook for AUDCAD, NZDUSD, and USDJPY?
This analysis from the Overbalance series aims to identify three financial instruments, analyzed primarily on the daily/four-hour (D1/H4) timeframe. The analysis uses only the Overbalance methodology, which helps determine where a trend may continue or where a reversal might occur. Today’s analysis covers three instruments, evaluated solely in terms of 1:1 correction structures.
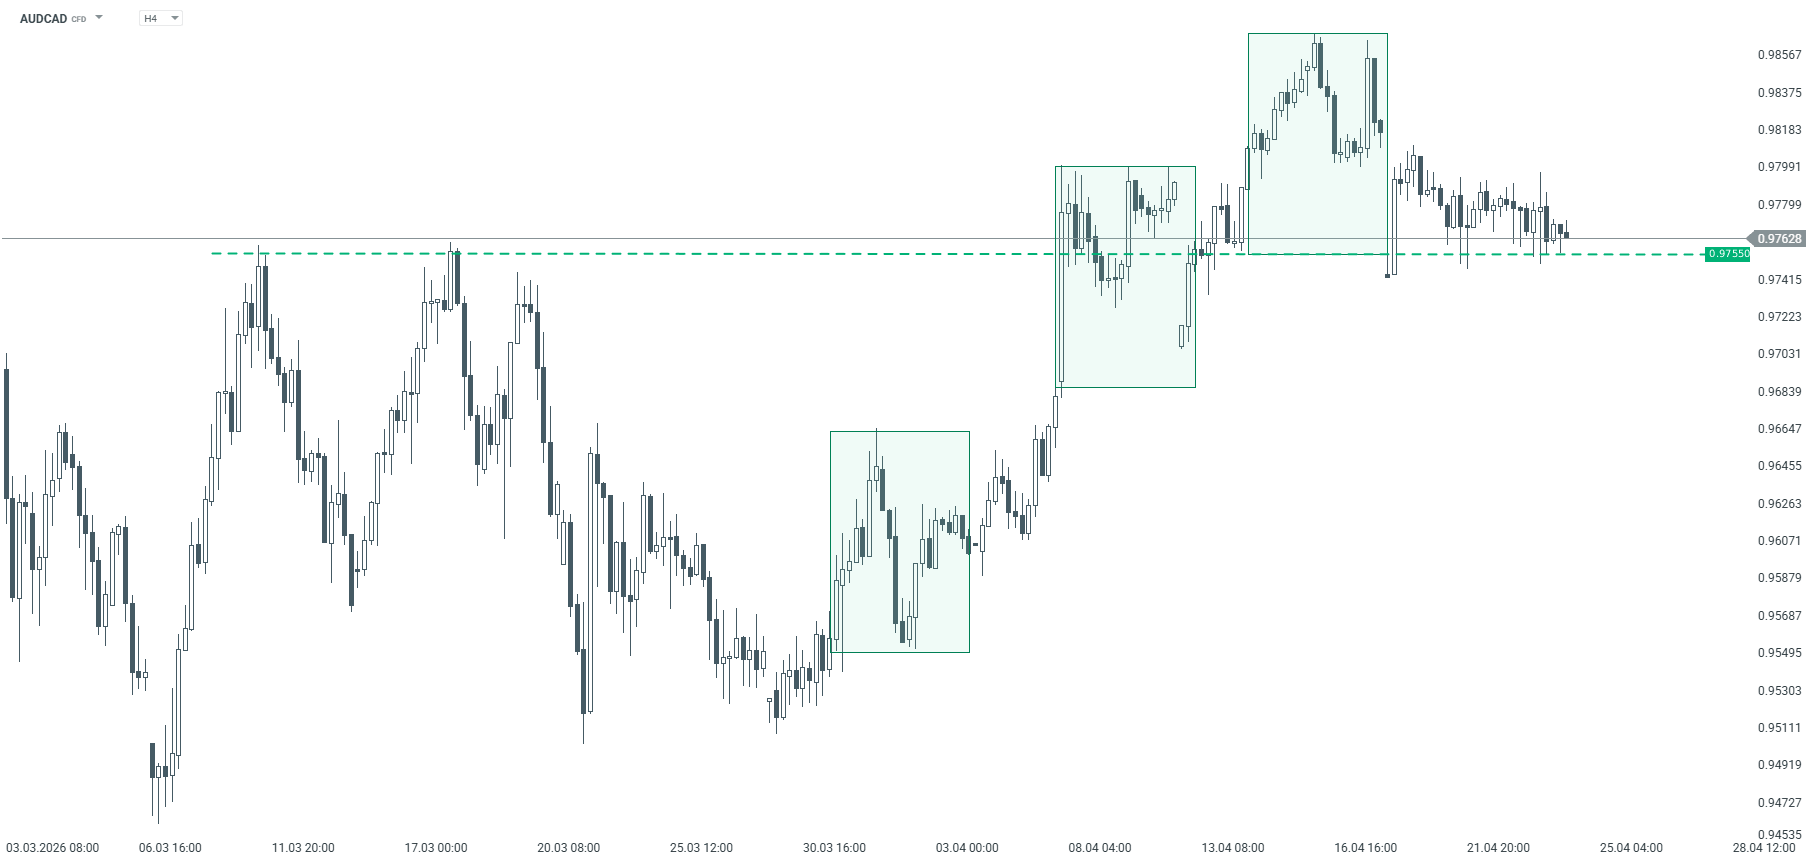
AUDCAD
Since late March, AUDCAD has been trending upward. The key level remains the support at 0.9755, which stems from the lower boundary of the local 1:1 pattern, as well as from previous local peaks. According to the Overbalance methodology, as long as the price remains above this level, the uptrend remains in effect. However, it is worth noting the lack of a clear demand reaction—further tests of this support level could weaken it, increasing the risk of a breakout to the downside. Therefore, the 0.9755 level is critical in the short term for the direction of the market.
AUDCAD – H4 timeframe. Source: xStation
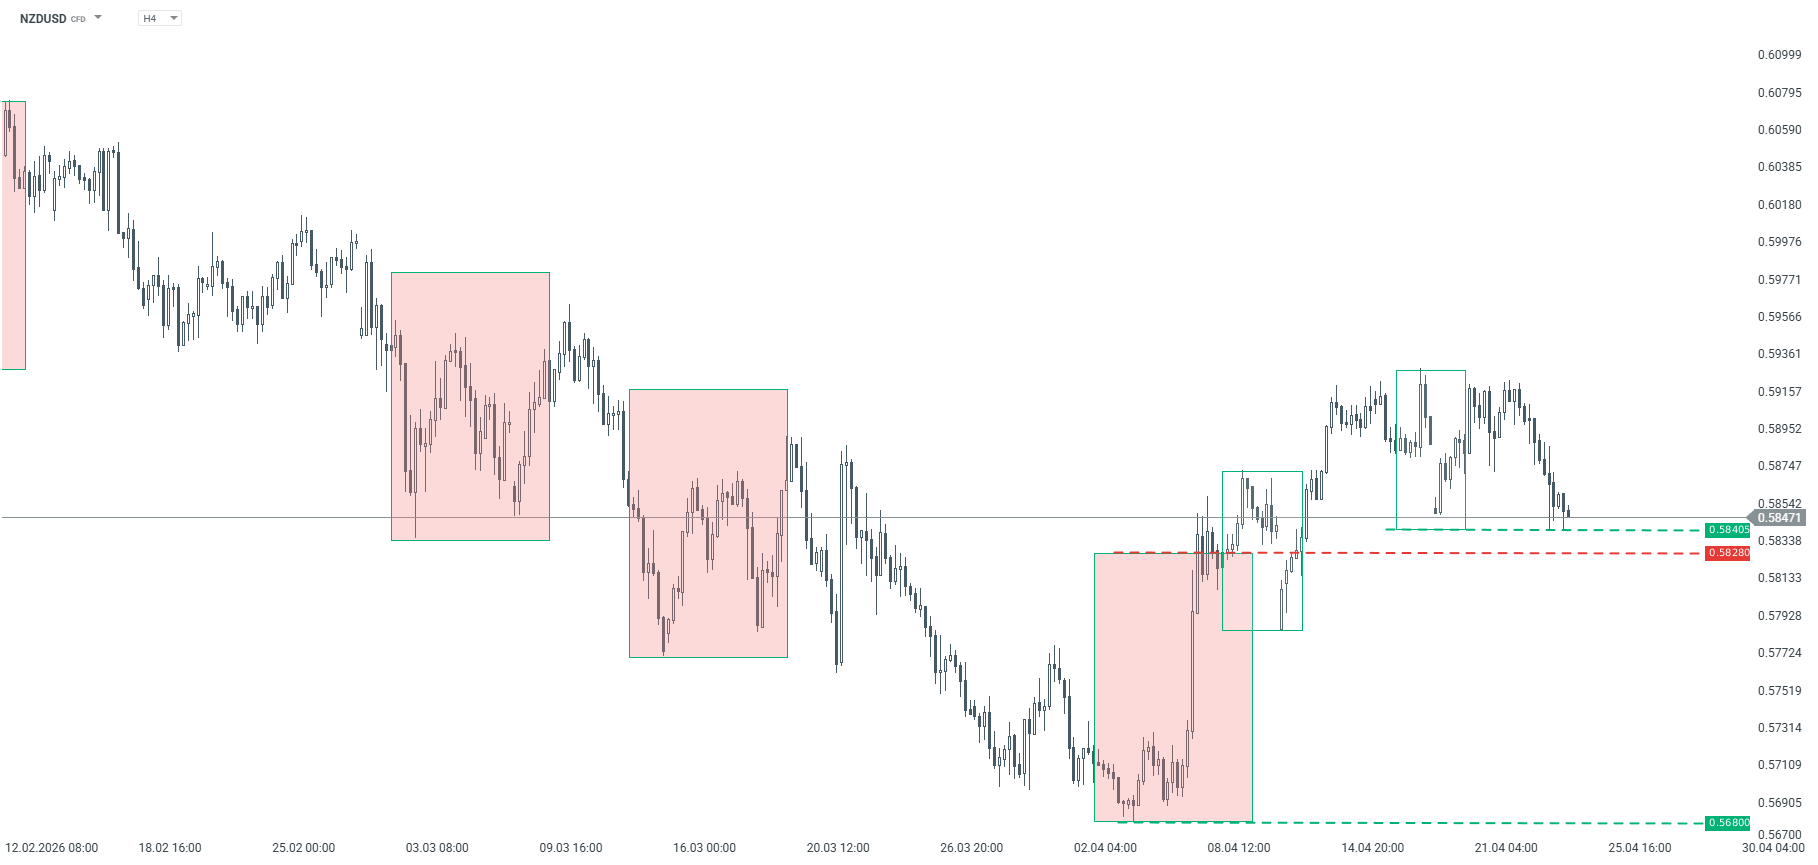
NZDUSD
Since early April, the NZDUSD pair has been trending upward, but the market is currently testing key support at the 0.5840 level. Holding this level could trigger another upward move. Conversely, a break below this level and a return below 0.5828 could pave the way for a resumption of the downward trend. The current levels are therefore crucial for determining the short-term direction.
NZDUSD – H4 chart. Source: xStation
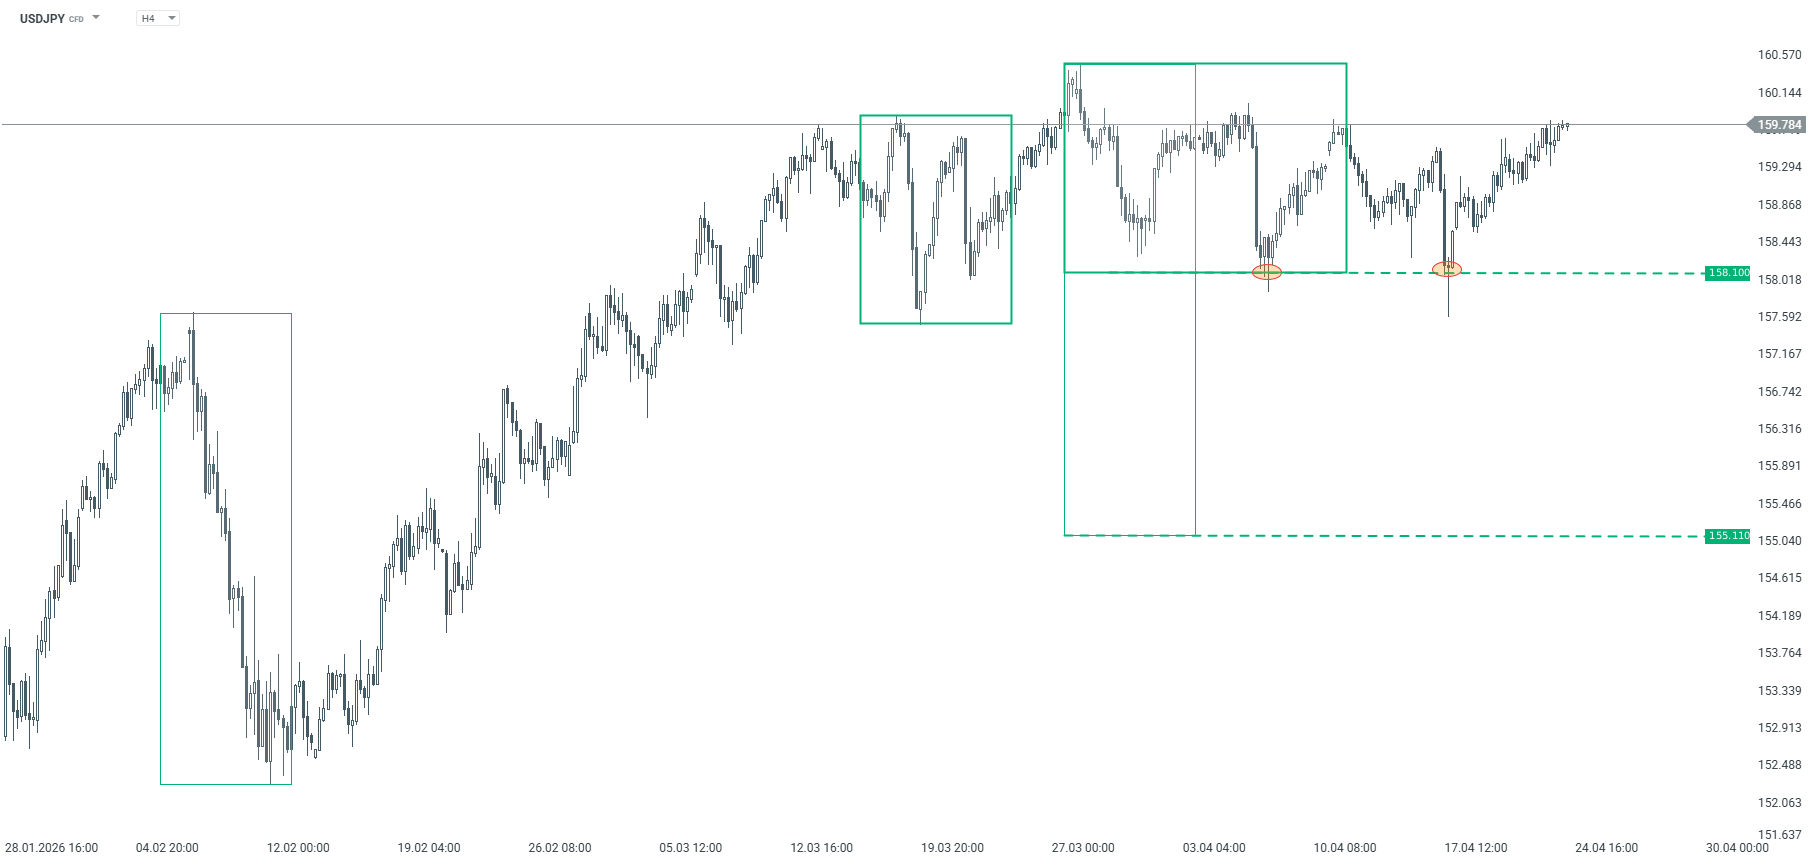
USDJPY
USDJPY has been trending upward for quite some time, but in April we saw a consolidation phase and two tests of support at the 158.10 level. This level was successfully defended, which supports the current uptrend. A break above the March 29 high would confirm the continuation of the uptrend. However, as long as support at 158.10 holds, the base case scenario is for further gains. A break below this level, however, could lead to a larger correction toward 155.11.
To provide the best experiences, we use technologies like cookies to store and/or access device information. Consenting to these technologies will allow us to process data such as browsing behavior or unique IDs on this site. Not consenting or withdrawing consent, may adversely affect certain features and functions.
Functional
Always active
The technical storage or access is strictly necessary for the legitimate purpose of enabling the use of a specific service explicitly requested by the subscriber or user, or for the sole purpose of carrying out the transmission of a communication over an electronic communications network.
Preferences
The technical storage or access is necessary for the legitimate purpose of storing preferences that are not requested by the subscriber or user.
Statistics
The technical storage or access that is used exclusively for statistical purposes.The technical storage or access that is used exclusively for anonymous statistical purposes. Without a subpoena, voluntary compliance on the part of your Internet Service Provider, or additional records from a third party, information stored or retrieved for this purpose alone cannot usually be used to identify you.
Marketing
The technical storage or access is required to create user profiles to send advertising, or to track the user on a website or across several websites for similar marketing purposes.