AUD/JPY Gains momentum, bullish bias prevails above 100-day EMA

April 8, 2026
  • AUD/JPY strengthens to near 111.80 in Wednesday’s Asian session. 
  • The cross maintains the constructive outlook above the 100-day EMA, with bullish RSI momentum. 
  • The initial support level is located at 111.00; the first upside barrier emerges at 112.50.  

The AUD/JPY cross gathers strength to around 111.80 during the Asian trading hours on Wednesday. The Australian Dollar (AUD) edges higher against the Japanese Yen (JPY) amid improved risk sentiment. US President Donald Trump said late Tuesday that he had agreed “to suspend the bombing and attack of Iran for a period of two weeks” on the condition that Iran reopens the Strait of Hormuz.

Iranian Foreign Minister Seyed Abbas Araghchi stated that during the two weeks, safe passage through the Strait of Hormuz “will be possible via coordination with Iran’s Armed Forces and with due consideration of technical limitations.” Easing tensions in the Middle East undermines a safe-haven currency such as the JPY and acts as a tailwind for the cross in the near term. 

On the other hand, fears that Japanese authorities would step in to support the domestic currency might cap the downside for the JPY. Japan’s top currency diplomat Atsushi Mimura said last week that officials may need to take “decisive” steps if speculative moves persist in the currency market.

Chart Analysis AUD/JPY

Technical Analysis:

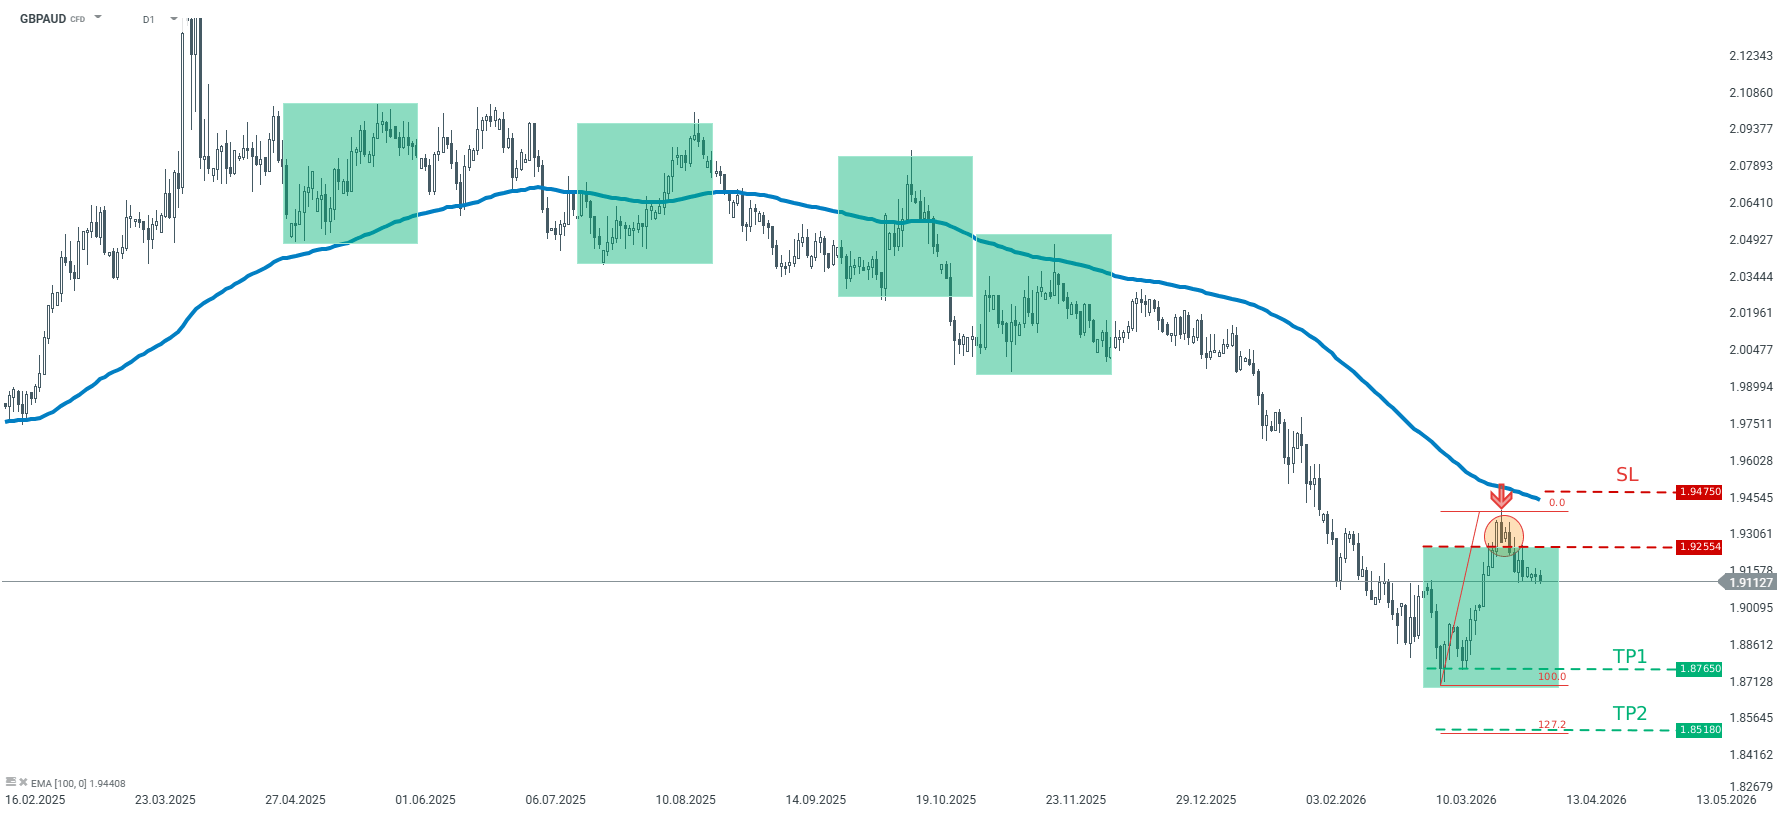
In the daily chart, the near-term bias of AUD/JPY is bullish as price extends its advance well above the 100-day exponential moving average around 107.50, confirming a dominant uptrend and resilient dip demand. The latest candles hold in the upper half of the Bollinger Band envelope, while the bands remain relatively wide, signalling sustained upside momentum rather than a volatility blow-off. RSI has rebounded toward the high-50s, recovering from mid-range readings and aligning with renewed buying pressure after the recent consolidation above the 111.00 handle.

Initial support emerges at 111.00, where recent lows converge with the mid-Bollinger zone, and a break below would expose deeper pullback risk toward the 110.00 area. Stronger downside protection aligns near the 109.00 region, close to the Bollinger lower band cluster and prior congestion, and a loss of this floor would weaken the broader bullish structure. On the topside, immediate resistance stands at the March 19 high of 112.61, followed by the upper boundary of the Bollinger Band of 113.15. 

Trade of The Day – GBP/AUD

April 7, 2026

Facts:
The price bounced off the upper limit of 1:1 structure at 1.9255
GBPAUD sits below the 100-period moving average form H4 interval

Recommendation: 
Trade: Short position on GBPAUD at market price
Target: 1.8765, 1.8518
Stop: 1.9475

Opinion: Looking at the GBPAUD chart at the H4 interval, one can see that the price bounced off the key resistance today. The price bounced off the resistance marked with the upper limit of 1:1 structure at 1.9255. According to the Overbalance strategy, as long as the price sits below the aforementioned resistance, the main trend remains downward. In addition the price sits below the 100-period moving average from the H4 interval which also confirms the bearish scenario.  We recommend going short GBPAUD at market price with two targets: 1.8765 and 1.8518. We also recommend placing a stop loss order at 1.9475 Source: xStation5

EUR/USD hits one-week highs beyond 1.1570 highs as sentiment brightens

April 7, 2026
  • EUR/USD pierces the range top at 1.1570 amid a brighter market mood.
  • Eurozone Services PMI has been revised slightly higher in March.
  • Investors hold their breath ahead of Trump’s deadline for destroying Iran.

The Euro (EUR) has brushed off previous weakness to extend its recovery against the US Dollar (USD) to reach fresh weekly highs above 1.1570 on Tuesday’s European morning session. The market sentiment has improved, with European equities turning positive after a negative opening, and Eurozone services activity revised up, which has provided some support for the common currency.

Eurozone HCOB Services Purchasing Managers’ Index (PMI) has been revised to 50.2 on Tuesday from the 50.1 preliminary reading, although it remains significantly below February’s 51.9 reading. Among country members, Spain’s services activity stands out with a 53.3 reading, although France’s services contracted for the third consecutive month, and Germany’s expansion was revised down to 50.9 from preliminary estimations of 51.2.

Investors’ appetite for risk remains limited as the US deadline to Iran draws closer. US President Donald Trump reiterated his threats on Monday, warning Tehran that the US could destroy a country tonight if the Strait of Hormuz is not reopened before Tuesday, at 8 PM Easter Time (00:00 GMT on Wednesday).

Previously, the US and Iran rejected the 45-day ceasefire proposal offered by Pakistan, and Tehran came out with an alternative plan, considered “significant” by Trump but not good enough.

Before that, the European Central Bank’s (ECB) Governing Council member, Dimitar Radev, affirmed that it is still “too early” to say whether the bank will hike rates in April, as they might need some data amid the elevated level of uncertainty.

Technical Analysis: Pushing against the range top

EUR/USD Chart Analysis

The EUR/USD has turned higher, with technical indicators in the 4-hour chart suggesting an incipient bullish momentum. The Relative Strength Index (RSI) nears 60 after having remained flat around the 50 level, and the Moving Average Convergence Divergence (MACD) histogram is popping up above zero, although the MACD line remains practically flat.

A confirmation above the near-term channel’s top, at the 1.1570 area, would expose the late March and early April highs, in the area between 1.1630 and 1.1640. Further up, the March 10 high, at 1.1667, emerges as a plausible target.

Immediate support emerges at the 1.1505 area, which held bears on April 2 and 6. A confirmation below here would expose the March 30 and 31 lows near 1.1440, ahead of the multi-month lows, at 1.1411 hit in mid-March.

EUR/GBP approaches 0.8700 lows following Eurozone and UK services data

April 7, 2026
  • Euro maintains a moderate near-term bias, with bears looking at the 0.8700 area.
  • Eurozone’s services activity for March has been revised up, yet at levels well below February’s.
  • UK services sector grew at its slowest pace of the last 11 months in March.

The Euro (EUR) extends losses against the British Pound (GBP) for the second consecutive day on Tuesday, approaching the bottom of its near-term horizontal range at 0.8700, from Monday’s highs at 0.8735.

The pair has been unfazed by the moderate upward revision of the Eurozone’s HCOB Services Purchasing Managers’ Index figures, which were revised up on Tuesday.

Mixed Eurozone services data

Business activity in the countries sharing the Euro expanded at a 50.2 pace, according to final estimations, an inch higher than the 50.1 preliminary reading but well below the 51.9 reading seen in February.

Spain’s services sector has been the main driver of the revision, with business activity rising to 53.3 from Flash estimates of 51.9. The numbers for the region’s stronger economies, however, have disappointed, as France’s sector contracted for the third consecutive month and Germany’s expansion was revised down to 50.9 from 51.2 preliminary estimation and 53.5 in February.

In the UK, the S&P Global Services PMI has also been revised down to 50.5 in March, its slowest growing pace in almost a year, from flash estimations of a 51.0 reading and 53.9 in February.

These figures reflect the strong economic impact of the war in Iran on the Eurozone and UK economies, the day when US President Donald Trump’s deadline on Tehran expires. Investors are holding their breath after Trump threatened to “demolish” Iran’s bridges and energy plants, refusing claims against war crimes

Commodity Talk – Oil, Natgas, Gold and Cocoa

April 7, 2026

Oil:

  • Brent crude oil exceeds $110 on the June contract amid further escalation of the situation in the Middle East.
  • Despite the emergence of prospects for a ceasefire, Iran has rejected all terms from the United States.
  • Iran indicated it wants permanent peace and the withdrawal of American troops. A ceasefire could be preparation for a stronger strike.
  • The next 48-hour deadline announced by Trump expires at 12:00 GMT from Tuesday to Wednesday, although Iran has repeatedly indicated it does not intend to comply.
  • The Wall Street Journal indicates that the United States is preparing to strike energy and transport infrastructure in Iran.
  • During the holiday weekend, the highest number of ships since the beginning of the conflict passed through the Strait of Hormuz, which is related to agreements between Iran and several Asian countries.
  • Ships from countries such as India, Pakistan, the Philippines, Malaysia, and China have recently passed through the Strait of Hormuz. It is unknown whether the agreements on the passage of ships concerned the flag or specific units.
  • Pakistan was said to have reached an agreement for the passage of 20 units; theoretically, all Indian units can cross the strait. Iran indicates that all ships from Iraq can also freely pass through the strait. However, there are no details of such agreements, and additionally, vessel insurance remains a key aspect.
  • OPEC+ agreed during a weekend meeting that it will increase production by another 206,000 barrels per day in May at the moment the Strait of Hormuz opens.
  • It is worth emphasizing that Russia also has major problems with increasing production and exports, which is related to Ukraine’s attacks on Russian oil infrastructure.

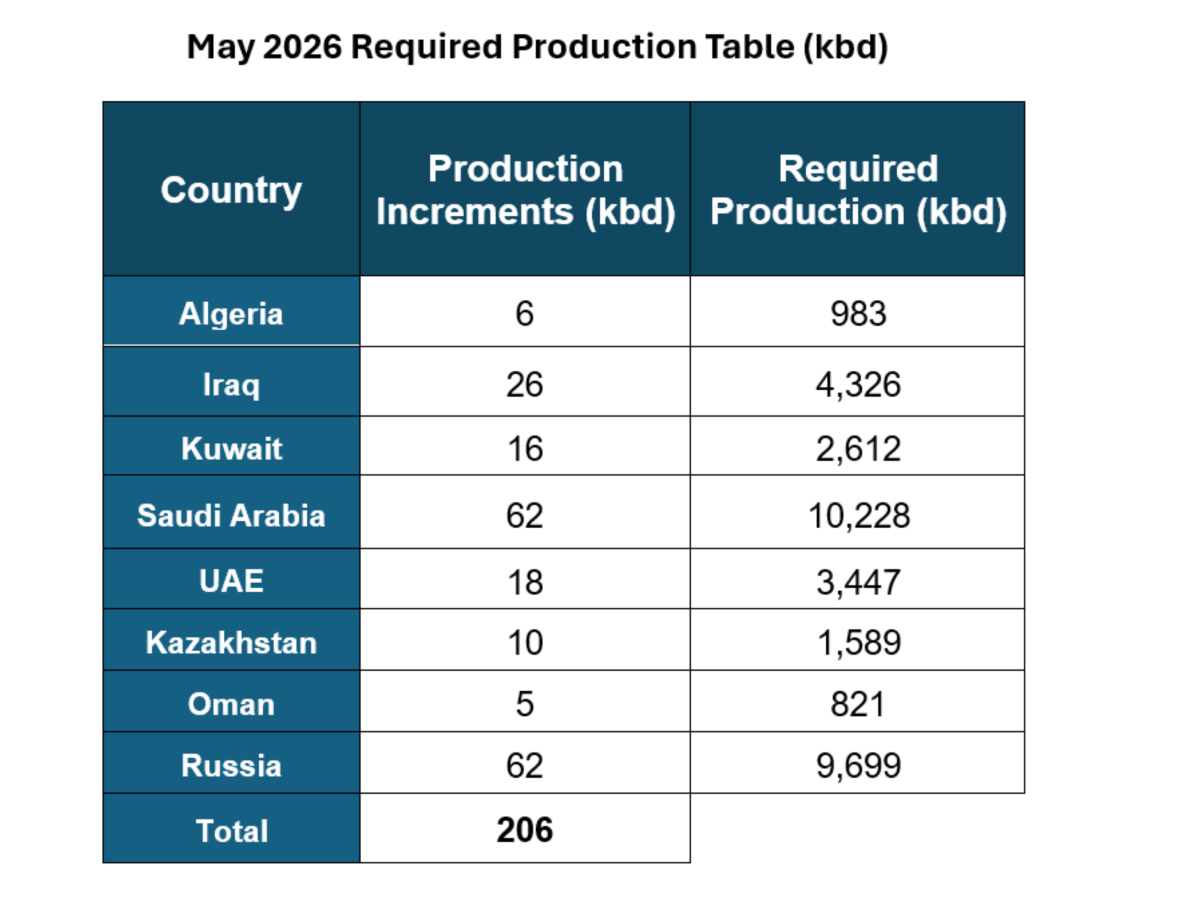
New production quotas for countries in the agreement on voluntary production cuts. It is worth noting that countries like Iraq, Kuwait, Saudi Arabia, the UAE, and also Russia have significantly reduced their production volumes recently. Source: OPEC

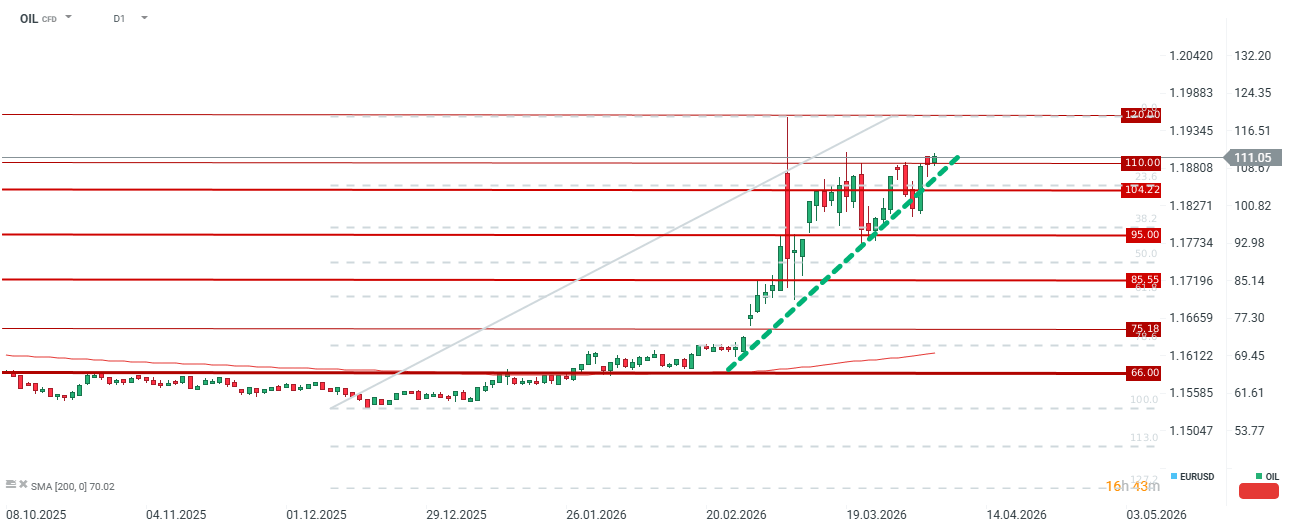
​​​​​​​Oil is currently in a zone of strong supply and is no longer reacting as dynamically as it was a few days ago. The Strait of Hormuz remains closed, but some ships are passing through, so prices may be under slight pressure. Nevertheless, a few ships will not lead to a significant improvement in the global supply situation. Source: xStation5

Gas:

  • Gas prices fell toward $2.8/MMBTU due to the end of the heating season in the USA, although on Monday we observed an attempted recovery due to forecasts indicating lower temperatures.
  • Gas production on Monday was 110.4 bcfd, which was an almost 3% increase compared to last year. In turn, domestic demand was almost 73 bcfd, which was a level nearly 7% lower than a year ago.
  • LNG exports amounted to 20.4 bcfd, which was a level almost 2% higher than in the previous week. It is worth emphasizing that despite global tension in the LNG gas market due to the blockade of the Strait of Hormuz, the United States cannot significantly increase export capacities beyond current levels due to the use of full export capacities.
  • It is expected that by 2030, export capacities in North America will increase to approx. 30 bcfd.

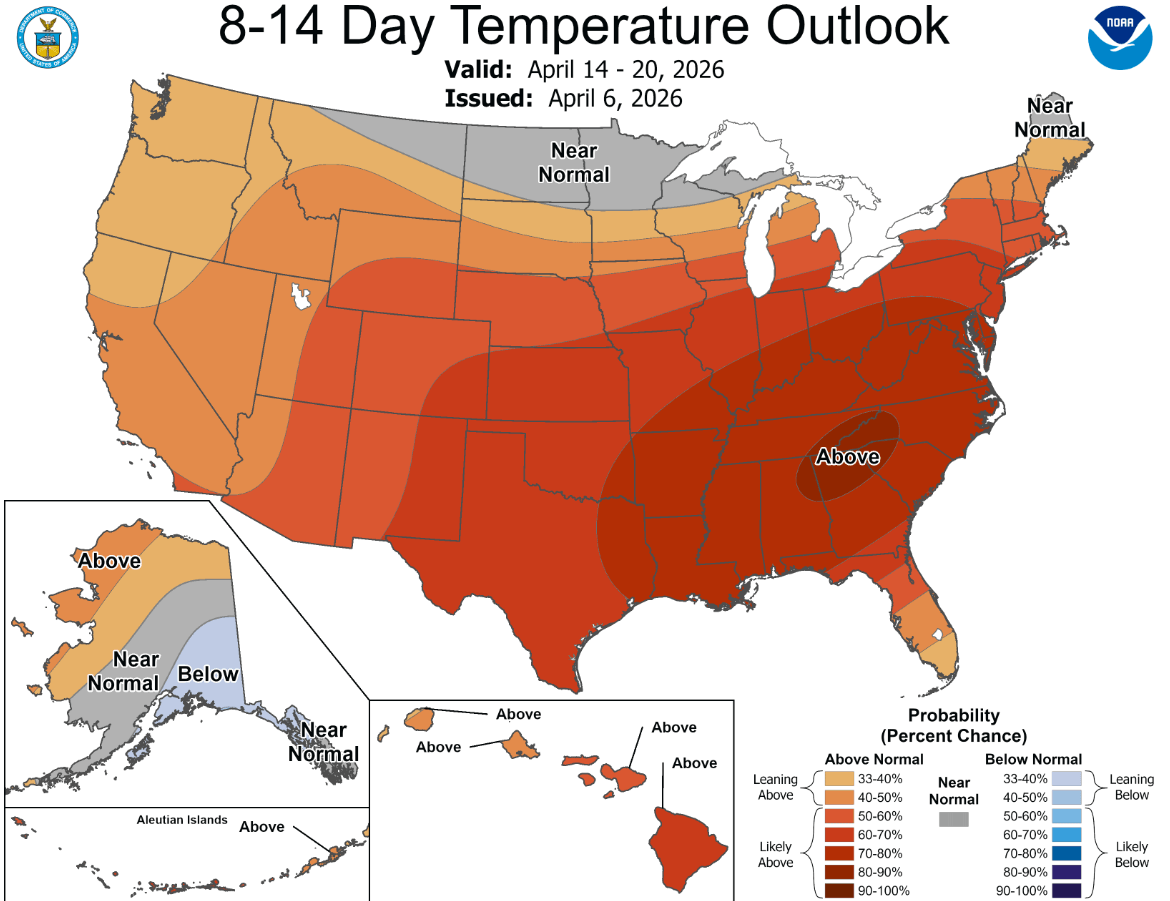
​​​​​​​Forecasts for the next 2 weeks indicate that temperatures will be higher than standard. This means that gas consumption for heating purposes should be minimal. Nevertheless, seasonal forecasts suggest that in the summer period, temperatures should also be higher, which means higher consumption in the future. Source: NOAA

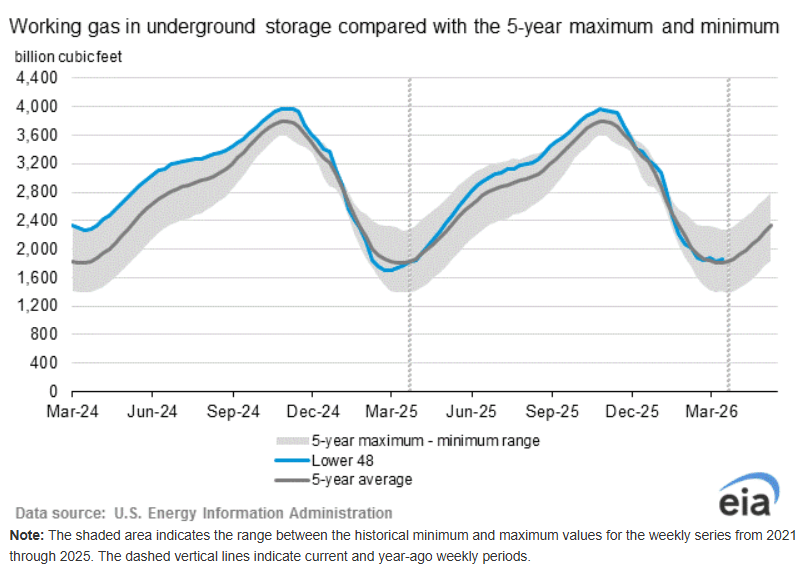
​​​​​​​Gas inventories have fallen toward the 5-year average, but are now starting to rebound. In March, we had 2 reports that showed a rebound in inventories, despite the theoretical duration of the heating season. Source: EIA

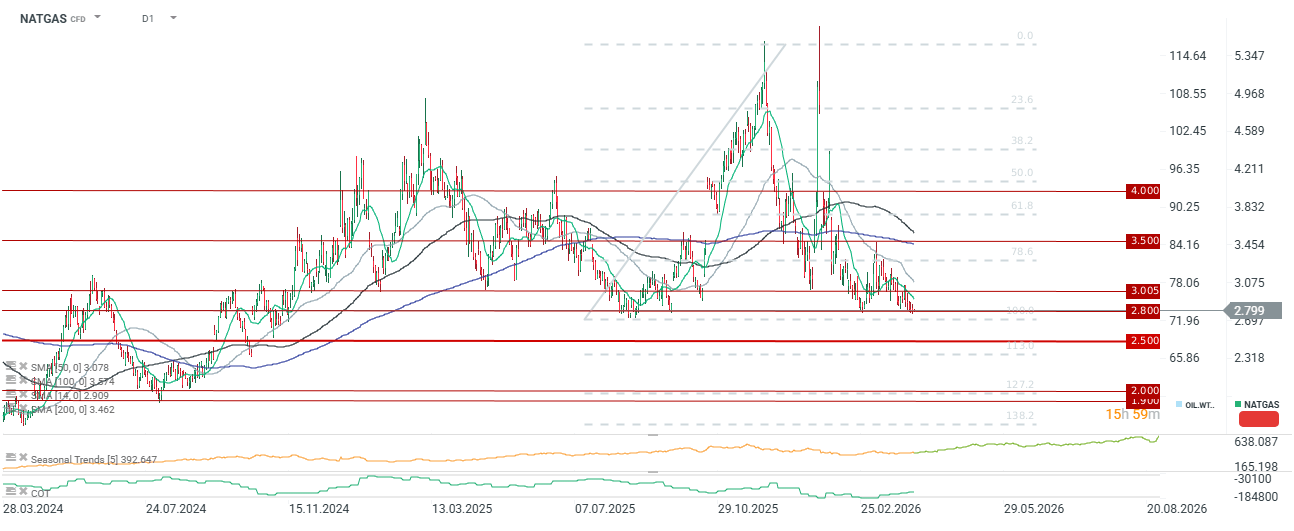
​​​​​​​The price is at very important support around $2.8/MMBTU. Source: xStation5

Gold:

  • Gold remains at lower levels after Friday’s pullback. Gold still remains trapped amid rising expectations for interest rate hikes and due to massive geopolitical risk and uncertainty regarding further strong global debt growth.
  • According to a World Gold Council report, central banks still intend to buy gold in 2026.
  • Goldman Sachs maintains price forecasts above $5500 per ounce at the end of this year.
  • Signing an agreement to end the fighting or a simple ceasefire could theoretically mean a reduction in geopolitical risk, but also mean a temporary rebound in inflation.
  • Currently, we see that gold or silver behaves more as a risk asset, dependent on interest rates, which is why we observe a high correlation with American indices.
  • It is worth remembering, however, that in 2020, when all assets lost value very strongly, gold rebounded quite quickly after a larger correction.
  • The current correction since the beginning of March is approx. 15%, although at one point the drop was nearly 25%.

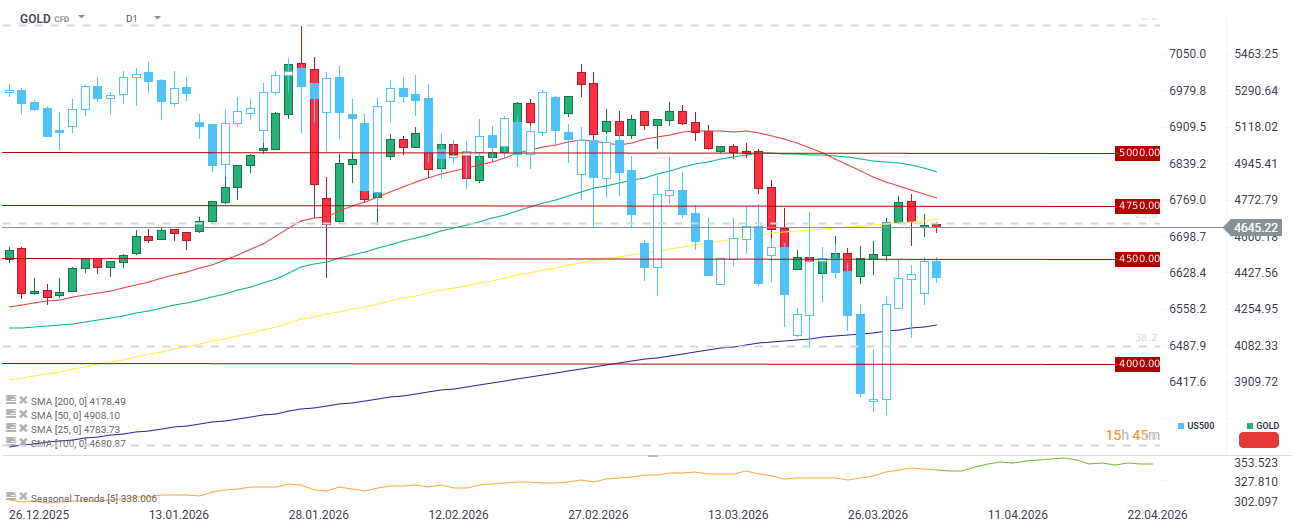
​​​​​​​The correlation between the price of gold and the US500 has been quite high since almost the beginning of this year. Nevertheless, the scale of the US500 rebound recently does not coincide so strongly with the rebound in the gold price. Source: xStation5

Cocoa:

  • The price of cocoa rebounded at the turn of March and April. However, the peaks from March 11 were not broken, which means a lack of a new sequence of higher highs and higher lows.
  • A Bloomberg Intelligence report indicates that chocolate sales in the USA during the Easter period were 5% lower, which continues to mean destruction of consumer demand due to the persistence of high prices.
  • Cheaper cocoa beans should enter the market in the second half of the year and have the greatest impact on product prices in 2027. Nevertheless, it cannot be ruled out that producers, in order to recover losses, will continue to maintain higher margins with lower bean prices.
  • Cocoa inventories on ICE rose to a 1.5-year peak, reaching almost 2.4 million bags.
  • Just before the start of the mid-season, about half of Ivory Coast and 2/3 of Ghana are currently experiencing dry conditions, which could potentially reduce harvests in the coming months.
  • Nevertheless, taking into account the increase in inventories and oversupply for the second year in a row, a strong price rebound at this point due to potentially worse production is unlikely. The key aspect of the market at this moment is low demand, which shows that chocolate producers have dealt with the lower availability of the raw material that took place after 2022.
  • It is worth remembering that the massive increase in fertilizer prices after 2022 also resulted in less fertilization of cocoa crops, which affected the reduction of production in 2023 and 2024 (aside from weather factors). Therefore, the current increase in fertilizer prices could potentially affect the 2026/2027 main season.

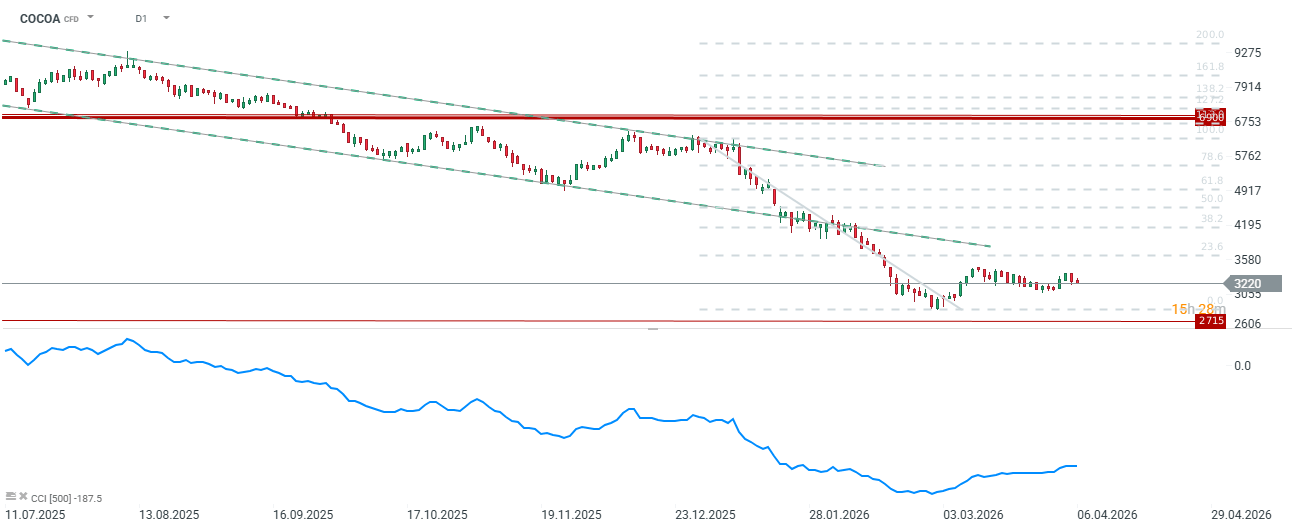
​​​​​​​The cocoa price remains at low levels due to the lack of signs of a demand rebound. Theoretically, we should observe an improvement in the second half of this year after the exhaustion of inventories from previous years. Source: xStation5

The material on this page does not constitute financial advice and does not take into account your level of understanding, investment objectives, financial situation or any other specific needs. All information provided, including opinions, market research, mathematical results and technical analyzes published on the Website or transmitted To you by other means, it is provided for information purposes only and should in no way be construed as an offer or solicitation for a transaction in any financial instrument, nor should the information provided be construed as advice of a legal or financial nature on which any investment decisions you make should be based exclusively To your level of understanding, investment objectives, financial situation, or other specific needs, any decision to act on the information published on the Website or sent to you by other means is entirely at your own risk if you In doubt or unsure about your understanding of a particular product, instrument, service or transaction, you should seek professional or legal advice before trading. Investing in CFDs carries a high level of risk, as they are leveraged products and have small movements Often the market can result in much larger movements in the value of your investment, and this can work against you or in your favor. Please ensure you fully understand the risks involved, taking into account investments objectives and level of experience, before trading and, if necessary, seek independent advice.

AUD/USD Wobbles around 0.6900 ahead of Iran’s response to Trump’s ultimatum

April 7, 2026
  • AUD/USD trades with caution around 0.6900 ahead of Trump’s Iran deadline.
  • US President Trump threatened to destroy Iran’s civilian infrastructure if it doesn’t reopen the Hormuz.
  • Investors await the US FOMC minutes and the CPI data.

The AUD/USD pair trades in a tight range around 0.6900 during the early European trading session on Tuesday. The Aussie pair consolidates as investors await Tehran’s response to United States (US) President Donald Trump’s warning to destroy Iranian power plants and bridges if it doesn’t reopen the Strait of Hormuz by Tuesday, 08:00 PM ET.

Market sentiment remains cautious, with the S&P 500 futures trading 0.5% down during the press time. The US Dollar Index (DXY), which tracks the Greenback’s value against six major currencies, trades marginally higher around 100.10.

Ahead of the deadline, statements from Iranian officials indicate that the nation is unlikely to reopen the Hormuz, a scenario that could mark an escalation in the ongoing war. An advisor to Iran’s Parliament Speaker Mohammad Bagher Ghalibaf stated that “Trump has about 20 hours to either surrender to Iran, or his allies will return to the Paleolithic Age”.

On the domestic front, investors await the US Federal Open Market Committee (FOMC) minutes of the March policy meeting, which will be released on Wednesday. This week, the major highlight will be the US Consumer Price Index (CPI) data for March, which is scheduled for Friday.

AUD/USD technical analysis

AUD/USD trades cautiously at around 0.6910 as of writing. The near-term bias is mildly bearish as spot holds below the 20-day exponential moving average, which has started to roll over and cap bounces in the 0.6960 area. Price action shows a sequence of lower closes from the 0.71 region, while the RSI has slipped below the 50 line and stabilizes in the low-40s, confirming building downside momentum rather than oversold conditions.

Initial resistance emerges at the 20-day EMA near 0.6960, with a break above exposing the March 23 high around 0.7060 as the next barrier. On the downside, immediate support stands at 0.6880, guarding the recent trough at 0.6835. A daily close below 0.6835 would extend the bearish phase toward the 0.6800 handle, while recovery above 0.6960 would ease selling pressure and open a corrective phase within the broader range.

EUR/GBP steadies above 0.8700 amid ECB hawkish tone

April 7, 2026
  • EUR/GBP holds steady near 0.8720 in Tuesday’s early European session.
  • ECB hawkish tone could underpin the Euro against the Pound Sterling.
  • Bank of England is anticipated to hold rates this year, according to a Reuters poll.

The EUR/GBP cross trades on a flat note around 0.8720 during the early European session on Tuesday. Traders will take more cues from the Eurozone Retail Sales and German inflation data, which are due later this week. These reports could offer some cues about the European Central Bank (ECB) interest rate path this year.

Meanwhile, the Euro (EUR) could receive some support from the hawkish tone of the European Central Bank (ECB). ECB President Christine Lagarde emphasizied that policy will remain restrictive until inflation sustainably returns to the 2% target. 

Additionally, ECB policymaker Francois Villeroy de Galhau said last week that the central bank’s next interest rate move will very likely be an increase although it is still ‌too early to say when it will start hiking. Markets have priced in 2–3 interest rate hikes for 2026 due to surging energy-driven inflation, a significant shift from previous expectations of holding rates.

The Bank of England (BoE) has shifted from a bias toward cutting rates to a “wait-and-see” stance. The UK central bank is expected to hold Bank Rate at 3.75% for the rest of the year, according to a narrow majority of economists polled by Reuters who have mostly abandoned their previous expectations for cuts but have not followed financial markets in expecting nearly three rate rises this year.

USD/INR edges lower at open ahead of Trump’s Iran deadline

April 7, 2026
  • The Indian Rupee trades marginally higher against the US Dollar in the opening trade.
  • Investors await Iran’s final decision on Trump’s deadline at 08:00 PM ET, 05:30 AM IST on Wednesday.
  • The RBI is expected to maintain the status quo on Wednesday.

The Indian Rupee (INR) ticks up against the US Dollar (USD) in the opening trade on Tuesday. The USD/INR pair edges down to near 93.00, while it is expected to remain range bound as investors stay on sidelines ahead of United States (US) President Donald Trump’s ultimatum to Iran either to reopen the Strait of Hormuz or face brutal consequences whose deadline is Tuesday, April 7, 08:00 PM Eastern Time (ET), which will be 05:30 AM IST on Wednesday.

Trump threatens hell if Iran misses deadline

Over the weekend, US President Trump warned, through a post on Truth.Social, that Washington will bomb Iranian power plants and bridges, if it doesn’t reopen the Strait of Hormuz before the deadline.

Meanwhile, comments from Iran signal that it won’t back down, as it threatened reciprocal attacks on the regional US infrastructure and its allies. An advisor to Iran’s Parliament Speaker Mohammad Bagher Ghalibaf stated that “Trump has about 20 hours to either surrender to Iran, or his allies will return to the Paleolithic Age”.

Market participants worry that a fresh escalation in the ongoing war would boost oil prices, a scenario that is unfavorable for the Indian Rupee, being the currency of a nation that caters its 88%-89% of its domestic energy needs through oil imports.

The ongoing tensions in the Middle East have dampened the interest of foreign investors in the Indian stock market. Foreign Institutional Investors (FIIs) continue to dump their stake in the Indian equity market, and have offloaded their stake worth Rs. 26,429.45 crore in the three trading days of April gone by.

Investors await RBI’s policy decision and FOMC minutes

On the domestic front, the next major trigger for the Indian Rupee will be the Reserve Bank of India’s (RBI) monetary policy announcement on Wednesday. The RBI is expected to leave its Repo Rate unchanged at 5.25%, as higher energy prices have prompted inflation expectations globally.

As the RBI is highly anticipated to maintain the status quo, investors will pay close attention to comments from the Indian central bank regarding the outlook of inflation, economic growth and key borrowing rates.

In the US, the Federal Open Market Committee (FOMC) minutes of the March policy meeting will be published on late Wednesday. In the policy meeting, the Fed decided to leave interest rates unchanged in the range of 3.50%-3.75% and stated that “higher energy prices will push up inflation in the near term”.

Technical Analysis: USD/INR turns range bound as RSI sifts into 40.00-60.00 zone

USD/INR edges down to near 93.00 in the opening trade on Tuesday. The near-term bias appears neutral as the pair trades close to the 20-day Exponential Moving Average (EMA), which is at 92.95, capping rebounds. The overall trend remains bullish as the higher highs and higher lows structure has not broken yet.

The 14-day Relative Strength Index (RSI) shifts into the 40.00-60.00 zone from the bullish territory above 60.00, signifying that momentum has cooled down, but the bullish bias remains intact.

Initial support emerges at the March 9 high of 92.35, with a daily close below this level opening the room toward the March 5 low of 91.35. On the topside, immediate resistance stands at the April 2 high of 93.66; a break above that level would reassert the bullish trend, which will improve the odds of the price reclaiming the all-time high of 95.22.