Currency Hedger No Comments

AUD/JPY trims losses near 112.50 as RBA hikes official cash rate to 4.35%

  • AUD/JPY recovers modestly to around 112.65 in Tuesdayโ€™s early European session. 
  • RBA lifted the Official Cash Rate to 4.35% from 4.1% at its May meeting on Tuesday. 
  • Traders remain on edge over the potential for Japanese authorities to step back into the market after last weekโ€™s intervention.

The AUD/JPY cross pares losses near 112.65 during the early European trading hours on Tuesday. The Australian Dollar (AUD) edges slightly higher after the Reserve Bank of Australia (RBA) interest rate decision. Traders await Governor Michele Bullockโ€™s press conference at 04:30 GMT for fresh impetus. 

As widely expected, the Australian central bank on Tuesday decided to raise the Official Cash Rate (OCR) by 25 basis points (bps) to 4.35% from 4.10% after concluding its May monetary policy meeting. According to the RBA Monetary Policy Statement, the central bank noted a significant increase in uncertainty over the domestic economic outlook and inflation.

The fallout from the Iran war will slash half a percentage point off economic growth in 2026 against the pre-conflict forecasts in February, as annual growth halves to 1.3% this year.

On the JPYโ€™s front, markets remain on high alert following suspected interventions by Japanese authorities. Japanese Finance Minister Satsuki Katayama said Japan can take action against speculative foreign-exchange movements.

There was no official confirmation, but there were plenty of unofficial signals – including a โ€œfinal warningโ€ from a top official: the Ministry of Finance (MoF) and the Bank of Japan (BoJ) intervened in the foreign exchange market on Friday to strengthen the Japanese yen. The big question now is: How long will the JPYโ€™s strength last?โ€ said Commerzbankโ€™s Thu Lan Nguyen. 

Currency Hedger No Comments

AUD/JPY Price Forecast: Weakens below 113.00, while broader uptrend remains intact

  • AUD/JPY weakens to around 112.95 in Mondayโ€™s early European session.ย 
  • The cross keeps bullish vibe above the 100-day EMA, but further consolidation cannot be ruled out in near term.ย 
  • The immediate resistance level emerges at 113.40; the initial support level is seen at 112.00.ย 

The AUD/JPY cross loses ground near 112.95 during the early European session on Monday. The Australian Dollar (AUD) softens against the Japanese Yen (JPY) as uncertainty surrounding Middle East tensions and the closure of the Strait of Hormuz boosts safe-haven assets. 

US President Donald Trump announced the US will begin guiding ships through the Strait of Hormuz starting Monday, per CNN. Meanwhile, Iranian official Ebrahim Azizi warned that the plan is a violation of the ceasefire.

On the other hand, markets expect the Reserve Bank of Australia (RBA) to deliver a third straight interest rate hike on Tuesday. The primary driver is a significant jump in headline inflation in March, fueled by global energy shocks and Middle East tensions.  

Chart Analysis AUD/JPY

Technical Analysis:

In the daily chart, AUD/JPY maintains a constructive bullish bias as spot holds well above the 100-day Exponential Moving Average (EMA), keeping the broader uptrend intact despite the latest pullback from recent highs. Price is also trading above the lower Bollinger Band, while the Relative Strength Index (RSI) at 50.8 has eased back to neutral territory, hinting at a consolidation phase rather than an outright reversal.

On the topside, initial resistance is aligned with the 20-day Bollinger middle band at 113.40. A sustained break above this pivot would expose the April 28 high of 114.72, en route to the upper Bollinger band near 115.18 as the next bullish target. On the downside, immediate support is seen around the 112.00 psychological level, followed by the lower Bollinger band at 111.65; a deeper correction towards the 100-day EMA at 109.37 would still be consistent with a broader bullish structure while offering a potentially stronger demand zone.

Currency Hedger No Comments

AUD/USD Consolidates above 0.7200, highest since June 2022 ahead of RBA

  • AUD/USD is seen consolidating its recent strong gains amid a combination of diverging forces.
  • Hawkish RBA bets continue to underpin the Aussie, while rising US-Iran tensions cap the upside.
  • Bulls also seem hesitant and await the crucial RBA rate decision on Tuesday for a fresh impetus.

The AUD/USD pair enters a bullish consolidation phase at the start of a new week and holds steady above the 0.7200 mark, near its highest level since June 2022, touched on Friday. Bets that the Reserve Bank of Australia (RBA) will hike interestย ratesย at the upcoming policy meeting on Tuesday continue to underpin the Aussie. However, rising US-Iran tensions benefit the safe-haven US Dollar (USD) and act as a headwind for spot prices ahead of the key central bank event.

Against the backdrop of the recent bounce from the 100-period Exponential Moving Average (EMA) on the 4-hour chart, Friday’s breakout and close above the 0.7200 horizontal barrier were seen as a key trigger for the AUD/USD bulls. Moreover, the Relative Strength Index (RSI) around 62 suggests firm positive momentum without yet entering overbought territory. Adding to this, the Moving Average Convergence Divergence (MACD) histogram remains slightly positive, hinting that upside pressure is intact.

The technical setup backs the case for an extension of theย AUD/USDย pair’s recent move higher from the late-March swing low. Hence, any corrective pullback is more likely to attract buyers and remain limited in the near term. The 100-period EMA around 0.7137 might continue to offer immediate support, which, if broken decisively, would signal fading bullish control and open the way for a deeper correction.

(The technical analysis of this story was written with the help of an AI tool.)

AUD/USD 4-hour chart

Chart Analysis AUD/USD
Currency Hedger No Comments

AUD/USD Price Forecast: Remains bullish despite hovering around 0.7200

  • AUD/USD trades near range highs within 0.7100โ€“0.7200 consolidation band.
  • RSI above 50 supports bullish momentum and potential breakout scenario.
  • Break above 0.7250 targets 0.7282 and 0.7300 resistance levels.

AUD/USDย holds to minimal gains of 0.10% late in the North American session, yet poised to finish the week up 0.84%. At the time of writing, the pair trades above 0.7200 as the โ€˜bullish engulfingโ€™ chart pattern caps the Aussie on the downside.

AUD/USD Price Forecast: Technical outlook

From a technical perspective, the AUD/USD trades near the top of a 100-pip consolidation range between 0.7100 and 0.7200, with traders awaiting fresh catalysts. Momentum is bullish as depicted by the Relative Strength Index (RSI) sitting above its neutral level.

On the upside, the first resistance for AUD/USD is the psychological 0.7250 level. If cleared, the next stop would be the June 3, 2022, high of 0.7282 ahead of the 0.7300 area. The next area of interest would be on April 5, 2022, at 0.7661

Conversely, if AUD/USD ends the day below 0.7200, it could open the door for testing the 20-day SMA at 0.7121. Below this level is 0.7100 โ”€the bottom of the 100-pip rangeโ”€, followed by the 50-day SMA at 0.7059

AUD/USD Price Chart โ€“ Daily

AUD/USD daily chart
Currency Hedger No Comments

AUD/USD holds steady near recent highs ahead of expected RBA rate hike

  • AUD/USD trades near 0.7200, holding steady despite volatility linked to geopolitical risks.
  • Investors largely expect a rate hike from the Australian central bank next week.
  • The US Dollar remains broadly under pressure, limiting downside in the pair.

AUD/USDย trades around 0.7200 on Friday at the time of writing, virtually unchanged on the day and holding near recent highs, as markets adopt a wait-and-see approach ahead of the Reserve Bank of Australia (RBA) monetary policy decision scheduled for Tuesday.

The Australian Dollar (AUD) remains slightly supported against its major peers, with investors expecting this key event. According to a Reuters poll, a strong majority of economists expect a 25 basis point rate hike, which would bring the policy rate to 4.35%. These expectations are supported by persistent inflationary pressures in Australia, with the annual Consumer Price Index (CPI) coming in at 4.6% YoY in March, still well above the central bankโ€™s target.

Market participants will also closely watch Governor Michele Bullockโ€™s comments for further guidance on the policyย outlook, particularly as energy-related risks linked to tensions in the Middle East and uncertainty surrounding the Strait of Hormuz could continue to fuel inflationary pressures.

At the same time, the US Dollar (USD) is struggling to gain traction despite a geopolitical backdrop that usually supports safe-haven demand. Markets expect theย Federal Reserveย (Fed) to keep interestย ratesย unchanged through the end of the year, although some officials, including Neel Kashkari, have highlighted the possibility of further hikes in the event of a significant inflationary shock driven by energy prices.

Geopolitical tensions still provide intermittent support to the Greenback, particularly following reports that the US administration is considering military options regarding Iran. Meanwhile, diplomatic developments suggesting that Tehran has submitted a new proposal to the United States (US) on Thursday have temporarily weighed on the US Dollar.

Investors now turn their attention to the release of the US ISM Manufacturing Purchasing Managers Index (PMI) later in the day, a key indicator for assessing economic momentum.

US Dollar Price Today

The table below shows the percentage change of US Dollar (USD) against listed major currencies today. US Dollar was the strongest against the New Zealand Dollar.

USDEURGBPJPYCADAUDNZDCHF
USD-0.25%-0.22%-0.02%-0.14%-0.03%0.15%-0.20%
EUR0.25%0.02%0.22%0.08%0.22%0.38%0.05%
GBP0.22%-0.02%0.19%0.08%0.19%0.36%0.05%
JPY0.02%-0.22%-0.19%-0.11%-0.01%0.14%-0.16%
CAD0.14%-0.08%-0.08%0.11%0.10%0.28%-0.03%
AUD0.03%-0.22%-0.19%0.00%-0.10%0.16%-0.12%
NZD-0.15%-0.38%-0.36%-0.14%-0.28%-0.16%-0.31%
CHF0.20%-0.05%-0.05%0.16%0.03%0.12%0.31%

The heat map shows percentage changes of major currencies against each other. The base currency is picked from the left column, while the quote currency is picked from the top row. For example, if you pick the US Dollar from the left column and move along the horizontal line to the Japanese Yen, the percentage change displayed in the box will represent USD (base)/JPY (quote).

Currency Hedger No Comments

AUD/JPY Price Gains ground, maintaining bullish bias above 100-day EMA

  • AUD/JPY edges higher to around 113.10 in Fridayโ€™s early European session.ย 
  • The cross keeps a positive tone above the 100-day EMA, with the RSI pointing to neutral but slightly positive momentum.ย 
  • The immediate resistance level emerges at 113.30; the initial support level to watch is 111.10.ย 

The AUD/JPY cross holds positive ground near 113.10 during the early European session on Friday. The cross remains firm after pulling back from a multi-decade high of 114.72. However, the potential upside for AUD/JPY might be limited amid intervention fears. 

Atsushi Mimura, Japanโ€™s Vice Finance Minister for International Affairs and top foreign exchange official, on Friday declined to confirm the Japanese Yen (JPY) intervention directly but delivered a pointed warning to speculators, noting that Japan’s Golden Week holidays have just started and that there is no change to his view that market moves remain speculative in nature. 

On the other hand, a hawkish stance from the Reserve Bank of Australia (RBA) could underpin the Aussie. Australian headline Consumer Price Index (CPI) inflation climbed to 4.6% YoY in March, primarily due to fuel price shocks linked to ongoing Middle East conflicts. While the figure was slightly below the 4.7% forecast, it remains well above the Reserve Bank of Australiaโ€™s (RBA) target range, keeping pressure on the central bank to hikeย rates.ย 

Chart Analysis AUD/JPY

Technical Analysis:

In the daily chart, AUD/JPY keeps a constructive bullish bias as it holds above the 100-day Exponential Moving Average (EMA) and the lower Bollinger Band. Price is testing the Bollinger 20-day simple moving average (SMA) pivot at 113.30, suggesting ongoing upside interest after the recent pullback, while the Relative Strength Index (RSI) around 52 points to neutral but slightly positive momentum rather than overbought conditions.

On the topside, a sustained break above the Bollinger mid-line at 113.30 would open the way toward the April 28 high of 114.72, en route to the upper Bollinger Band of 115.45. On the downside, initial demand is seen at the lower Bollinger Band near 111.10, ahead of stronger, medium-term support at the 100-day EMA around 109.30, where buyers would be expected to re-emerge if a deeper correction unfolds.

Currency Hedger No Comments

Currency Talk – EUR/GBP, EUR/AUD, AUD/USD

Key takeaways

  • What is the technical outlook for EURGBP, EURAUD, and AUDUSD?

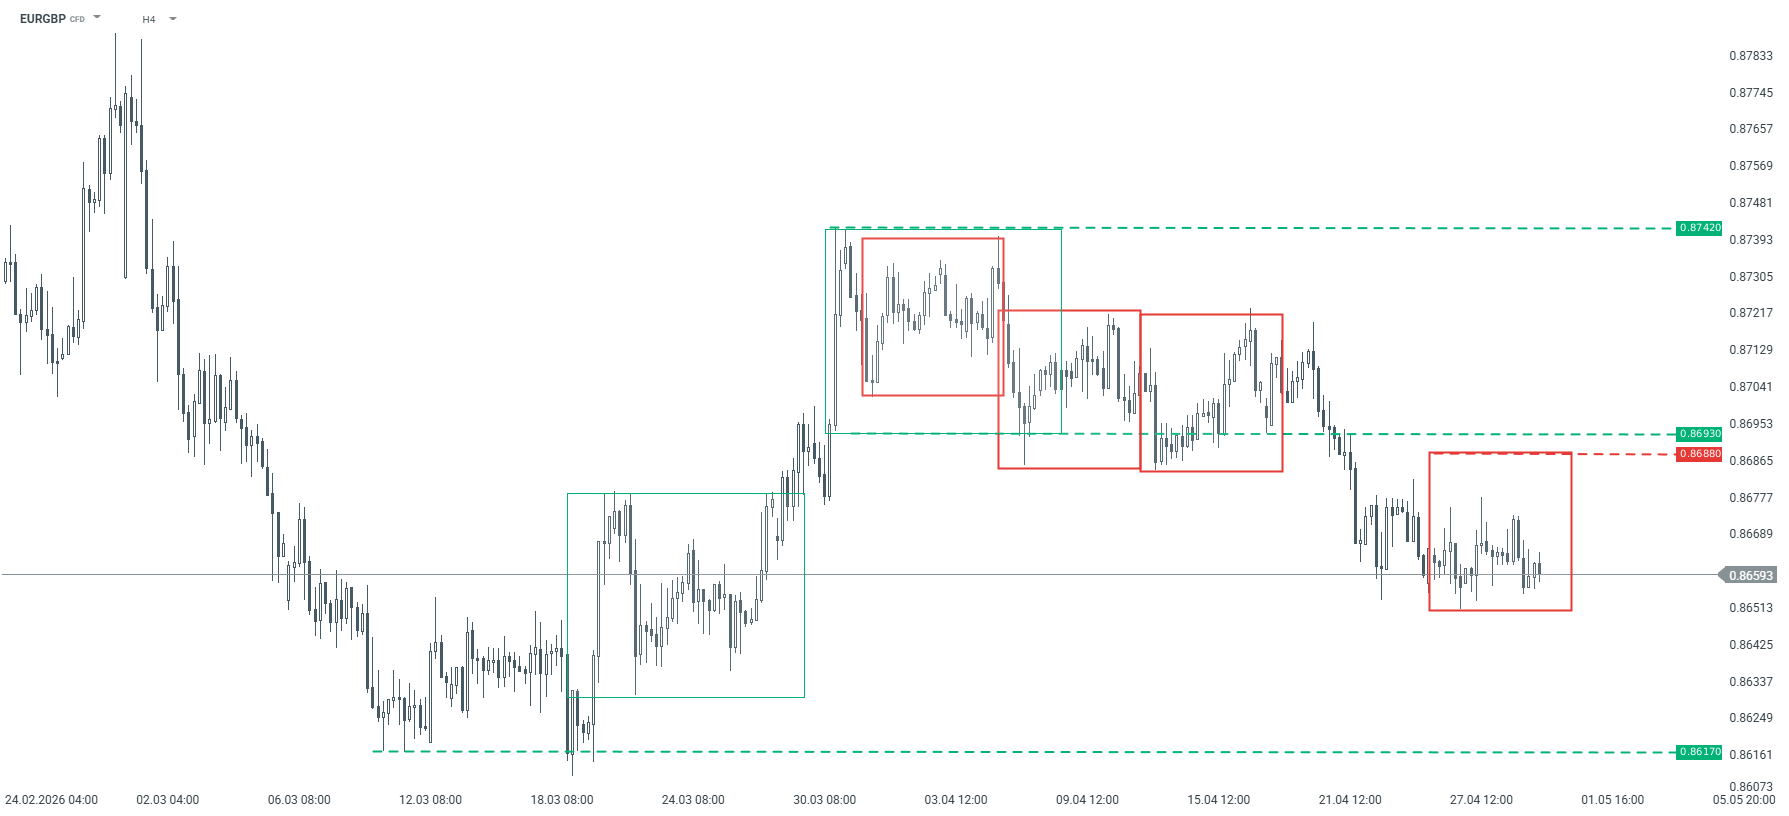
The Overbalance analysis aims to identify three financial instruments, analyzed primarily on the daily/four-hour (D1/H4) timeframe. The analysis uses only the Overbalance methodology, which helps determine where a trend may continue or where it may reverse. Todayโ€™s analysis covers three instruments, evaluated solely in terms of 1:1 correction structures. EURGBP From March 20 through the end of the month, EURGBP traded in an uptrend, but the subsequent correction turned into a stronger downtrend. After the 1:1 upward pattern was negated at the 0.8693 level, the declines accelerated. Currently, the 0.8693โ€“0.8688 zone represents key resistance. Only a return of the price above this zone could shift the balance of power on the chart. For now, the base scenario remains a decline toward the lows at 0.8617.

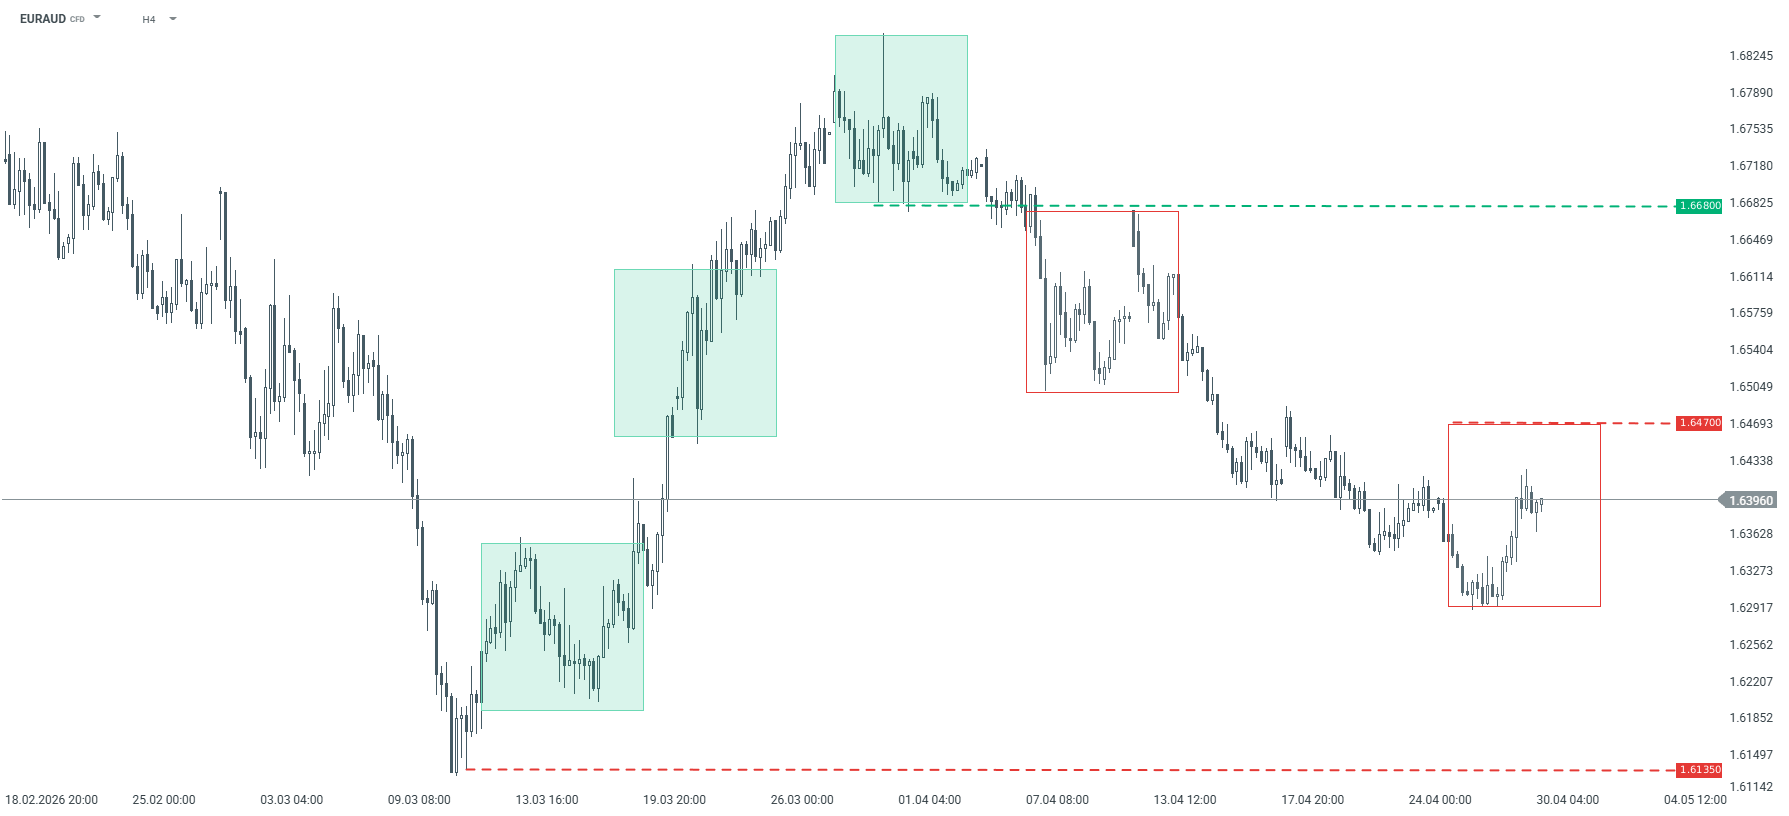
EURGBP – H4 timeframe. Source: xStation EURAUD From March 11 through the end of the month, the EURAUD pair was in an uptrend; however, the largest corrective pattern was subsequently negated at the 1.6680 level, which was then tested from the opposite side. Since then, we have observed the development of a downtrend. The largest current corrective pattern (marked in red) defines a key resistance level at 1.6470. According to the Overbalance methodology, as long as the price remains below this level, the downtrend remains in effect.

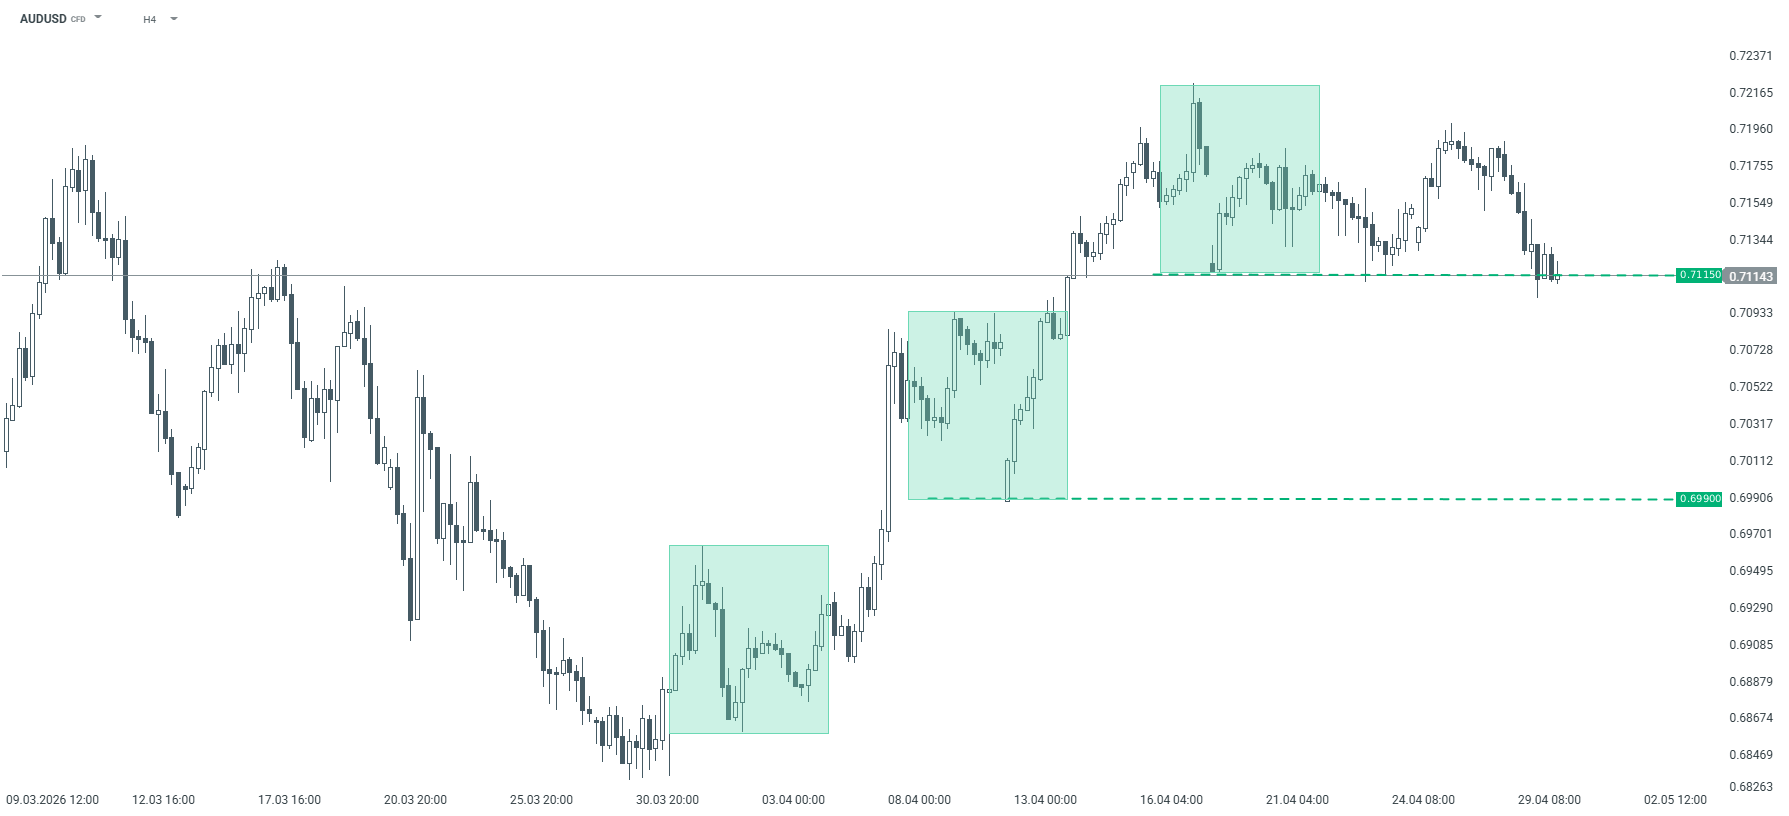
EURAUD – H4 timeframe. Source: xStation AUDUSD Since late March, the AUDUSD pair has been in an uptrend. Recently, the exchange rate has twice tested support at the 0.7015 level, which corresponds to the lower boundary of the 1:1 pattern. As long as this level holds, the uptrend remains intact. It is worth noting, however, that another test of this zone could weaken it, increasing the risk of it being broken and thus triggering a larger downward correction.

AUDUSD – H4 chart. Source: xStation

Currency Hedger No Comments

AUD/USD – Bullish USD to cap recovery from 0.7100/two-week low

  • AUD/USD stages a modest recovery from a two-week low, around 0.7100, touched on Wednesday.
  • The Fedโ€™s hawkish tilt and Iran tensions continue to underpin the USD, warranting caution for bulls.
  • The technical setup suggests that any further move up is likely to be sold into and remain capped.

Theย AUD/USDย pair gains some positive traction during the Asian session on Thursday and recovers a part of the previous day’s heavy losses to the 0.7100 mark, or a two-week low.

Expectations that the Reserve Bank of Australia (RBA) will stick to its hawkish stance counter China’s mixed official PMIs and turn out to be a key factor offering some support to the Australian Dollar (AUD). The US Dollar (USD), on the other hand, sticks to its positive tone near the highest level since April 13 on the back of persistent geopolitical uncertainties stemming from stalled US-Iran peace talks. Furthermore, diminishing odds for any further policy easing by the US Federal Reserve (Fed) underpin the USD and should cap the upside for the AUD/USD pair.

From a technical perspective, spot prices have repeatedly failed to find acceptance above the 0.7200 mark and have oscillated in a range over the past two weeks or so. Meanwhile, the overnight slide confirms a breakdown below the 0.7130-0.7125 confluence โ€“ comprising the 100-period Simple Moving Average (SMA) on the 4-hour chart and the 23.6% Fibonacci retracement level of the recent recovery from the year-to-date low touched in March. This, in turn, favors the AUD/USD bears, suggesting that the move higher might now be seen as a selling opportunity.

Moreover, the Relative Strength Index (RSI) holds around 40 and hints at modest bearish momentum. Meanwhile, the Moving Average Convergence Divergence (MACD) is in negative territory but flattening, suggesting downside pressure is softening rather than accelerating.

In the meantime, immediate resistance emerges at the 23.6% Fibonacci retracement at 0.7131, with a stronger barrier at the recent cycle high near 0.7223. On the downside, initial support aligns with the 0.7100 mark ahead of the 38.2% retracement at 0.7074. This is followed by the 50.0% level at 0.7027 and deeper supports at the 61.8% and 78.6% retracements at 0.6981 and 0.6915, respectively, where buyers would likely attempt to slow any extended pullback.

(The technical analysis of this story was written with the help of an AI tool.)

AUD/USD 4-hour chart

Chart Analysis AUD/USD

US Dollar Price Today

The table below shows the percentage change of US Dollar (USD) against listed major currencies today. US Dollar was the strongest against the Euro.

USDEURGBPJPYCADAUDNZDCHF
USD0.11%0.00%0.00%-0.04%-0.11%-0.08%-0.01%
EUR-0.11%-0.07%-0.13%-0.16%-0.21%-0.17%-0.10%
GBP-0.01%0.07%-0.02%-0.08%-0.12%-0.09%-0.02%
JPY0.00%0.13%0.02%-0.06%-0.11%-0.13%-0.04%
CAD0.04%0.16%0.08%0.06%-0.08%-0.06%0.04%
AUD0.11%0.21%0.12%0.11%0.08%0.04%0.12%
NZD0.08%0.17%0.09%0.13%0.06%-0.04%0.08%
CHF0.00%0.10%0.02%0.04%-0.04%-0.12%-0.08%

The heat map shows percentage changes of major currencies against each other. The base currency is picked from the left column, while the quote currency is picked from the top row. For example, if you pick the US Dollar from the left column and move along the horizontal line to the Japanese Yen, the percentage change displayed in the box will represent USD (base)/JPY (quote)