Key takeaways
- What is the technical outlook for USDCAD, AUDUSD and EURNZD?
This analysis from the Overbalance series aims to identify three financial instruments, analysed primarily on the daily/four-hour (D1/H4) timeframe. The analysis utilises only the Overbalance methodology, which helps to identify points where a trend may continue or where a reversal may occur. Today’s analysis covers three instruments, assessed solely in terms of 1:1 correction structures. USDCAD USDCAD prices remained in a downtrend throughout April, but in recent days the 1:1 downtrend pattern has been negated at the 1.3630 level, which, according to the Overbalance methodology, may signal a significant upward correction or even a trend reversal. Currently, the key support level remains at 1.3655, where the lower boundary of the local 1:1 pattern is located. As long as the price remains above this level, the bullish scenario remains in place. Conversely, a return below 1.3630, i.e. below the polarity of the previously negated pattern, could once again open the way for further declines.
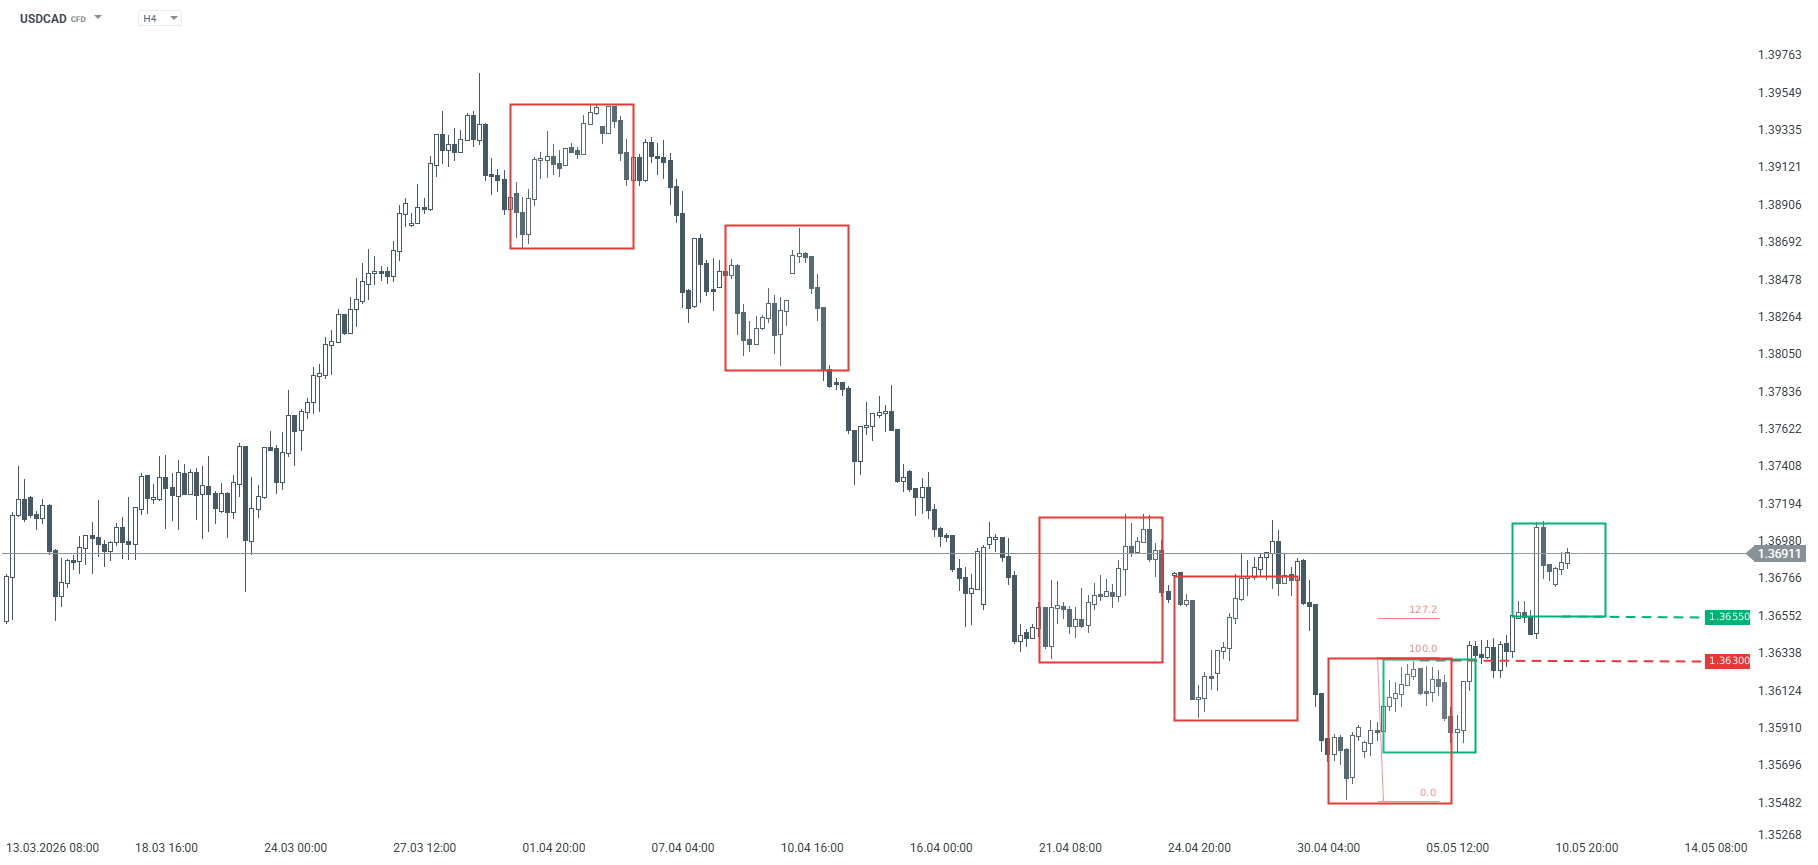
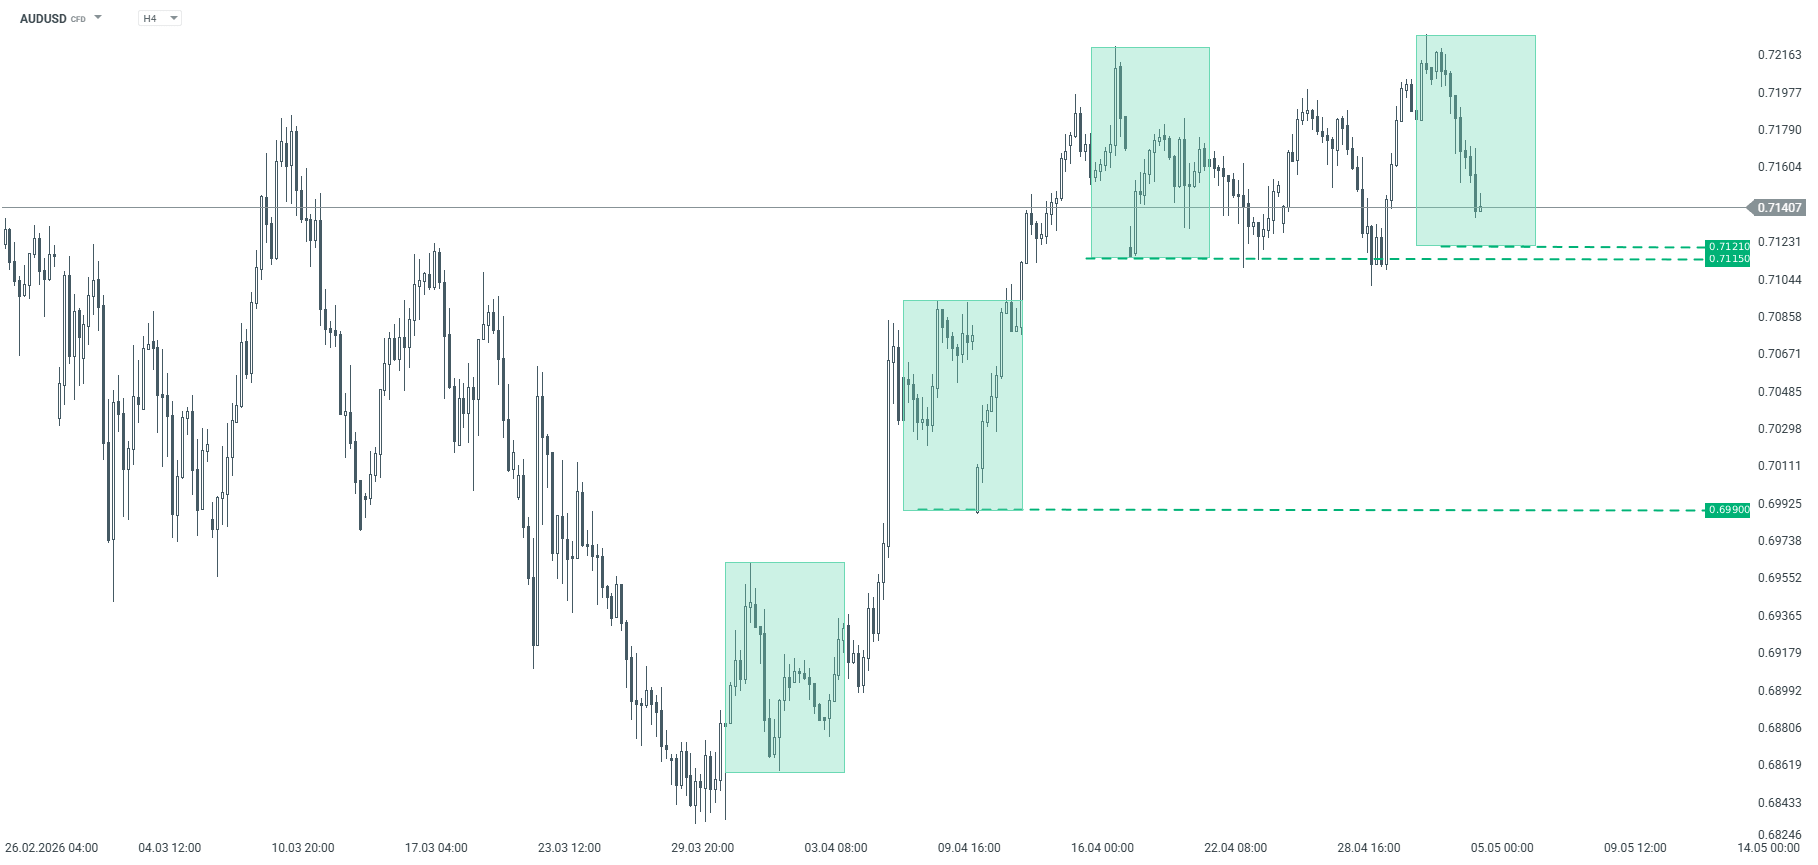
USDCAD – H4 timeframe. Source: xStation AUDUSD The AUDUSD exchange rate has been on an upward trend since the beginning of April. The key support level for the exchange rate is currently 0.7170. According to the Overbalance methodology, as long as the price remains above this level, the upward trend remains in place.
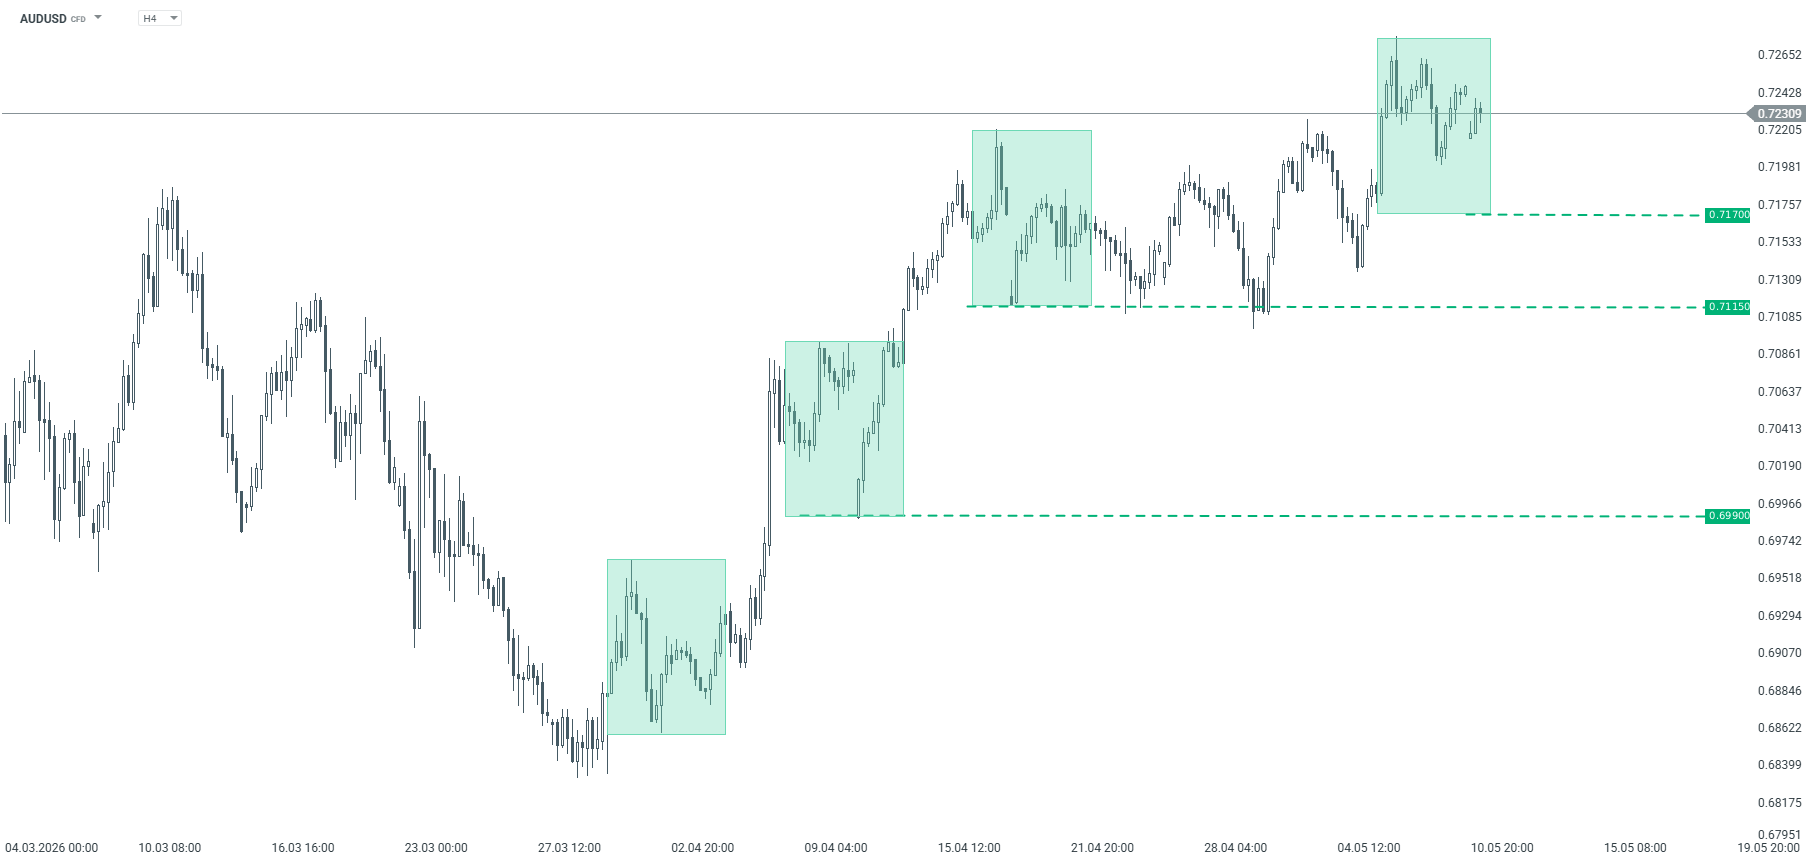
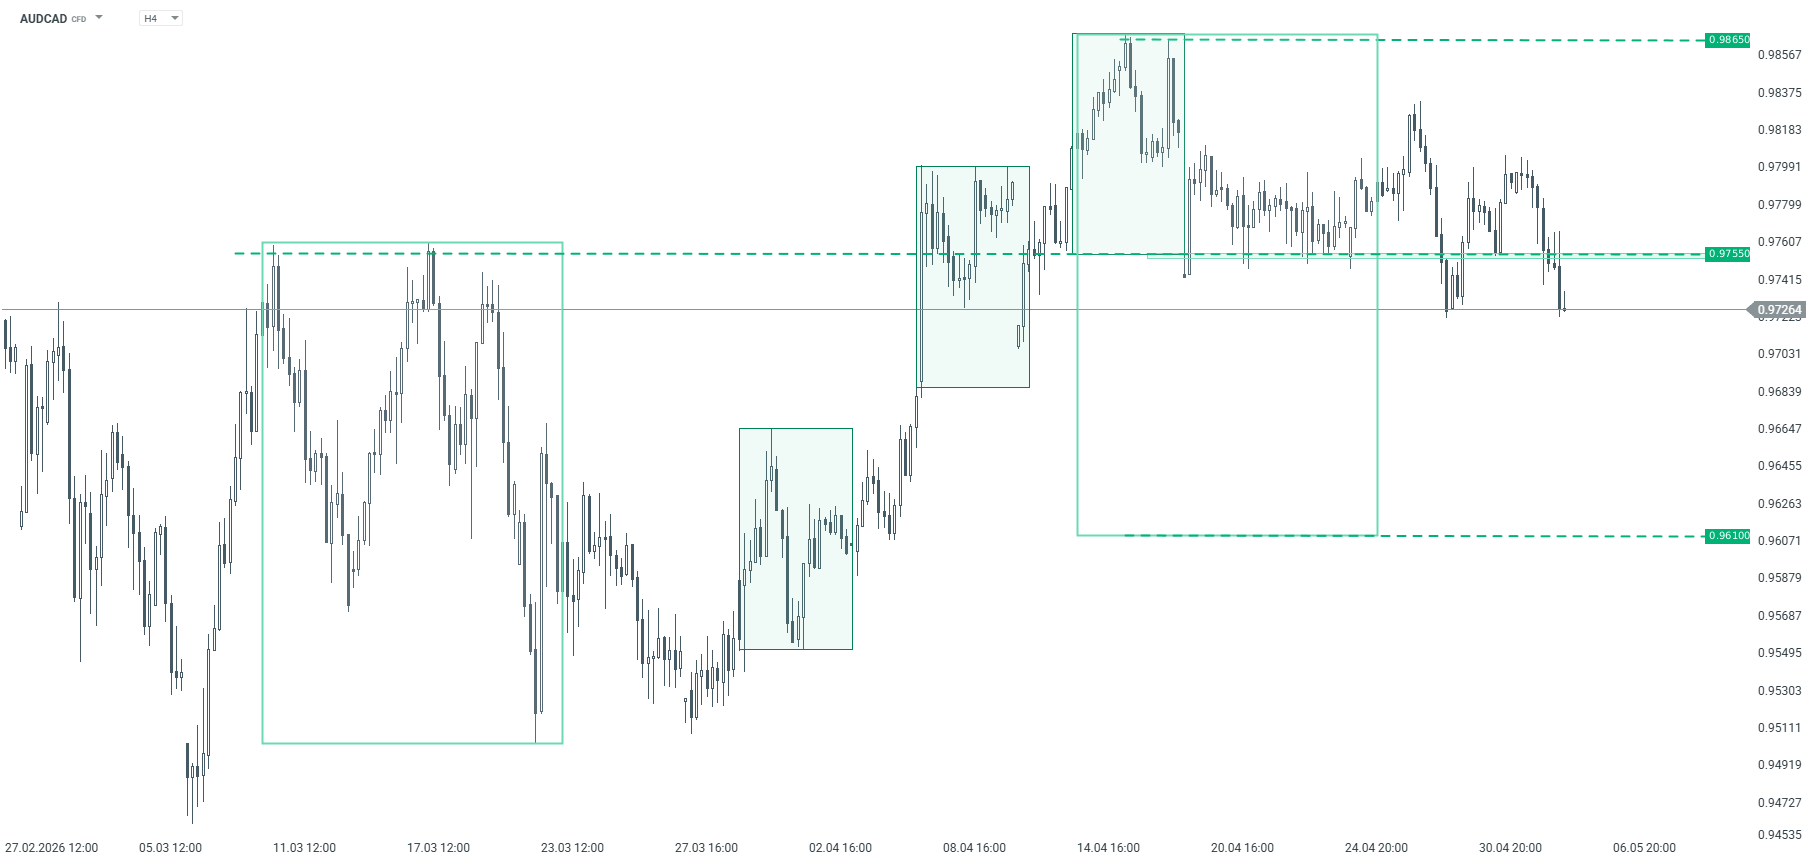
AUDUSD – H4 chart. Source: xStation EURNZD Since 7 April, the EURNZD has been trading in a downtrend. Should the upward correction extend, the key resistance level remains at 1.9872. As long as the price stays below this level, the bearish scenario remains in place. Conversely, for a return to the uptrend to be considered, the price would need to rise above the 1.9969 level, where the polarity of the previously negated 1:1 upward geometry is located.
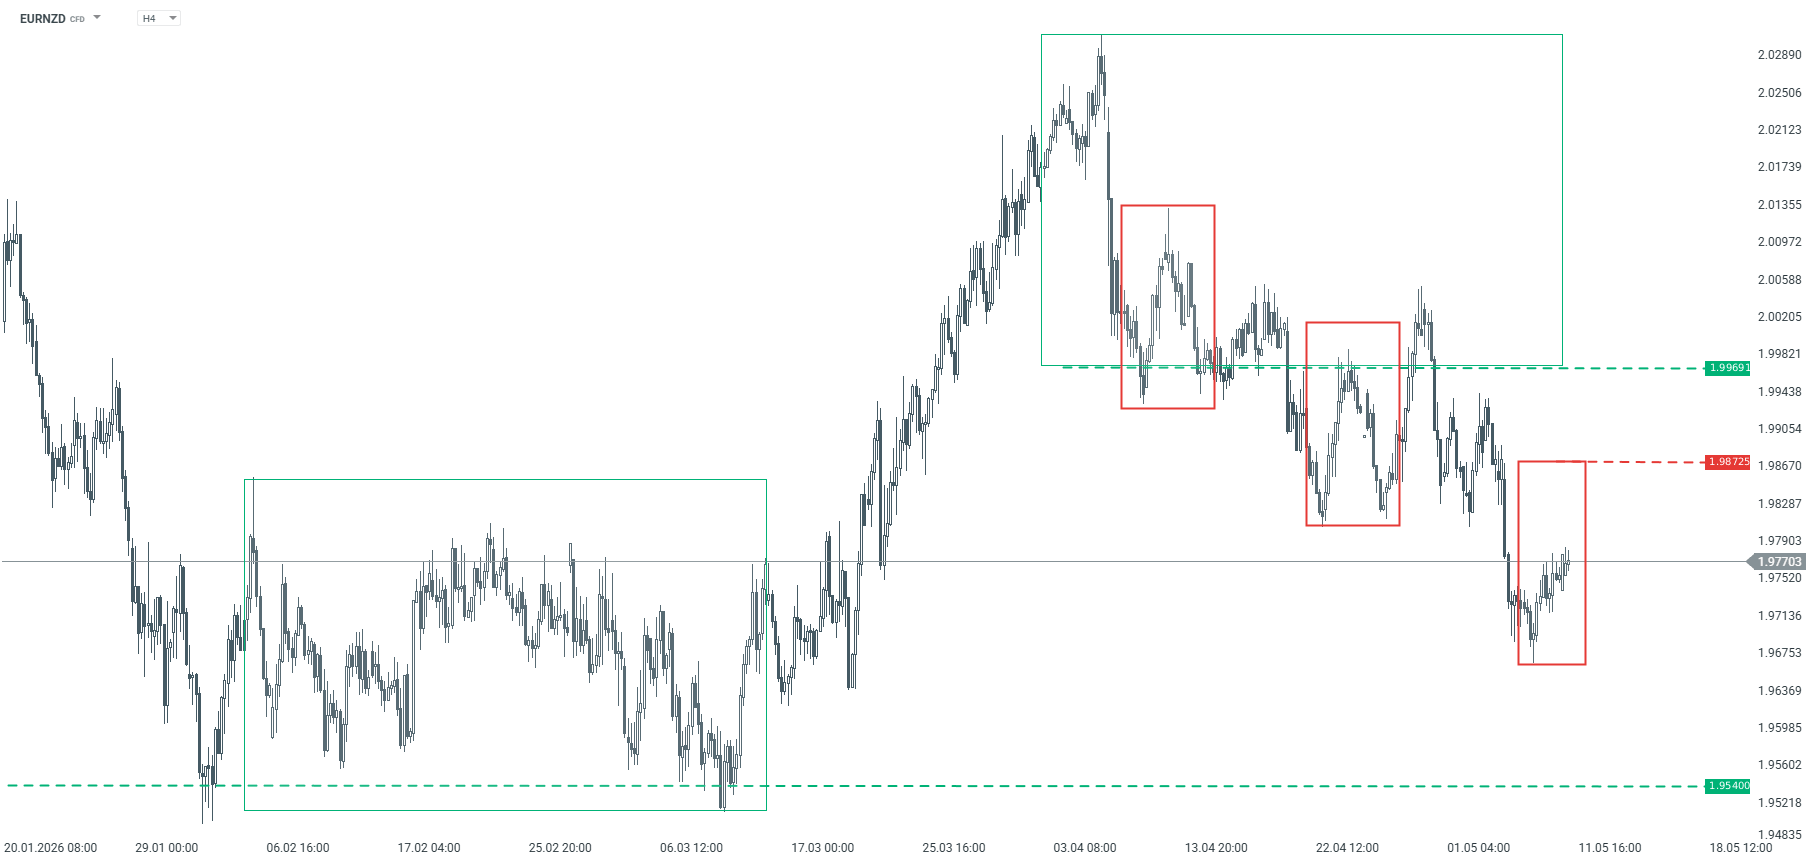
EURNZD – H4 timeframe. Source: xStation