Currency Hedger No Comments

AUD/JPY Price Forecast: Gains ground above 110.00 as mild bullish bias persists

  • AUD/JPY drifts higher to around 110.20 in Mondayโ€™s Asian session.ย 
  • The cross keeps a mildly bullish vibe, but further consolidation cannot be ruled out amid neutral RSI momentum.ย 
  • The first upside barrier emerges at 111.25; initial support is located at 110.00.ย ย 

The AUD/JPY cross attracts some buyers to near 110.20 during the Asian trading hours on Monday. The Australian Dollar (AUD) edges higher against the Japanese Yen (JPY) on expectations of further interest rate hikes from the Reserve Bank of Australia (RBA). 

However, the upside for the cross might be limited as escalating tensions in the Middle East could boost safe-haven demand for the JPY. Iranโ€™s central military command on Monday warned of far more โ€œdevastating and widespreadโ€ retaliation if its adversaries hit civilian targets. The statement came after US President Donald Trump threatened to destroy Iranโ€™s power plants and bridges if Tehran didnโ€™t make a deal to fully reopen the Strait of Hormuz.

Chart Analysis AUD/JPY

Technical Analysis:

In the daily chart, the near-term bias of AUD/JPY is mildly bullish as price holds above the rising 100-day exponential moving average near 107.35, extending the broader uptrend despite the latest pullback. The RSI eases to the midline, suggesting that further consolidation cannot be ruled out in the near term. 

Immediate resistance emerges near the Bollinger middle band of 111.25. Above that, the next upside reference aligns near the March 19 high of 112.61, en route to the upper Bollinger Band of 113.65. On the downside, initial support is seen at the 110.00 psychological level. A deeper setback would target the lower limit of the Bollinger Band near 108.75, followed by the 100-day EMA around 107.35. 

Currency Hedger No Comments

AUD/USD Price Forecast: Tests nine-day EMA after breaking above 0.6900

  • AUD/USD may find the initial support at the 11-week low of 0.6833.
  • The 14-day Relative Strength Index hovers near 43, suggesting mild bullish pressure.
  • The pair tests the immediate barrier at the nine-day EMA of 0.6918.

AUD/USDย holds gains after two days of losses, trading around 0.6910 during the Asian hours on Monday. The technical analysis of the daily chart indicates that the pair remains within a descending wedge pattern, suggesting that selling pressure is gradually weakening as lower highs and lower lows converge. This structure often reflects a loss of bearish momentum, increasing the likelihood of a bullish breakout.

However, the 14-day Relative Strength Index (RSI) is around 43, suggesting a bearish bias, with momentum slipping below the midline after failing to sustain earlier strength. Moreover, the near-term bias is bearish as the AUD/USD pair holds below the nine-day Exponential Moving Average (EMA) and the flatter 50-day EMA.

The initial support lies at the 11-week low of 0.6833, which was recorded on March 30, followed by the lower boundary of the descending wedge around 0.6810. A break below the wedge would strengthen the bearish bias and open the doors for the AUD/USD pair to navigate the region around a deeper 0.6400 rebound support zone.

The AUD/USD pair could find the immediate barrier at the nine-day EMA of 0.6918, followed by the 50-day EMA at 0.6958 around the upper boundary of the wedge. A sustained break above this confluence resistance zone would lead the pair to test the 0.7187, the highest since June 2022, reached on March 11.

AUD/USD: Daily Chart

(The technical analysis of this story was written with the help of an AI tool.)

Australian Dollar Price Today

The table below shows the percentage change of Australian Dollar (AUD) against listed major currencies today. Australian Dollar was the strongest against the Swiss Franc.

USDEURGBPJPYCADAUDNZDCHF
USD-0.02%-0.09%-0.05%-0.05%-0.15%-0.14%0.09%
EUR0.02%-0.04%-0.06%0.00%-0.14%-0.14%0.09%
GBP0.09%0.04%-0.02%-0.00%-0.09%-0.10%0.16%
JPY0.05%0.06%0.02%0.02%-0.11%-0.11%0.13%
CAD0.05%-0.00%0.00%-0.02%-0.10%-0.10%0.14%
AUD0.15%0.14%0.09%0.11%0.10%-0.01%0.24%
NZD0.14%0.14%0.10%0.11%0.10%0.01%0.26%
CHF-0.09%-0.09%-0.16%-0.13%-0.14%-0.24%-0.26%

The heat map shows percentage changes of major currencies against each other. The base currency is picked from the left column, while the quote currency is picked from the top row. For example, if you pick the Australian Dollar from the left column and move along the horizontal line to the US Dollar, the percentage change displayed in the box will represent AUD (base)/USD (quote).

Currency Hedger No Comments

Trade of The Day – AUD/JPY

Facts: 
Pair bounced off the lower limit of the 1:1 structure at 109.80
The main sentiment remains bullish from April 2025

Recommendation: 
Trade: Long AUDJPY at market price
Target: 113.45
Stop: 108.80

Opinion: Looking at the D1 interval on AUDJPY chart, one can see that the price bounced off the key support. The support is marked with the lower limit of 1:1 structure at 109.80. In addition, the price sits above the 100-period moving average from the D1 interval. Taking this into account, another upward impulse is the base case scenario. We recommend going long AUDJPY at market price with a target of 113.45. We also recommend placing a stop loss order at 108.80. Source: xStation5
 

Currency Hedger No Comments

Australian Dollar gains traction ahead of US jobs report

  • AUD/USD gathers strength around 0.6900 in Fridayโ€™s early European session.ย 
  • Westpac analysts expect the RBA to increase the cash rate by 25 basis points in May, June and August 2026.ย 
  • Traders brace for the US employment data for March later on Friday.ย 

Theย AUD/USDย pair gains ground near 0.6900 during the early European trading hours on Friday. Hawkish tone from the Reserve Bank of Australia (RBA) underpins the Australian Dollar (AUD) against the Greenback. Trading volumes are likely to be thin due to the Good Friday holiday. Traders will keep an eye on the US March jobs report later on Friday.

Market expectations for the May meeting lean toward another potential rate hike due to rising oil prices and a tight labor market. Westpac analysts expect the RBA to deliver three further rate hikes in 2026. This would take the cash rate to 4.85%, a level not seen since November 2008. 

On the other hand, escalating conflict in the Middle East, including the effective closure of the Strait of Hormuz, could prompt traders to move into a safe-haven currency such as the US Dollar (USD). US President Donald Trump pressures Iran “to make a deal” after a military strike destroys a bridge near Tehran. 

Iranโ€™s foreign minister Abbas Araghchi stated that Washingtonโ€™s recent strikes on civilian infrastructure will not force the country to back down, adding that such actions โ€œconvey the defeat and moral collapse of an enemy in disarray.โ€

The US employment data for March will be published on Friday. Theย Nonfarm Payrollsย (NFP) are expected to show an increase ofย 60,000 jobs in March. Meanwhile, the Unemployment Rate is forecast to hold steady at 4.4% during the same period.ย 

Currency Hedger No Comments

AUD slips despite February Trade Surplus more than doubles

  • Australian Dollar weakens despite Trade Surplus more than doubling in February.
  • Australiaโ€™s Trade Surplus widened to AUD 5,686 million from a revised AUD 2,258 million previously.
  • President Trump signaled that the US intends to conclude the Iran conflict quickly.

AUD/USD depreciates after two days of gains, trading around 0.6900 during the Asian hours on Thursday. The pair weakens as the Australian Dollar (AUD) comes under pressure despite robust trade data, with Australiaโ€™s Trade Surplus more than doubling in February to its highest level in seven months, supported by strong gains in gold and agricultural exports, while imports of gold and data processing equipment declined.

Australiaโ€™s Trade Surplus expanded to AUD 5,686 million in February from a downwardly revised AUD 2,258 million in the previous month, significantly exceeding market expectations of an AUD 2,500 million surplus and marking the largest surplus since July 2025.

Exports increased 4.9% month-over-month (MoM) to a four-month high, rebounding from a revised 1.6% decline in the prior month. Meanwhile, imports fell 3.2% MoM to a seven-month low, reversing a revised 1.1% increase in January, reflecting softer domestic demand and ongoing uncertainty in global trade flows amid geopolitical tensions.

The AUD/USD pair also faces downside pressure as the US Dollar (USD) strengthens, even as safe-haven demand fades amid rising optimism over Middle East peace. US President Donald Trump stated on Thursday that Iranโ€™s military capabilities have been significantly weakened, noting that its missile and drone capacity has been curtailed.

Trump added that the US no longer relies on Middle Eastern oil and emphasized that Iranโ€™s naval and air forces have been severely diminished, with leadership losses further reducing its operational strength, while signaling that the US intends to conclude the conflict swiftly.

Currency Hedger No Comments

AUD/USD – Middle East peace hopes back further recovery towards 20-day EMA

  • AUD/USD rises further to near 0.6910 as de-escalation in the Middle East war has boosted investorsโ€™ risk appetite.
  • Both the US and Iran have signaled readiness to end the Middle East war.
  • Investors await the US ADP Employment data for fresh cues on the interest rate outlook.

The AUD/USD pair gives back some of its early gains, but still trades 0.12% higher to near 0.6910 during the late Asian trading session on Wednesday. The Aussie pair extends Tuesdayโ€™s recovery move, as hopes of a ceasefire in the Middle East have strengthened after comments from both the United States (US) and Iran signaling willingness to end the war.

The expectation of an end to the month-long Middle East war has improved the demand of riskier assets. As of writing, S&P 500 futures trade 0.33% higher even after surging almost 3% on Tuesday, reflecting a significant improvement in investors; risk appetite.

Meanwhile, the US Dollar (USD) extends its corrective move as its safe-haven demand has diminished amid de-escalating Middle East tensions. During the press time, the US Dollar Index (DXY), which gauges the Greenbackโ€™s value against six major currencies, trades 0.1% lower to near 99.75.

Going forward, investors will focus on the US ADP Employment Change and theย Manufacturing PMIย data for March, which will be published in the North American session. Investors will pay close attention to the private employment data to get fresh cues on the US interest rateย outlook.

AUD/USD technical analysis

AUD/USDย trades higher at around 0.6910 at the press time. However, the near-term bias is mildly bearish as the pair now holds below the 20-day Exponential Moving Average (EMA), which has started to roll over after capping recent rebounds near the 0.70 area. Price has transitioned from trading above this average to respecting it as dynamic resistance, underscoring a loss of upside momentum from the mid-0.71 region.

The recovery move by the 14-day Relative Strength Index (RSI) above 40.00 after sliding below that level signals the presence of buying interest at lower levels, which diminishes the strength of an overall bearish tone.

Initial resistance emerges at 0.6980, where the 20-day EMA clusters with recent minor swing highs, followed by stronger resistance at 0.7050, whose break would be needed to challenge the 0.7120 peak. On the downside, the March 31 low at 0.6834 is the immediate support is at 0.6885, guarding the late pullback lows, with a break exposing the January 7 high of 0.6766 as the next level.

Currency Hedger No Comments

AUD/USD Price – Consolidates around 0.6850 as bears await break below 100-day SMA

  • AUD/USD enters a bearish consolidation phase near a two-month low set on Monday.
  • The hawkish RBA Minutes and Iran de-escalation hopes offer some support to the pair.
  • The technical setup seems tilted in favor of bears and backs the case for deeper losses.

The AUD/USD pair seesaws between tepid gains/minor losses during the Asian session on Tuesday and consolidates its recent losses registered over the past week or so, to its lowest level in over two months, touched the previous day. Spot prices currently trade around mid-0.6800s, nearly unchanged for the day, amid mixed fundamental cues.

The Australian Dollar (AUD) draws some support from the hawkish Reserve Bank of Australia (RBA) meeting Minutes, showing that board members agreed further tightening would likely be needed. Adding to this, reviving hopes for a de-escalation of tensions in the Middle East boosts investors’ confidence, prompting a modest US Dollar (USD) pullback from the year-to-date and further benefiting the risk-sensitive AUD/USD pair.

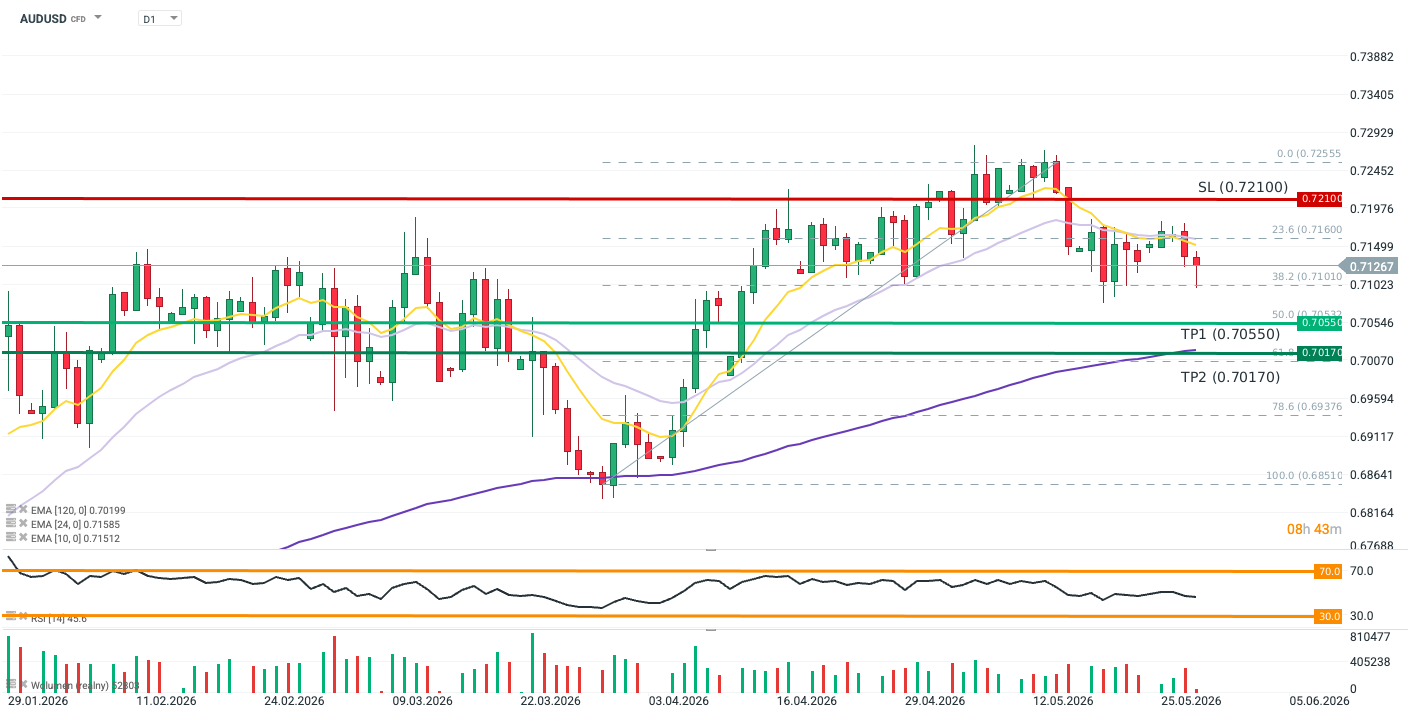
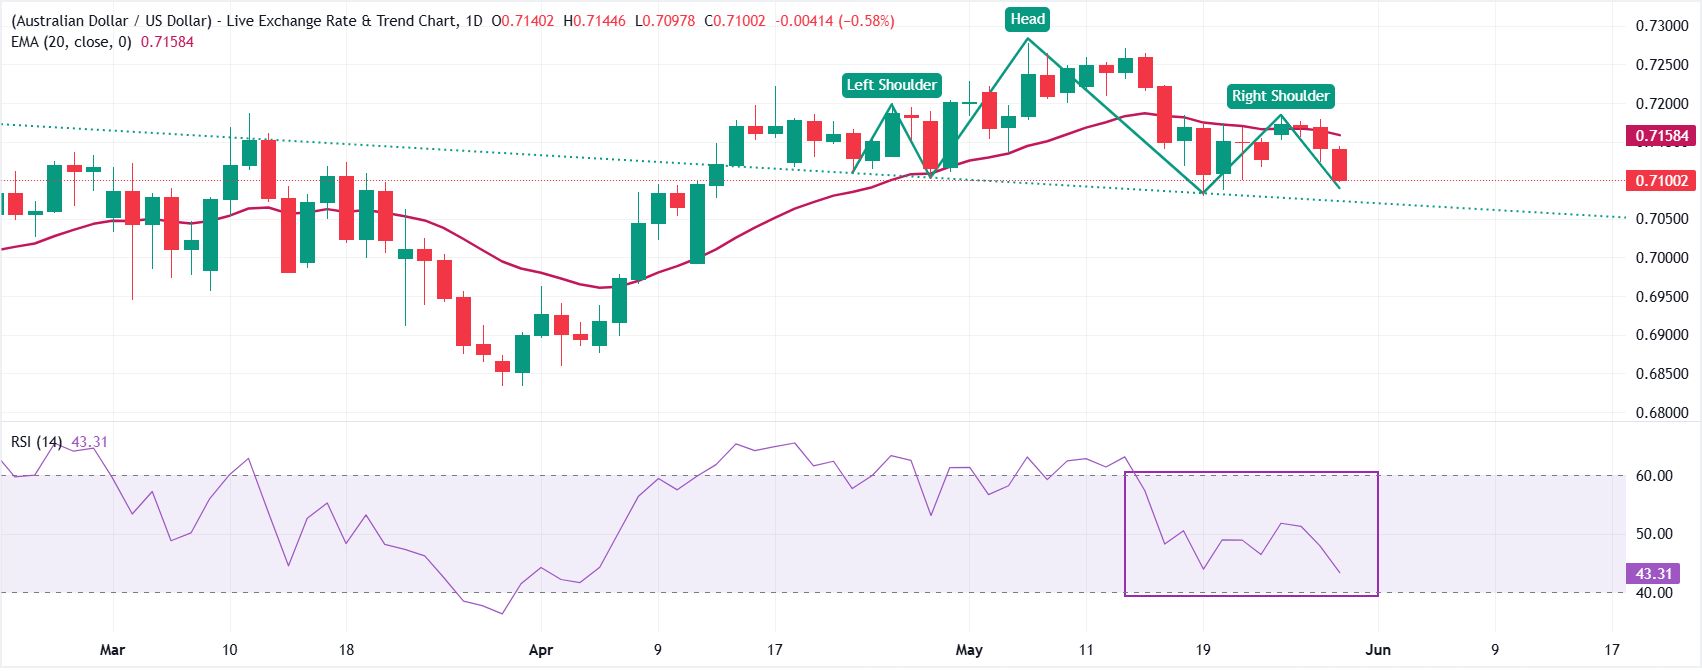
From a technical perspective, spot prices find some support near the rising 100-day Simple Moving Average (SMA), around the 0.6820 area, which tempers the downside. However, the Moving Average Convergence Divergence (MACD) indicator stays below its signal line in negative territory, while the Relative Strength Index (RSI) slips toward 36, both reinforcing fading bullish momentum and favoring further corrective pressure.

The 100-day SMA is closely followed by the 38.2%ย Fibonacciย retracement level of the November-March move higher, around the 0.6800 round figure, which should act as a key pivotal point for short-term traders. Some follow-through selling below the recent lows in the 0.6880โ€“0.6850 region would turn the focus toward the 61.8% Fibo. level at 0.6713. A clear break under 0.6713 would open the path toward the 78.6% level at 0.6586 and signal a deeper fall.

On the flip side, the initial resistance emerges at the 50% retracement at 0.6803, now acting as a nearby pivot, with stronger resistance at the 38.2% Fibo. level at 0.6892. A sustained recovery above 0.6892 would expose the 23.6% retracement at 0.7003, where sellers previously capped advances. Nevertheless, the near-term bias is mildly bearish as theย AUD/USDย pair holds well below the 23.6% Fibo. retracement near the 0.7000 psychological mark.

(The technical analysis of this story was written with the help of an AI tool.)

AUD/USD daily chart

Chart Analysis AUD/USD
Currency Hedger No Comments

AUD/USD weakens on Middle East tensions as markets await RBA minutes

  • AUD/USD weakens as rising geopolitical tensions in the Middle East weigh on investor sentiment.
  • Threats to key Oil shipping routes and the involvement of the Houthis increase fears of a broader escalation.
  • Markets continue to assess the outlook for Australian interest rates ahead of the RBAโ€™s minutes release.

AUD/USD trades around 0.6860 on Monday at the time of writing, down 0.21% on the day, as investors adopt a cautious stance amid escalating geopolitical tensions in the Middle East.

Market sentiment remains fragile after Iran-backed Houthi forces in Yemen joined the conflict between Israel and Iran. Over the weekend, the militants launched missiles toward Israel and threatened to close the Bab el-Mandeb Strait, a strategic shipping route for Middle Eastern Oil supplies. This new source of uncertainty has increased fears of a broader regional escalation and added volatility to financial markets.

In this environment ofย risk aversion, growth-sensitive currencies such as the Australian Dollar (AUD) tend to come under pressure, while investors shift toward assets perceived as safer. The conflict is also complicating theย outlookย for energy markets, with some analysts warning that Oil prices could rise further if maritime routes are disrupted.

On the political front, US President Donald Trump said on Monday that Washington is holding โ€œserious discussionsโ€ with what he described as a new regime in Iran in an effort to end military operations. However, he also warned that the US could launch massive strikes against Iranian energy infrastructure if a deal is not reached quickly or if the Strait of Hormuz remains closed to commercial traffic.

Markets have reacted cautiously to these remarks. Iranian officials have expressed skepticism about the negotiations, accusing Washington of speaking about diplomacy while preparing the ground for a possible military invasion.

On the Australian side, investors are focusing on the upcoming release of the minutes from the latest Reserve Bank of Australia (RBA) meeting, scheduled for Tuesday. The central bank raised its key interest rate by 25 basis points at that meeting, bringing the cash rate to 4.1%. Traders will look for clues in the minutes about the policy outlook in the coming months.

According to the ASXโ€™s RBA Rate Tracker, markets currently price in about a 69% chance of another rate hike at the May 5 meeting. Confirmation of this outlook could provide support to the Aussie, although geopolitical risks and shifts in global risk appetite remain key drivers forย AUD/USDย in the near term.

Australian Dollar Price Today

The table below shows the percentage change of Australian Dollar (AUD) against listed major currencies today. Australian Dollar was the strongest against the New Zealand Dollar.

USDEURGBPJPYCADAUDNZDCHF
USD0.20%0.24%-0.59%0.20%0.19%0.46%0.09%
EUR-0.20%0.03%-0.77%0.00%0.04%0.26%-0.12%
GBP-0.24%-0.03%-0.82%-0.02%-0.01%0.23%-0.15%
JPY0.59%0.77%0.82%0.79%0.78%1.03%0.66%
CAD-0.20%-0.00%0.02%-0.79%-0.01%0.19%-0.13%
AUD-0.19%-0.04%0.01%-0.78%0.01%0.24%-0.11%
NZD-0.46%-0.26%-0.23%-1.03%-0.19%-0.24%-0.38%
CHF-0.09%0.12%0.15%-0.66%0.13%0.11%0.38%

The heat map shows percentage changes of major currencies against each other. The base currency is picked from the left column, while the quote currency is picked from the top row. For example, if you pick the Australian Dollar from the left column and move along the horizontal line to the US Dollar, the percentage change displayed in the box will represent AUD (base)/USD (quote).