Currency Hedger No Comments

AUD/JPY hovers around 112.50 after paring latest losses

  • AUD/JPY may further struggle as the Australian Dollar faces challenges due to increased risk aversion.
  • US Vice President JD Vance confirmed USโ€“Iran talks in Islamabad ended without a deal after 21 hours of negotiations.
  • Japanโ€™s 10-year bond yield rose to 2.47% as oil surged after USโ€“Iran talks collapsed.

AUD/JPY pares its daily losses but remains in the negative territory, trading around 112.40 during the Asian hours on Monday. The currency cross faced challenges as the Australian Dollar (AUD) weakened asย risk aversionย increased after US Vice President JD Vance said Washington and Tehran failed to reach a peace agreement in Islamabad following 21 hours of talks.

US President Donald Trump said Washington would begin blockading all ships entering or leaving the Strait of Hormuz, while US Central Command (CENTCOM) confirmed operations targeting maritime traffic to and from Iranian ports from 10 AM ET (14:00 GMT) Monday.

Rising energy costs have also fueled inflation concerns, with Australiaโ€™s monthly inflation gauge hitting a record 1.3% in March, signaling renewed price pressures since late 2025. The Reserve Bank of Australia (RBA) has already raisedย ratesย by 50 basis points to 4.10%, and markets now expect another hike in May.

The downside of the EUR/JPY cross could be restrained as the Japanese Yen (JPY) struggles with stagflation concerns amid rising oil prices. Rising energy costs fueled expectations of a near-term Bank of Japan (BoJ) rate hike.

Theย BoJย is set to hold its next policy decision on April 28, where officials will evaluate whether elevated global energy and commodity prices justify tightening. Japanโ€™s 10-year government bond yield rose to around 2.47% on Monday as oil prices surged following the breakdown of USโ€“Iran peace talks.

The Sakura Report showed board members balancing upside inflation risks against downside growth risks following the April 6 branch managersโ€™ meeting. All nine regions maintained that their economies were either โ€œrecovering moderately,โ€ โ€œpicking up,โ€ or โ€œpicking up moderately.โ€

Currency Hedger No Comments

Currency Talk – GBP/USD, AUD/NZD, USD/CHF

This analysis from the Overbalance series aims to identify three financial instruments, analyzed primarily on the daily/four-hour (D1/H4) timeframe. The analysis relies solely on the Overbalance methodology, which helps determine points where a trend may continue or where a reversal might occur.
Todayโ€™s analysis covers three instruments, evaluated solely in terms of 1:1 correction structures.

GBPUSD
The GBPUSD price has broken its downward trend by rising above the 1.3360 level, which, according to the Overbalance methodology, paves the way for a larger upward correction or even a trend reversal. Currently, the 1.3360 levelโ€”the upper boundary of the negated 1:1 geometryโ€”serves as key support. Conversely, for a return to the downtrend, the price would also need to fall below the 1.3315 level, where the lower boundary of the local 1:1 uptrend pattern is located.

GBPUSD – H4 chart. Source: xStation

AUDNZD
The AUDNZD pair has been in an uptrend for quite some time. The latest correction was exactly the same size as the previous ones, marked by the green rectangle. We are currently observing a local corrective move. If the correction continues, key support based on the Overbalance methodology is at the 0.6992 level, where the lower boundary of the 1:1 pattern is located. As long as the price remains above this level, the uptrend remains in effect.

AUDNZD – H4 timeframe. Source: xStation

USDCHF
USDCHF prices have been trending downward for quite some time, but since late January we have seen a dynamic upward correction. Currently, the price has rebounded from a key resistance level at 0.8042, where the upper boundary of the largest 1:1 pattern is located, which, according to the Overbalance methodology, may signal a return to the downtrend. For this scenario to be confirmed, the price should sustainably fall below the 0.7902 level, where the lower boundary of the smaller pattern is located. In that case, a acceleration of the decline toward recent lows would be possible. Conversely, a break above the 0.8042 level would open the way for further gains.

USDCHF – H4 timeframe. Source: xStation

The material on this page does not constitute financial advice and does not take into account your level of understanding, investment objectives, financial situation or any other specific needs. All information provided, including opinions, market research, mathematical results and technical analyzes published on the Website or transmitted To you by other means, it is provided for information purposes only and should in no way be construed as an offer or solicitation for a transaction in any financial instrument, nor should the information provided be construed as advice of a legal or financial nature on which any investment decisions you make should be based exclusively To your level of understanding, investment objectives, financial situation, or other specific needs, any decision to act on the information published on the Website or sent to you by other means is entirely at your own risk if you In doubt or unsure about your understanding of a particular product, instrument, service or transaction, you should seek professional or legal advice before trading. Investing in CFDs carries a high level of risk, as they are leveraged products and have small movements Often the market can result in much larger movements in the value of your investment, and this can work against you or in your favor. Please ensure you fully understand the risks involved, taking into account investments objectives and level of experience, before trading and, if necessary, seek independent advice.

Currency Hedger No Comments

AUD/USD Rally pauses as RSI (14) struggles to extend above 60.00

  • AUD/USD corrects to near 0.7065 after a four-day winning streak.
  • Investors await the outcome of US-Iran ceasefire talks in Pakistan.
  • The US headline CPI is expected to have risen at a faster pace of 3.3% YoY in March.

The AUD/USD pair is down 0.23% to near 0.7065 in the late Asian trading session, struggling to extend its winning streak for the fifth trading day on Friday. The Aussie pair comes under pressure as the Australian Dollar (AUD) underperforms amid uncertainty surrounding the first round of talks between the United States (US) and Iran in Pakistan over the weekend regarding the permanent ceasefire.

Australian Dollar Price Today

The table below shows the percentage change of Australian Dollar (AUD) against listed major currencies today. Australian Dollar was the weakest against the US Dollar.

USDEURGBPJPYCADAUDNZDCHF
USD0.09%0.15%0.16%0.08%0.23%0.25%0.02%
EUR-0.09%0.05%0.09%-0.03%0.12%0.16%-0.08%
GBP-0.15%-0.05%0.04%-0.06%0.09%0.11%-0.14%
JPY-0.16%-0.09%-0.04%-0.09%0.07%0.04%-0.18%
CAD-0.08%0.03%0.06%0.09%0.13%0.16%-0.07%
AUD-0.23%-0.12%-0.09%-0.07%-0.13%0.02%-0.22%
NZD-0.25%-0.16%-0.11%-0.04%-0.16%-0.02%-0.24%
CHF-0.02%0.08%0.14%0.18%0.07%0.22%0.24%

The heat map shows percentage changes of major currencies against each other. The base currency is picked from the left column, while the quote currency is picked from the top row. For example, if you pick the Australian Dollar from the left column and move along the horizontal line to the US Dollar, the percentage change displayed in the box will represent AUD (base)/USD (quote).

Market participants doubt that US-Iran talks will go on smoothly amid continued military attacks in Lebanon between Iran-backed Houthis and the Israeli army.

Israeli Prime Minister (PM) Benjamin Netanyahuย has pushed back hopes of a ceasefire in Lebanon, stating thatย Tel Aviv would continue โ€œto strike Hezbollah with full forceโ€ as the countryโ€™s military launched fresh strikes.

On Thursday, Israeli PM Netanyahu stated, through a tweet on X, that he is open to direct negotiations with Lebanon after repeated requests from the nation.

On the macro front, investors await the USย Consumer Price Indexย (CPI) data for March, which will be published at 12:30 GMT. The US headline inflation is expected to arrive significantly higher at 3.3% from 2.4% in February.

AUD/USD technical analysis

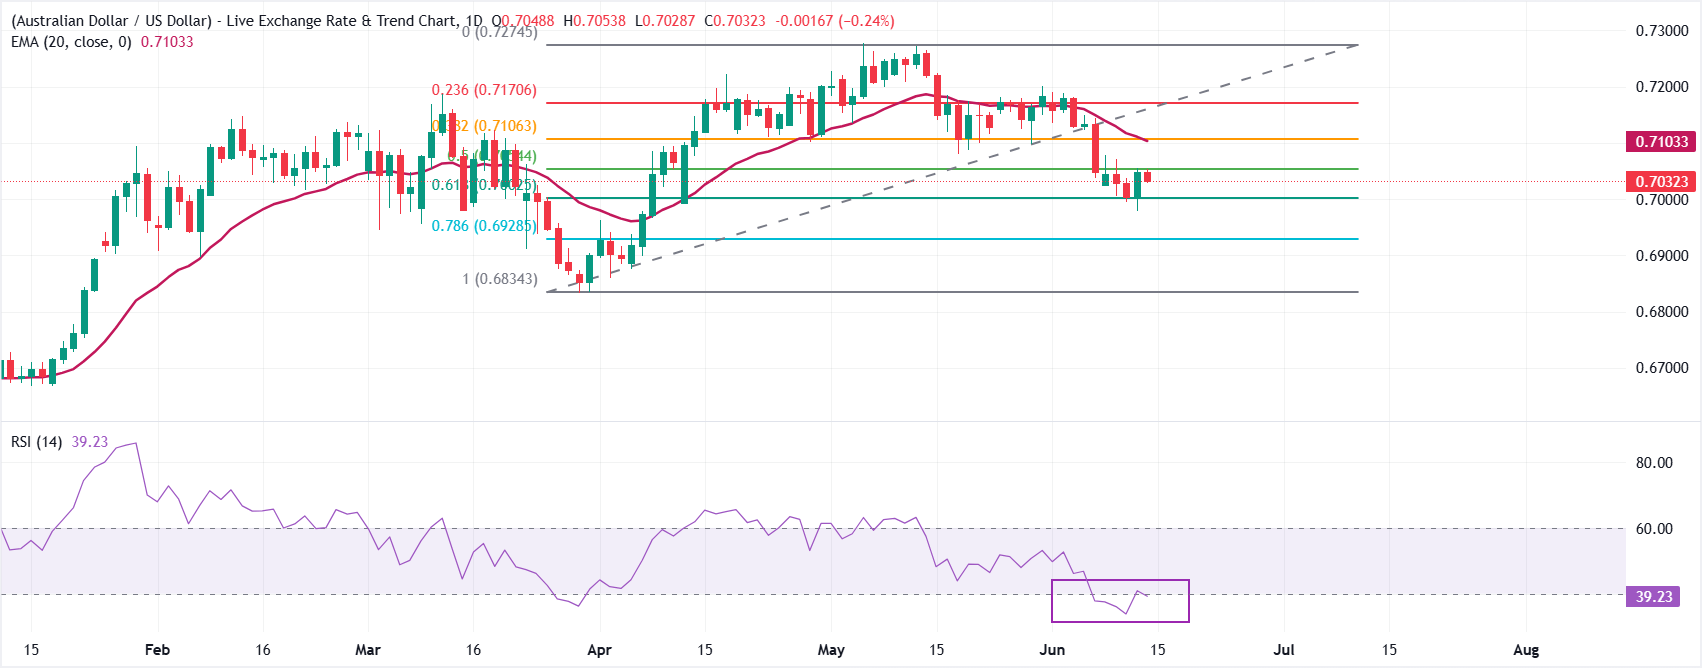
AUD/USDย trades lower at around 0.7065 as of writing. However, the pair maintains a constructive bullish bias as spot holds above the 20-day exponential moving average (EMA) at 0.6989. The pair has rebounded from last monthโ€™s lows and is stabilizing near recent highs.

However, the price needs a fresh trigger to extend its upside, with the Relative Strength Index (RSI) struggling to break into the 60.00s zone.

On the downside, initial support is provided by the 20-day EMA at 0.6989, which reinforces the short-term bullish structure as long as it holds on closing bases. A daily close below this dynamic floor would signal fading upward momentum and expose a deeper correction towards the April 7 low around 0.6900.

Looking up, the April 9 high around 0.7100 is the immediate resistance; a decisive break above the same would allow the price to extend its rebound towards the March high at 0.7187.

Currency Hedger No Comments

AUD declines due to fading optimism surrounding US-Iran ceasefire

  • AUD/USD weakens as the Australian Dollar struggles amid fading optimism, with the Iran 10-point deal lacking full commitment.
  • Markets now expect an RBA rate hike in May, with rates projected to reach 4.61% by year-end.
  • Iran says recent actions violate the ceasefire, calling further talks with the US unreasonable.

AUD/USDย snaps a three-day winning streak, trading near 0.7030 during the Asian hours on Thursday. The risk-sensitive pair weakens as the Australian Dollar (AUD) comes under pressure amid fading optimism, with reports suggesting the 10-point framework lacks full commitment from both sides, leaving the deal fragile and incomplete.

However, the Middle East conflict, now in its second month, has lifted energy prices and heightened inflation risks, reinforcing expectations that global central banks may keep policy tighter for longer.

The Reserve Bank of Australia (RBA) has already raisedย ratesย by 50 basis points to 4.10% amid persistently high inflation. Markets now anticipate another hike in May, with rates seen reaching 4.61% by year-end.

According to Reuters, Iranian officials said recent developments violate the terms of the less-than-day-old ceasefire, calling it โ€œunreasonableโ€ to proceed with talks for a permanent agreement with the United States (US).

The warning from Iranโ€™s lead negotiator and parliament speaker, Mohammed Bager Qalibaf, underscores ongoing regional volatility. Iranโ€™sย Islamicย Revolutionary Guard Corps (IRGC) also claimed that shipping through the Strait of Hormuz had halted after Israel expanded strikes in Lebanon.

Traders await the US Consumer Price Index (CPI) report for March, due Friday. Headline inflation is expected to rise 3.3% year-over-year (YoY), up from 2.4%, driven by higher oil prices amid the Middle East conflict.

Currency Hedger No Comments

War-Related Shifts in The Forex Market – USD Plumets, AUD, NDZ and CHF Rebound

The two-week suspension of U.S. military operations against Iran triggered a sharp shake-up in the FX market today, reversing much of the movement seen in recent weeks. Across a broad range of currencies, cyclical currencies are the most actively bought, with the NZD, SEK, and ZAR leading the way, while the USD and CAD are at the very bottom of the strength rankings. Pairs such as NZDUSD, AUDUSD, and GBPUSD are rebounding sharply, benefiting from the simultaneous rise in U.S. index futures and the steep sell-off in oil following the largest one-day drop in crude prices in years. The dollar index is sliding by about 0.9%, which, amid a sharp rebound in risk appetite on the stock markets, is weakening demand for safe-haven assets and pushing defensive positions in the USDโ€”and to some extent in the JPYโ€”to the sidelines.

Todayโ€™s reaction follows the pattern seen in recent weeks, in which shifts in the intensity of the conflict with Iran quickly translate into movements among the dollar, the yen, oil, and gold, increasing volatility in major currency pairs. Above is a heatmap of volatility in the FX market. Source: xStation

However, the biggest beneficiary of todayโ€™s combination of a hawkish central bank and global de-escalation remains the kiwi: following the RBNZโ€™s decision, NZD/USD rose temporarily by as much as 2% to around 0.5844, and is currently holding gains of around 1.7% at an exchange rate of approximately 0.5824. Investors interpreted the bankโ€™s statement as a โ€œhawkish pauseโ€โ€”the RBNZ clearly signaled its readiness for rapid rate hikes if inflation spreads beyond the energy sector and begins to affect wages and price expectations. At the same time, the bank emphasized that the supply shock linked to the earlier rise in oil prices is temporary, and that weaker domestic demand and rising spare capacity limit the risk of a second round of inflation. In this environment, the NZD benefits in two waysโ€”as a currency with a relatively high interest rate premium and as a classic representative of the risk-on basket, which is now returning to favor following the suspension of U.S.-Iran hostilities. If the window for peace talks in Islamabad does not close too abruptly, the NZDโ€™s current edge over the USD may hold, though ongoing instability in the region and the risk of a sudden escalation still call for caution when extending positions. 

The NZDUSD pair tested an important long-term control point marked by the 200-day EMA today. The retest has so far proved unsuccessful.

Source: xStation

The material on this page does not constitute financial advice and does not take into account your level of understanding, investment objectives, financial situation or any other specific needs. All information provided, including opinions, market research, mathematical results and technical analyzes published on the Website or transmitted To you by other means, it is provided for information purposes only and should in no way be construed as an offer or solicitation for a transaction in any financial instrument, nor should the information provided be construed as advice of a legal or financial nature on which any investment decisions you make should be based exclusively To your level of understanding, investment objectives, financial situation, or other specific needs, any decision to act on the information published on the Website or sent to you by other means is entirely at your own risk if you In doubt or unsure about your understanding of a particular product, instrument, service or transaction, you should seek professional or legal advice before trading. Investing in CFDs carries a high level of risk, as they are leveraged products and have small movements Often the market can result in much larger movements in the value of your investment, and this can work against you or in your favor. Please ensure you fully understand the risks involved, taking into account investments objectives and level of experience, before trading and, if necessary, seek independent advice.

Currency Hedger No Comments

AUD/JPY Gains momentum, bullish bias prevails above 100-day EMA

  • AUD/JPY strengthens to near 111.80 in Wednesdayโ€™s Asian session.ย 
  • The cross maintains the constructive outlook above the 100-day EMA, with bullish RSI momentum.ย 
  • The initial support level is located at 111.00; the first upside barrier emerges at 112.50.ย ย 

The AUD/JPY cross gathers strength to around 111.80 during the Asian trading hours on Wednesday. The Australian Dollar (AUD) edges higher against the Japanese Yen (JPY) amid improved risk sentiment. US President Donald Trump said late Tuesday that he had agreed “to suspend the bombing and attack of Iran for a period of two weeksโ€ on the condition that Iran reopens the Strait of Hormuz.

Iranian Foreign Minister Seyed Abbas Araghchi stated that during the two weeks, safe passage through the Strait of Hormuz โ€œwill be possible via coordination with Iranโ€™s Armed Forces and with due consideration of technical limitations.โ€ Easing tensions in the Middle East undermines a safe-haven currency such as the JPY and acts as a tailwind for the cross in the near term. 

On the other hand, fears that Japanese authorities would step in to support the domestic currency might cap the downside for the JPY. Japan’s top currency diplomat Atsushi Mimura said last week that officials may need to take “decisive” steps if speculative moves persist in the currency market.

Chart Analysis AUD/JPY

Technical Analysis:

In the daily chart, the near-term bias of AUD/JPY is bullish as price extends its advance well above the 100-day exponential moving average around 107.50, confirming a dominant uptrend and resilient dip demand. The latest candles hold in the upper half of the Bollinger Band envelope, while the bands remain relatively wide, signalling sustained upside momentum rather than a volatility blow-off. RSI has rebounded toward the high-50s, recovering from mid-range readings and aligning with renewed buying pressure after the recent consolidation above the 111.00 handle.

Initial support emerges at 111.00, where recent lows converge with the mid-Bollinger zone, and a break below would expose deeper pullback risk toward the 110.00 area. Stronger downside protection aligns near the 109.00 region, close to the Bollinger lower band cluster and prior congestion, and a loss of this floor would weaken the broader bullish structure. On the topside, immediate resistance stands at the March 19 high of 112.61, followed by the upper boundary of the Bollinger Band of 113.15. 

Currency Hedger No Comments

Trade of The Day – GBP/AUD

Facts:
The price bounced off the upper limit of 1:1 structure at 1.9255
GBPAUD sits below the 100-period moving average form H4 interval

Recommendation: 
Trade: Short position on GBPAUD at market price
Target: 1.8765, 1.8518
Stop: 1.9475

Opinion: Looking at the GBPAUD chart at the H4 interval, one can see that the price bounced off the key resistance today. The price bounced off the resistance marked with the upper limit of 1:1 structure at 1.9255. According to the Overbalance strategy, as long as the price sits below the aforementioned resistance, the main trend remains downward. In addition the price sits below the 100-period moving average from the H4 interval which also confirms the bearish scenario.  We recommend going short GBPAUD at market price with two targets: 1.8765 and 1.8518. We also recommend placing a stop loss order at 1.9475 Source: xStation5

Currency Hedger No Comments

AUD/USD Wobbles around 0.6900 ahead of Iranโ€™s response to Trumpโ€™s ultimatum

  • AUD/USD trades with caution around 0.6900 ahead of Trumpโ€™s Iran deadline.
  • US President Trump threatened to destroy Iranโ€™s civilian infrastructure if it doesnโ€™t reopen the Hormuz.
  • Investors await the US FOMC minutes and the CPI data.

The AUD/USD pair trades in a tight range around 0.6900 during the early European trading session on Tuesday. The Aussie pair consolidates as investors await Tehranโ€™s response to United States (US) President Donald Trumpโ€™s warning to destroy Iranian power plants and bridges if it doesnโ€™t reopen the Strait of Hormuz by Tuesday, 08:00 PM ET.

Market sentiment remains cautious, with the S&P 500 futures trading 0.5% down during the press time. The US Dollar Index (DXY), which tracks the Greenbackโ€™s value against six major currencies, trades marginally higher around 100.10.

Ahead of the deadline, statements from Iranian officials indicate that the nation is unlikely to reopen the Hormuz, a scenario that could mark an escalation in the ongoing war. An advisor to Iran’s Parliament Speaker Mohammad Bagher Ghalibaf stated that โ€œTrump has about 20 hours to either surrender to Iran, or his allies will return to the Paleolithic Ageโ€.

On the domestic front, investors await the US Federal Open Market Committee (FOMC) minutes of the March policy meeting, which will be released on Wednesday. This week, the major highlight will be the US Consumer Price Index (CPI) data for March, which is scheduled for Friday.

AUD/USD technical analysis

AUD/USD trades cautiously at around 0.6910 as of writing. The near-term bias is mildly bearish as spot holds below the 20-day exponential moving average, which has started to roll over and cap bounces in the 0.6960 area. Price action shows a sequence of lower closes from the 0.71 region, while the RSI has slipped below the 50 line and stabilizes in the low-40s, confirming building downside momentum rather than oversold conditions.

Initial resistance emerges at the 20-day EMA near 0.6960, with a break above exposing the March 23 high around 0.7060 as the next barrier. On the downside, immediate support stands at 0.6880, guarding the recent trough at 0.6835. A daily close below 0.6835 would extend the bearish phase toward the 0.6800 handle, while recovery above 0.6960 would ease selling pressure and open a corrective phase within the broader range.