Currency Hedger No Comments

CAD dips vs USD; Oil strength to limit losses and cap USD/CAD

  • USD/CAD edges higher during the Asian session on Tuesday, though the upside seems limited.
  • The uncertainty over US-Iran peace talks revives USD demand and lends support to spot prices.
  • Elevated Oil prices underpin the Loonie and cap the pair ahead of the BoC/Fed rate decisions.

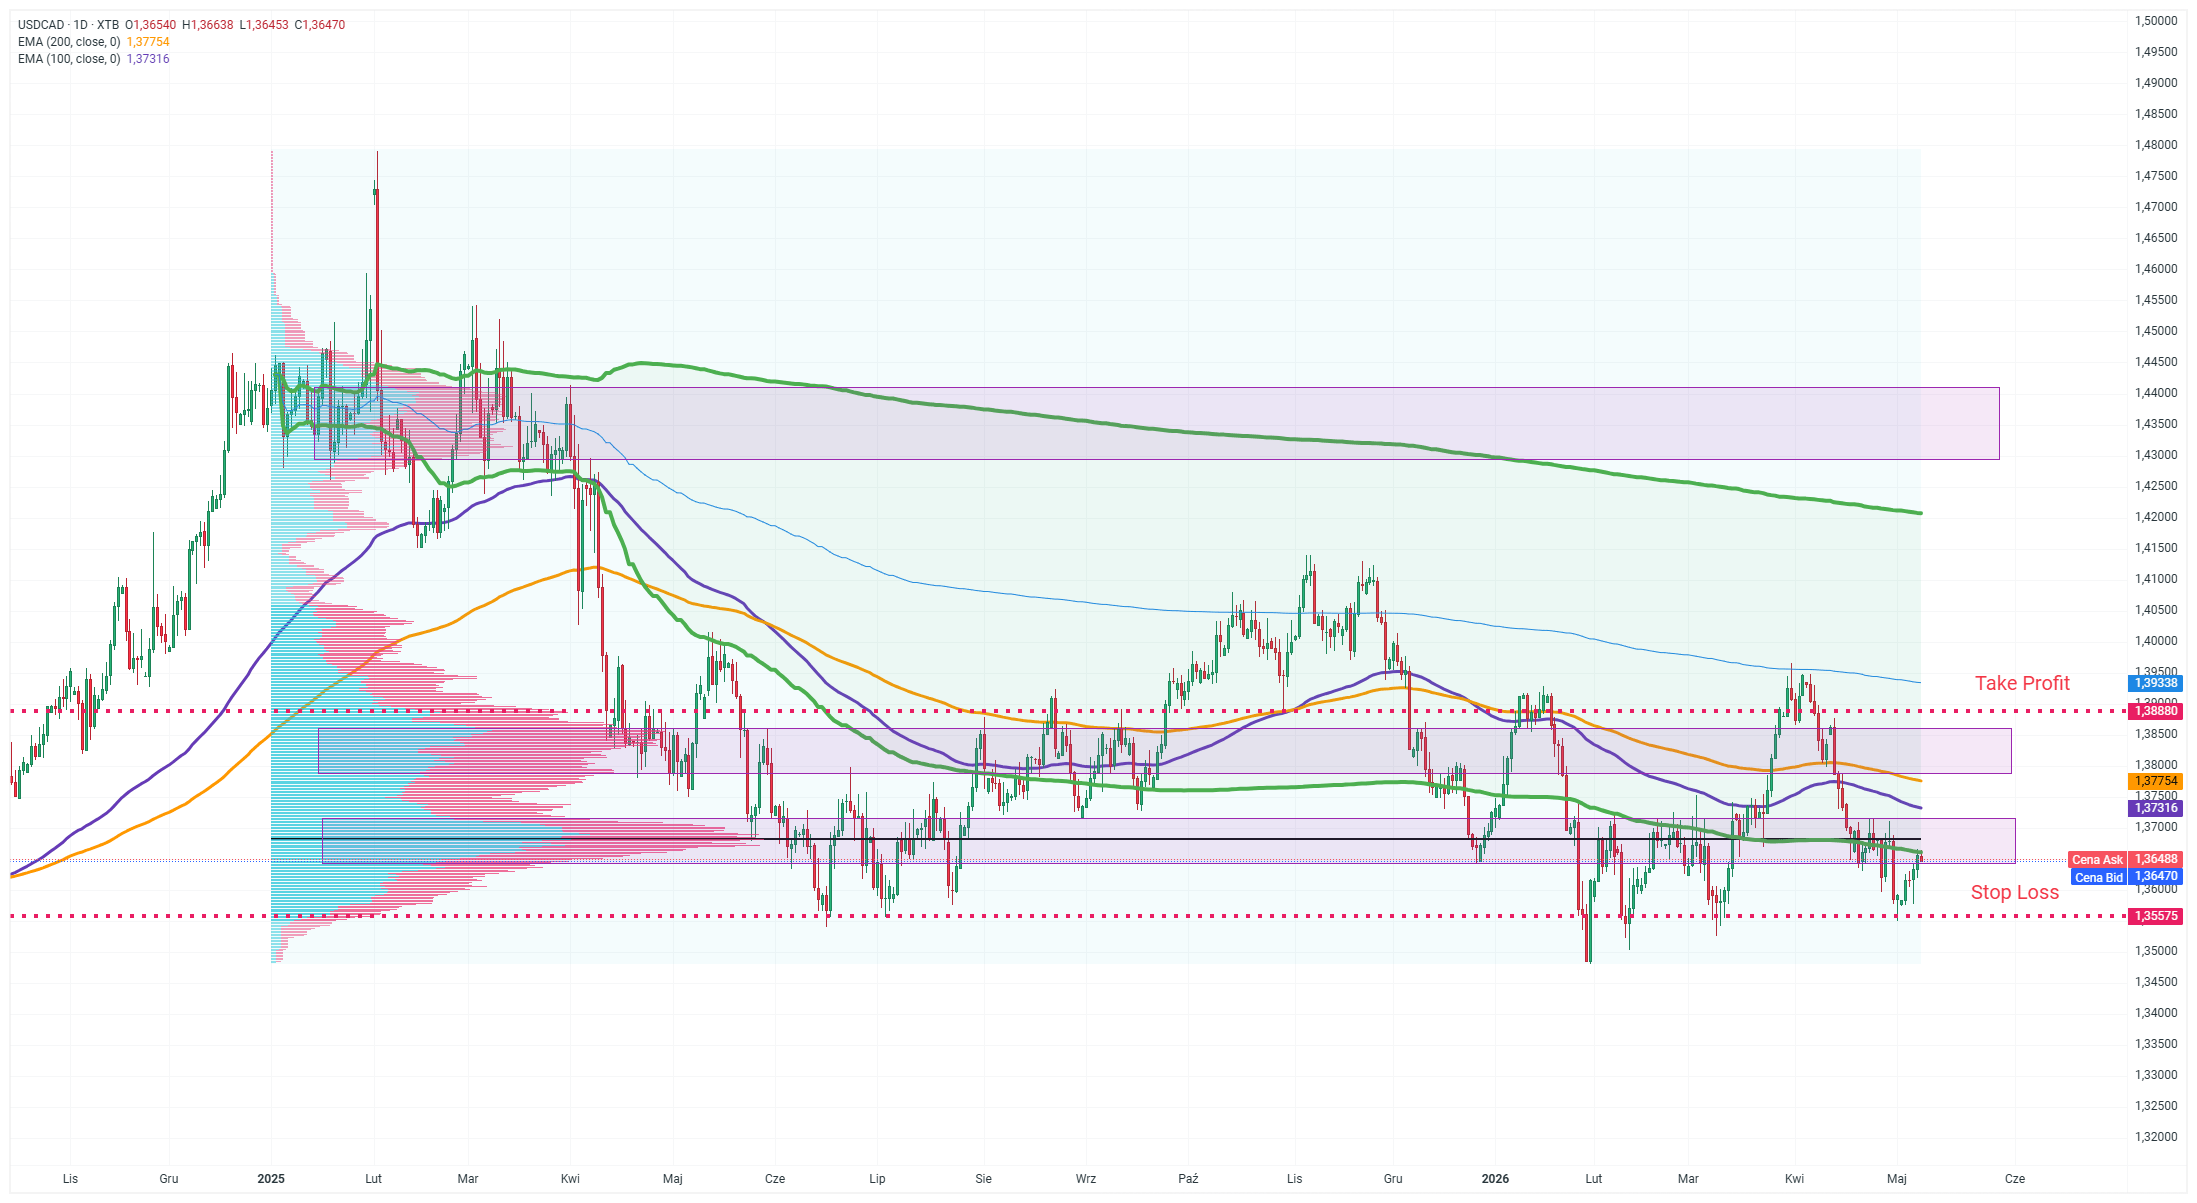
Theย USD/CADย pair reverses a modest Asian session dip on Tuesday and looks to build on the previous day’s modest rebound from sub-1.3600 levels, or the lowest since March 12. Spot prices currently trade around the 1.3630 region, though the upside potential seems limited amid a combination of diverging forces.

Mixed signals over US-Iran peace talks assist the US Dollar (USD) to attract some safe-haven flows and turn out to be a key factor acting as a tailwind for the USD/CAD pair. In fact, Iran reportedly gave the โ€ŒUS a new proposal on reopening the Strait of Hormuz and ending the war, with nuclear negotiations postponed for a โ€Œlater stage. However, the Wall Street Journal reported that US President Donald Trump was skeptical about Iran not dealing in good faith or being open to meeting his key demand of ending nuclear enrichment.

Meanwhile, continued disruptions to shipping through the critical Strait of Hormuz remain supportive of elevated Crude Oil prices, which underpins the commodity-linked Loonie and keeps a lid on the USD/CAD pair. Traders also seem reluctant to place aggressive directional bets and might opt to move to the sidelines ahead of this week’s key central bank event risks. The Bank of Canada (BoC) is scheduled to announce its policy decision on Wednesday, and will be followed by the outcome of the highly anticipated two-day FOMC meeting.

Investors will look for fresh cues about the future policyย outlookย amid expectations that the war-driven surge in energy prices will rekindle inflationary pressures. This, in turn, will play a key role in determining the next leg of a directional move for the USD/CAD pair. The mixed fundamental backdrop, in turn, makes it prudent to wait for strong follow-through buying before confirming that the pair’s recent fall, witnessed since the beginning of this month, has run its course and positioning for any meaningful recovery in the near term.

Currency Hedger No Comments

The CAD advances as oil prices gain on stalled USโ€“Iran peace talks

  • USD/CAD falls as the Canadian Dollar gains support from higher oil prices.
  • WTI rises after Trump canceled Pakistan talks delegation, heightening supply concerns.
  • Israel-Hezbollah clashes intensify despite a US-brokered ceasefire extension.

USD/CADย remains subdued for the second successive day, trading around 1.3660 during the Asian hours on Monday. The pair loses ground as the commodity-linked Canadian Dollar (CAD) receives support from higher oil prices, given Canadaโ€™s status as the largest crude exporter to the United States (US).

West Texas Intermediate (WTI) oil price receives support after registering 2.4% losses in the previous day, trading around $94.00 per barrel at the time of writing. Crude oil prices advance on rising supply concerns amid stalled USโ€“Iran peace talks. US President Donald Trump called off that delegation to Pakistan to potentially discuss directly with Iran.

President Trump on Saturday told Jared Kushner and Steve Witkoff to skip the trip to Pakistan, which is mediating talks, saying that Iran โ€œoffered a lot, but not enough. Iranian President Masoud Pezeshkian stated that his nation wonโ€™t enter โ€œimposed negotiations under threats or blockade.โ€

Meanwhile, traffic through the strategic waterway remains largely restricted due to Iranโ€™s controls and the US naval blockade, heightening fears of prolonged disruptions and providing further support to crude oil prices.

The USD/CAD pair is also subdued as the US Dollar (USD) extends its losses for the second successive day despite increased safe-haven demand as the ceasefire comes under strain, with Israel and Hezbollah escalating attacks despite a US-brokered extension meant to halt fighting for three weeks.

Currency Hedger No Comments

USD/CAD Price Forecast: Holds above 1.3700 to test nine-day EMA

  • USD/CAD may fall toward the descending channel support at 1.3560.
  • The 14-day Relative Strength Index falls to 44, signaling strengthening bearish momentum.
  • The immediate barrier lies at the nine-day EMA of 1.3714.

USD/CADย continues its winning streak for the fourth successive day, trading around 1.3710 during the early European hours on Friday. However, the technical analysis of the daily chart indicates the pair is remaining within the descending channel pattern, signaling a persistent bearish bias.

The USD/CAD pair holds a modest bearish near-term bias as spot remains capped under the nine-day Exponential Moving Average (EMA) and the 50-day EMA. The pair has been fading from last monthโ€™s highs while the 14-day Relative Strength Index (RSI) slips to 44, hinting at strengthening bearish momentum and leaving the downside vulnerable as long as price trades beneath these overlapping EMA barriers.

On the downside, the USD/CAD pair may navigate the region around the lower boundary of the descending channel around 1.3560. A sustained break below the channel would reinforce the bearish bias and put downward pressure on the pair to fall toward 1.3473, the lowest since September 2024.

The immediate barrier lies at the nine-day EMA of 1.3714, followed by the 50-day EMA at 1.3750, aligned with the upper descending channel boundary. Further advances above this confluence resistance zone would cause the emergence of the bullish bias and support the USD/CAD pair to explore the region around the four-month high of 1.3967, reached in December 2025.

USD/CAD: Daily Chart

Canadian Dollar Price Today

The table below shows the percentage change of Canadian Dollar (CAD) against listed major currencies today. Canadian Dollar was the weakest against the Japanese Yen.

USDEURGBPJPYCADAUDNZDCHF
USD0.06%0.04%-0.03%0.08%0.10%0.12%0.16%
EUR-0.06%-0.01%0.00%0.03%0.03%0.06%0.10%
GBP-0.04%0.00%-2.13%0.04%0.06%0.09%0.11%
JPY0.03%0.00%2.13%0.11%0.12%0.14%0.17%
CAD-0.08%-0.03%-0.04%-0.11%0.00%0.02%0.07%
AUD-0.10%-0.03%-0.06%-0.12%0.00%0.01%0.05%
NZD-0.12%-0.06%-0.09%-0.14%-0.02%-0.01%0.04%
CHF-0.16%-0.10%-0.11%-0.17%-0.07%-0.05%-0.04%

The heat map shows percentage changes of major currencies against each other. The base currency is picked from the left column, while the quote currency is picked from the top row. For example, if you pick the Canadian Dollar from the left column and move along the horizontal line to the US Dollar, the percentage change displayed in the box will represent CAD (base)/USD (quote).

Currency Hedger No Comments

Currency Talk – AUDCAD, NZDUSD, USDJPY

Key takeaways

  • What is the technical outlook for AUDCAD, NZDUSD, and USDJPY?

This analysis from the Overbalance series aims to identify three financial instruments, analyzed primarily on the daily/four-hour (D1/H4) timeframe. The analysis uses only the Overbalance methodology, which helps determine where a trend may continue or where a reversal might occur. Todayโ€™s analysis covers three instruments, evaluated solely in terms of 1:1 correction structures.

AUDCAD

Since late March, AUDCAD has been trending upward. The key level remains the support at 0.9755, which stems from the lower boundary of the local 1:1 pattern, as well as from previous local peaks. According to the Overbalance methodology, as long as the price remains above this level, the uptrend remains in effect. However, it is worth noting the lack of a clear demand reactionโ€”further tests of this support level could weaken it, increasing the risk of a breakout to the downside. Therefore, the 0.9755 level is critical in the short term for the direction of the market.

AUDCAD – H4 timeframe. Source: xStation

NZDUSD

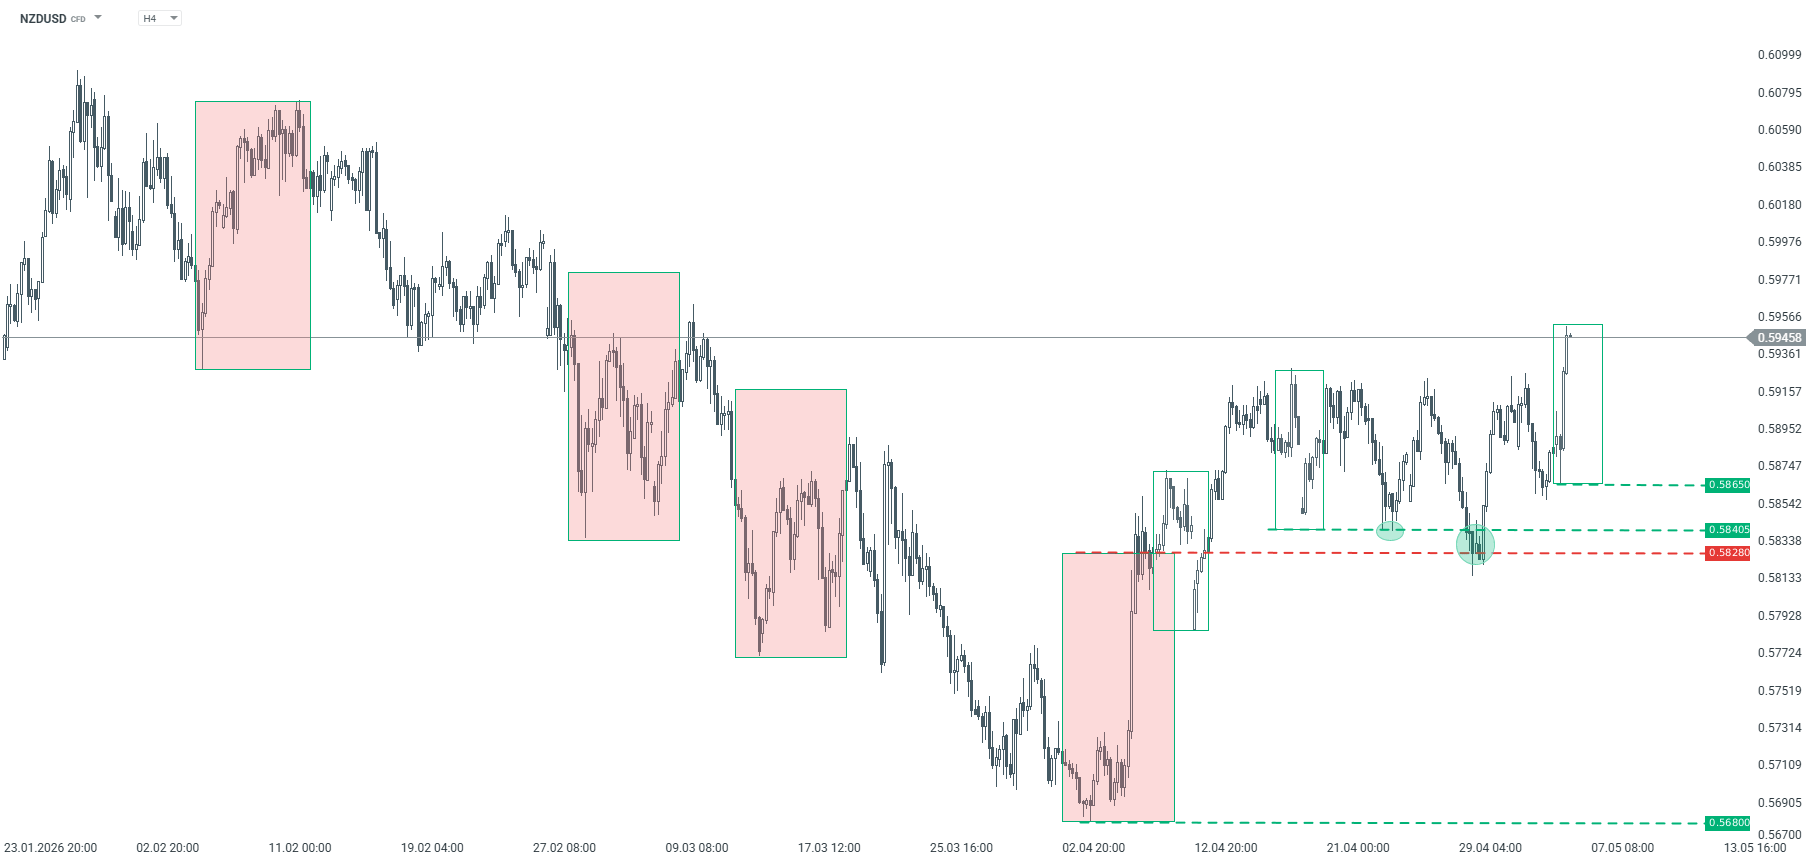
Since early April, the NZDUSD pair has been trending upward, but the market is currently testing key support at the 0.5840 level. Holding this level could trigger another upward move. Conversely, a break below this level and a return below 0.5828 could pave the way for a resumption of the downward trend. The current levels are therefore crucial for determining the short-term direction.

NZDUSD – H4 chart. Source: xStation

USDJPY

USDJPY has been trending upward for quite some time, but in April we saw a consolidation phase and two tests of support at the 158.10 level. This level was successfully defended, which supports the current uptrend. A break above the March 29 high would confirm the continuation of the uptrend. However, as long as support at 158.10 holds, the base case scenario is for further gains. A break below this level, however, could lead to a larger correction toward 155.11.

USDJPY – H4 chart. Source: xStation

Currency Hedger No Comments

CAD steadies as US Dollar firms on safe-haven demand

  • USD/CAD holds ground as the US Dollar remains firm on safe-haven demand amid persistent USโ€“Iran conflict uncertainty.
  • US intercepted two Iranian supertankers evading its blockade, as Tehran threatens vessels in the Strait of Hormuz.
  • Higher energy prices raise the likelihood of a more hawkish Bank of Canada stance.

USD/CADย remains flat following a three-day winning streak, trading around 1.3700 during the Asian hours on Friday. The pair steadies as the US Dollar (USD) maintains its position as safe-haven demand increases amid persistent uncertainty surrounding the United States (US)โ€“Iran conflict.

Bloomberg reported on Thursday that the US military intercepted two Iranian oil supertankers attempting to evade its blockade, as Washington presses ahead with efforts to curb Iranโ€™s shipping while Tehran continues to threaten vessels in the Strait of Hormuz. US military officials are also preparing contingency plans to target Iranโ€™s capabilities in the Strait should the current ceasefire collapse.

US President Donald Trump warned that if Iran does not move its oil, its infrastructure would be targeted. Iranian officials, however, denied agreeing to any extension of the truce and accused Washington of breaching it by maintaining a naval blockade on Iranian trade.

The Greenback also found additional support from resilient US economic data. Weekly Initialย Jobless Claimsย rose to 215K from 212K, indicating continued strength in the labor market. Meanwhile, S&P Global PMIs surprised to the upside, with Manufacturing at 54.0 and Services at 51.3, pointing to sustained expansion in business activity.

The latest data showed that higher energy prices lifted Canadaโ€™s annual consumer inflation by 0.6% to 2.4% in April, in line with Bank of Canada (BoC) warnings that rising energy costs are feeding into inflation expectations.

Elevated energy prices have increased the likelihood of a more hawkish response from the Bank of Canada. Oil and refined product prices moved sharply higher as commercial vessels transiting the Strait of Hormuz came under attack from both the US and Iran, reinforcing the risk of prolonged disruptions to tanker flows from the region.

Currency Hedger No Comments

Currency Talk – EURCAD, EURUSD, GBPUSD

The Overbalance analysis aims to identify three financial instruments, analyzed primarily on the daily/four-hour (D1/H4) timeframe. The analysis uses only the Overbalance methodology, which helps determine where a trend may continue or where it may reverse. Todayโ€™s analysis covers three instruments, evaluated solely in terms of 1:1 correction structures EURCAD Since March 10, EURCAD has been trading in an uptrend; however, during yesterdayโ€™s session, the local 1:1 bullish pattern was negated at the 1.6040 level. According to the Overbalance methodology, this may support a scenario involving a return to the downtrend. Further confirmation would be a return of the price below the 1.5948 level, i.e., back into the previous downtrend. On the other hand, a break above 1.6040 could restore the bullish scenario.

EURCAD – H4 timeframe. Source: xStation EURUSD Since mid-March, the EURUSD has been trending upward, but in recent days we have seen a downward correction. The price is approaching key support at the 1.1650 level, which stems from the lower boundary of the local 1:1 pattern. A potential bounce at this point could lead to the generation of another upward impulse. Conversely, a sustained break below the 1.1650 level would open the way for a return to the downtrend.

EURUSD – H4 chart. Source: xStation GBPUSD The GBPUSD pair is showing a situation very similar to that of the EURUSD. An uptrend has been in place since late March, but a correction has emerged in recent days. Should this correction deepen, the key support level remains at 1.3428. A break below this level could open the way for declines, which would be confirmed upon a drop below 1.3360โ€”the polarity of the previously negated 1:1 downward geometric pattern.

GBPUSD – H4 timeframe. Source: xStation

Currency Hedger No Comments

CAD flat lines as traders await US PMI data

  • USD/CAD holds steady near 1.3670 in Thursdayโ€™s early European session.ย 
  • Trump extended the ceasefire and vowed to continue the US blockade on Iranian ports.
  • Traders brace for the preliminary reading of the S&P Global US PMI report for April, which is due on Thursday.ย 

Theย USD/CADย pair trades on a flat note around 1.3670 during the early European session on Thursday. The pair steadies as traders await signs of diplomatic progress to end the war in the Middle East. ย 

The US is extending the ceasefire with Iran at Pakistanโ€™s request as US President Donald Trump waits for a unified proposal from Iran. Nonetheless, tensions remain high in the Middle East as Tehran keeps a tight grip on the Strait of Hormuz, controlling passage through the trade route and firing on ships. 

Iranโ€™s top negotiator and parliament speaker, Mohammad Bagher Ghalibaf, stated Israelโ€™s warmongering and โ€œflagrantโ€ ceasefire breaches made reopening the Strait of Hormuz “impossible.” Surging oil prices, driven by Middle East conflict risks, lift the commodity-linked Loonie. It is worth noting that Canada is a major oil-exporting country, and high crude oil prices generally have a positive impact on the Canadian Dollar (CAD). 

The preliminary reading of the S&P Global US Purchasing Managers Index (PMI) will be the highlight later on Thursday. The Manufacturing PMI figure is expected to improve slightly to 52.5 in April from 52.3 in the previous reading. Services PMI is projected to rise to 50.0 in April, versus 49.8 prior. If the reports show a stronger-than-expected outcome, this could underpin the Greenback against the CAD in the near term. 

Currency Hedger No Comments

USD/CAD Price Forecast: Hovers near 1.3650 as RSI remains bearish

  • USD/CAD trades sideways as a bullish piercing pattern emerges on the chart.
  • RSI remains bearish, suggesting downside pressure still dominates the trend.
  • Break above 1.3709 targets 1.3727 and 1.3742 resistance levels.

USD/CADย continues to trade laterally on Wednesday during the North American session, flattish at around 1.3658, as the pair seems capped by Monday’s price action, in which the Loonie appreciated 0.34% against the US Dollar (USD).

USD/CAD Price Forecast: Technical outlook

On Monday, the USD/CAD pair reached a daily high of 1.3709 and closed near the lows at 1.3644, extending a six-day streak of bearish sessions. Nevertheless, bulls moved in, finishing Tuesday in the green, up 0.15%, and forming a โ€˜bullish piercing pattern,โ€™ which requires clearing the current weekโ€™s high of 1.3709 for further upside.

Momentum remains shifted to the downside as depicted by the Relative Strength Index (RSI). Hence, if sellers move in and clear Tuesday’s swing low of 1.3631, a move towards the 1.3600 figure is on the cards. Below, the next area of interest is the March 9 daily low at 1.3525.

On the upside, buyers must clear the 1.3700 figure, with immediate resistance seen at the 50-day Simple Moving Average (SMA) at 1.3727. Up next is the 100-day SMA at 1.3742, with the next supply area at 1.3800.

USD/CAD Price Chart โ€“ Daily

USD/CAD daily chart