EUR/GBP softens to around 0.8655 in Monday’s early European session.
German Retail Sales declined by 0.3% MoM in April.
BoE’s Bailey signalled there was no urgency to raise interest rates.
The EUR/GBP cross trades in negative territory near 0.8655 during the early European trading hours on Monday. The Euro (EUR) remains weak against the British Pound (GBP) following the upbeat German Retail Sales data. The preliminary reading of the Harmonized Index of Consumer Prices (HICP) from the Eurozone will be released on Tuesday.
Data released by Destatis on Monday showed that German Retail Sales, a key measure of consumer spending, fell 0.3% MoM in April. This figure followed a fall of 0.3% (revised from -2.0%) and came in better than the market expectation of a 0.4% decrease.
On an annualized basis, Retail Sales dropped 0.3% in April, versus the prior release of a 0.2% decline (revised from -2.0%). The German economic data fails to boost the EUR in an immediate reaction.
On the UK’s front, BoE governor Andrew Bailey said on Friday that the UK central bank is in no rush to raise interest rates while the outcome of the Iran war remains uncertain and the UK’s growth rate stays weak. “We have to monitor the situation in the Middle East and how it affects the UK economy and inflation very closely and adjust policy as required,” said Bailey.
Money market futures now imply 32 basis points (bps) of tightening this year, one quarter-point hike, and roughly a 30% chance of a second, according to Reuters.
EUR/JPY may retest the upper boundary of the descending channel around 186.00.
The 14-day Relative Strength Index of 57 suggests upward momentum should persist.
The primary support appears at the nine-day EMA at 185.33.
EUR/JPY steadies after six days of gains, trading around 185.70 during the Asian hours on Monday. The currency cross is maintaining a constructive bullish bias as it holds above both the nine-day and 50-day Exponential Moving Averages (EMAs).
The alignment of price over short- and medium-term moving averages hints at sustained underlying demand, while the 14-day Relative Strength Index (RSI) around 57 stays in positive territory without yet signaling overbought conditions, suggesting upside pressure could persist as long as these floors remain intact.
The technical analysis of the daily chart suggests the EUR/JPY cross is positioned near the upper boundary of the descending channel pattern around 186.00. The sustained break above the channel would indicate bullish confirmation. Further advance would support the EUR/JPY cross to explore the region around the all-time high of 187.95, recorded on April 17.
On the downside, the primary support lies at the nine-day EMA at 185.33, followed by the 50-day EMA of 184.98. A break below moving averages would revive the bearish bias and put downward pressure on the EUR/JPY cross to navigate the region around the three-month low of 181.87, recorded on March 16, followed by nearly six-month low of 180.81, reached on February 12.
EUR/JPY: Daily Chart
Euro Price Today
The table below shows the percentage change of Euro (EUR) against listed major currencies today. Euro was the weakest against the British Pound.
USD
EUR
GBP
JPY
CAD
AUD
NZD
CHF
USD
0.10%
-0.04%
0.13%
0.08%
-0.02%
0.31%
0.28%
EUR
-0.10%
-0.12%
0.00%
-0.02%
-0.07%
0.23%
0.16%
GBP
0.04%
0.12%
0.15%
0.10%
-0.02%
0.33%
0.27%
JPY
-0.13%
0.00%
-0.15%
-0.03%
-0.13%
0.21%
0.14%
CAD
-0.08%
0.02%
-0.10%
0.03%
-0.11%
0.23%
0.18%
AUD
0.02%
0.07%
0.02%
0.13%
0.11%
0.28%
0.27%
NZD
-0.31%
-0.23%
-0.33%
-0.21%
-0.23%
-0.28%
-0.05%
CHF
-0.28%
-0.16%
-0.27%
-0.14%
-0.18%
-0.27%
0.05%
The heat map shows percentage changes of major currencies against each other. The base currency is picked from the left column, while the quote currency is picked from the top row. For example, if you pick the Euro from the left column and move along the horizontal line to the US Dollar, the percentage change displayed in the box will represent EUR (base)/USD (quote).
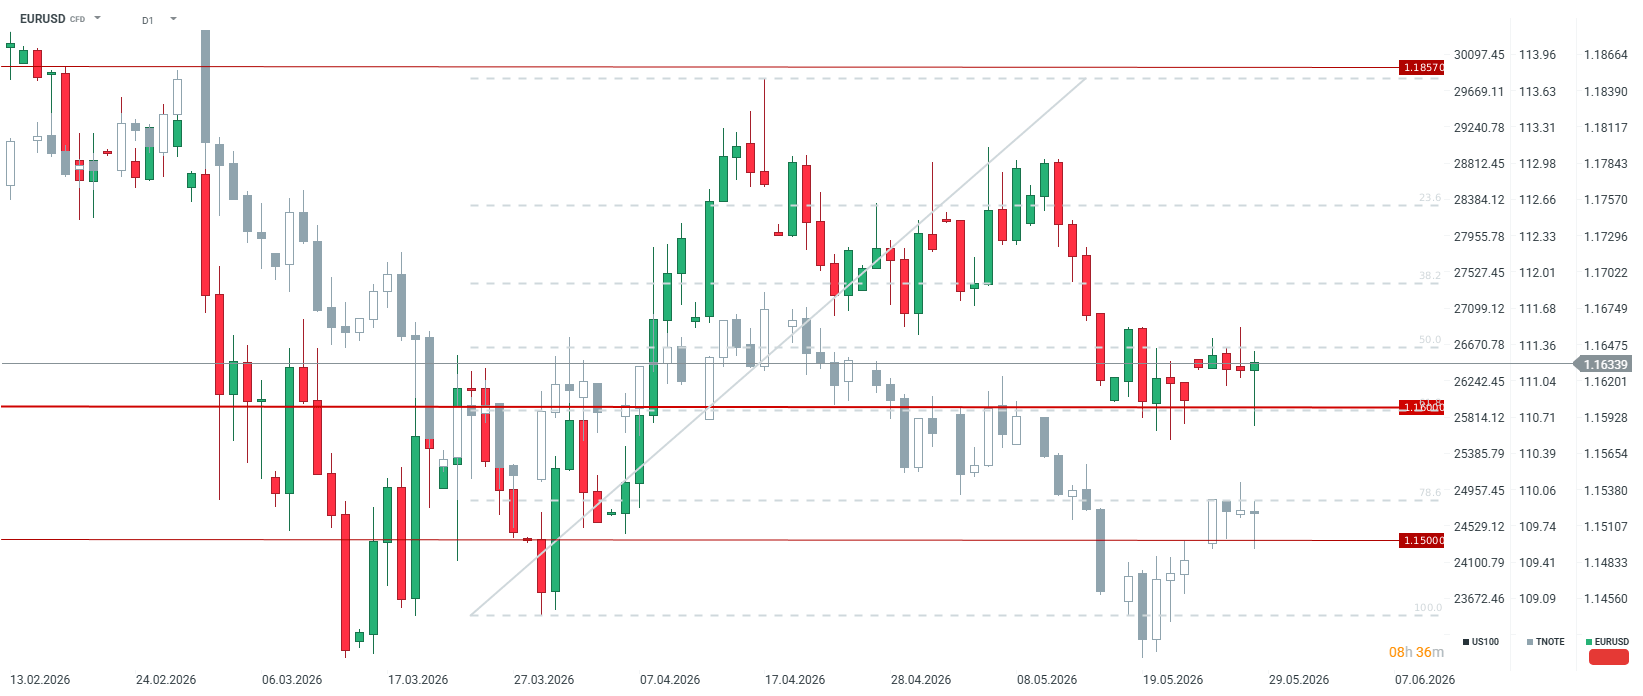
EUR/USD edges down to near 1.1645 as the US Dollar trades slightly higher.
This week, major triggers will be the flash Eurozone HICP and the US NFP data for May.
The removal of Iran’s uranium enrichment remains the key demand by the US for a permanent peace deal.
The EUR/USD pair trades slightly lower to near 1.1645 during the Asian trading session on Monday. The major currency pair faces marginal selling pressure as the US Dollar (USD) ticks up, with investors awaiting key United States (US) economic releases this week, especially the Nonfarm Payrolls (NFP) data for May.
As of writing, the US Dollar Index (DXY), which tracks the Greenback’s value against six major currencies, trades 0.1% higher to near 99.03.
Investors will pay close attention to the US NFP data to get fresh cues on the Federal Reserve’s (Fed) monetary policy outlook. Later in the day, market participants will focus on the US ISM Manufacturing PMI data for May, which will be published at 14:00 GMT.
In the Eurozone, investors await the preliminary Harmonized Index of Consumer Prices (HICP) data for May, which will be released on Tuesday. The inflation data will influence market expectations for the European Central Bank’s (ECB) monetary policy outlook.
On the geopolitical front, negotiations between the US and Iran regarding a permanent peace deal remain ongoing, with Washington hardening its stance on Tehran destroying its uranium dust and giving up its nuclear ambitions.
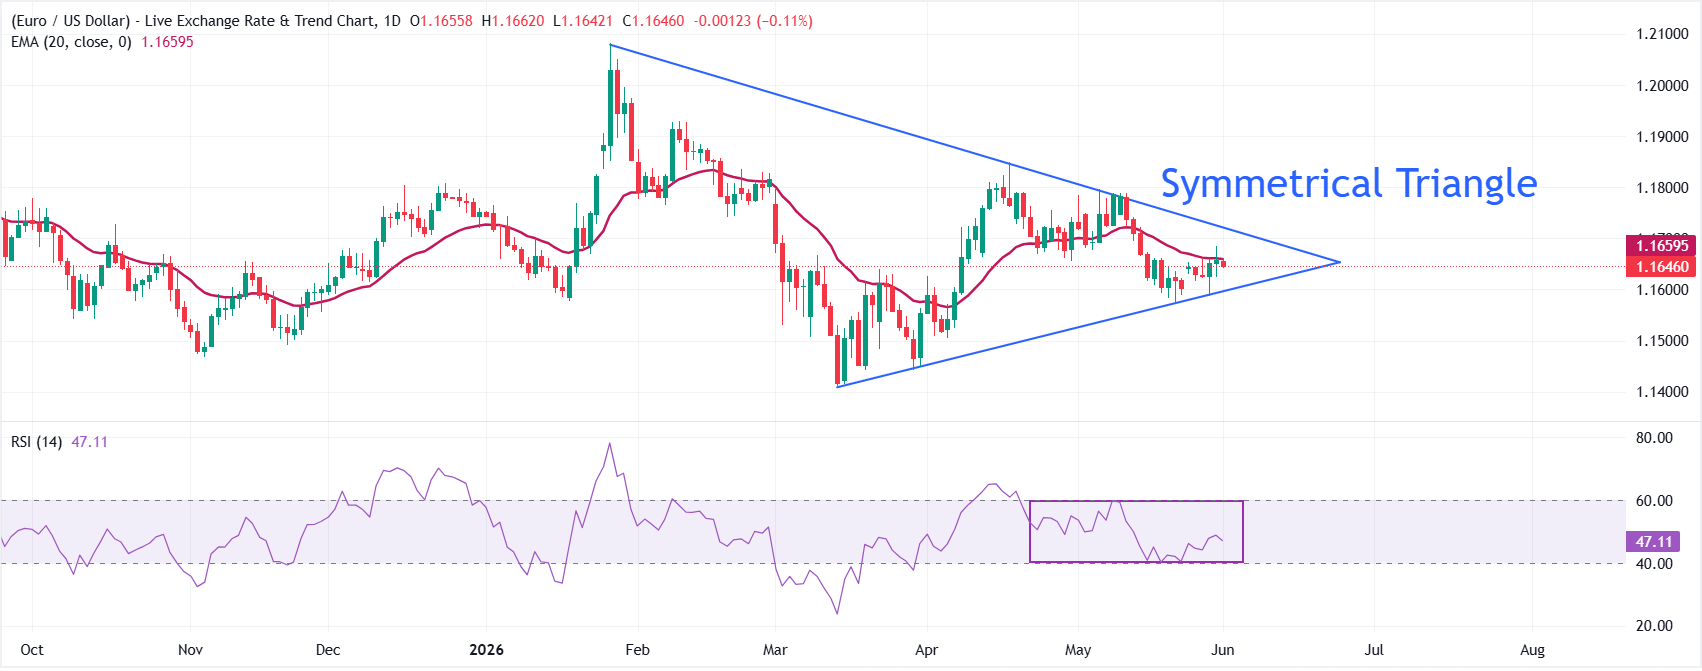
EUR/USD technical analysis
EUR/USD ticks lower at around 1.1645 in the Asian trade. The 20-day Exponential Moving Average (EMA) near 1.1646 acts as a key barrier for the Euro bulls. The pair holds just above the upward-sloping border of the Symmetrical Triangle formation near 1.1599.
The Relative Strength Index (14) has slipped to around 47, suggesting fading bullish momentum and reinforcing the idea of consolidation with a bearish lean rather than a decisive recovery.
On the topside, the 20-day EMA is the immediate resistance, followed by the downward-sloping border of the Triangle formation around 1.1719. On the downside, the first line of defense sits at the former ascending trend-line break at 1.1599; a sustained move below that support would expose a deeper pullback towards 1.1500.
g toward EURUSD. If the ECB ultimately decides to raise rates, the euro could benefit in the short term, although the central bank would risk further weakening economic activity in exchange for making additional progress in the fight against inflation. On the other hand, a decision to leave rates unchanged—despite markets being almost fully convinced of a hike—could weigh on the euro and pressure EURUSD, which is currently trading within an interesting technical formation.
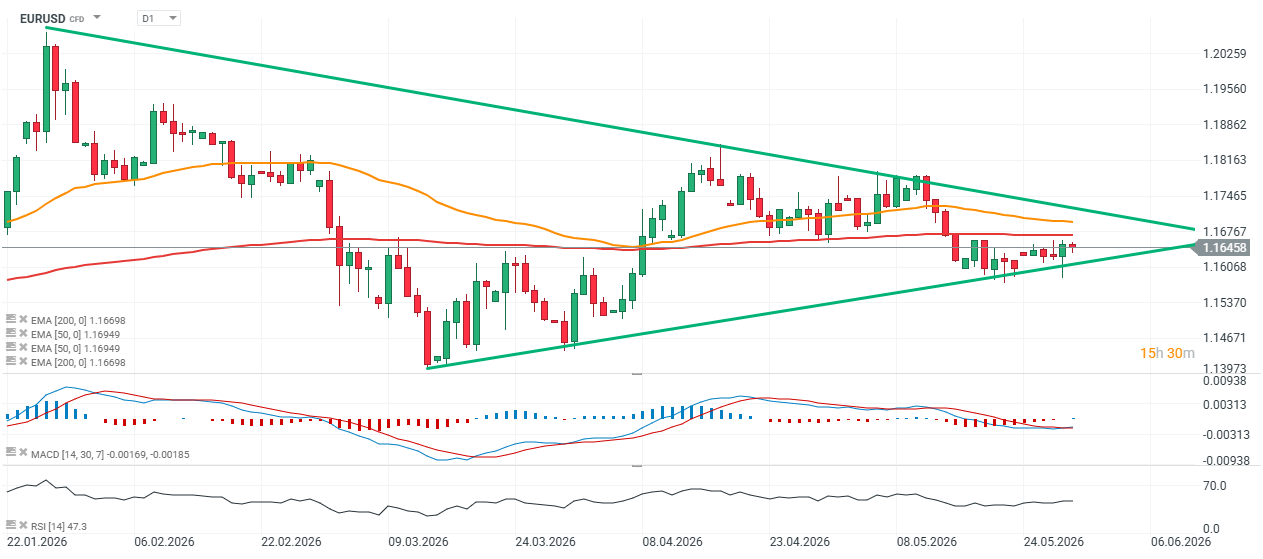
Technical Analysis (D1 Timeframe)
On the daily chart, EURUSD remains trapped within a medium-term symmetrical triangle , a consolidation pattern that has been developing since March. The pair is now trading very close to the apex of the formation, suggesting that a breakout and a stronger directional move may be approaching. Price is currently oscillating around the 50-day EMA (1.1695) and the 200-day EMA (1.1670) . The two moving averages are trading very close to each other, confirming the lack of a clear trend and highlighting the market’s transition into a balanced, range-bound environment. EURUSD remains slightly below the 50-day EMA but above the 200-day EMA, maintaining a broadly neutral technical setup. The upper boundary of the triangle is currently located around 1.1680–1.1700 , while key support can be found near 1.1630–1.1650 . The market has respected both boundaries multiple times, with April and May highs repeatedly stalling near resistance and March and May lows establishing a rising support line. From a technical perspective, breakouts from symmetrical triangles often lead to sharp directional moves, particularly when they occur close to the apex of the pattern. MACD and RSI The MACD remains below the zero line, although the histogram is clearly reducing its negative readings. This suggests:
Fading bearish momentum,
The potential emergence of a bullish signal if the MACD line crosses above the signal line.
While this is not yet a definitive buy signal, selling pressure appears to be weakening. Meanwhile, the RSI is hovering around 48 , almost exactly at neutral territory. This leaves room for both an upside breakout and a downside move without indicating either overbought or oversold conditions. Key Levels to WatchSupport:
1.1640–1.1650 (lower boundary of the triangle)
1.1600
1.1540
Resistance:
1.1680–1.1700 (upper boundary of the triangle)
1.1760
1.1820–1.1850
Bullish Scenario
A break above 1.1700 accompanied by a daily close above the upper boundary of the triangle would represent the first major signal of renewed bullish momentum. In such a scenario, EURUSD could initially target the 1.1760 area before potentially retesting April highs near 1.1820–1.1850 . Bearish Scenario If the pair fails to overcome resistance and instead breaks below support around 1.1640 , the risk of a move toward 1.1600 and subsequently 1.1540 would increase significantly. Such a breakout would also be supported by the MACD remaining below the zero line.
Conclusion
From a technical standpoint, EURUSD is currently at an equilibrium point. The most important feature on the chart remains the narrowing symmetrical triangle, which points to an approaching breakout. As long as the pair remains trapped between 1.1640 and 1.1700 , neither bulls nor bears have a clear advantage. However, the gradual fading of bearish momentum on the MACD slightly increases the probability of an upside breakout attempt in the coming sessions.
Source: xStation5
The material on this page does not constitute financial advice and does not take into account your level of understanding, investment objectives, financial situation or any other specific needs. All information provided, including opinions, market research, mathematical results and technical analyzes published on the Website or transmitted To you by other means, it is provided for information purposes only and should in no way be construed as an offer or solicitation for a transaction in any financial instrument, nor should the information provided be construed as advice of a legal or financial nature on which any investment decisions you make should be based exclusively To your level of understanding, investment objectives, financial situation, or other specific needs, any decision to act on the information published on the Website or sent to you by other means is entirely at your own risk if you In doubt or unsure about your understanding of a particular product, instrument, service or transaction, you should seek professional or legal advice before trading. Investing in CFDs carries a high level of risk, as they are leveraged products and have small movements Often the market can result in much larger movements in the value of your investment, and this can work against you or in your favor. Please ensure you fully understand the risks involved, taking into account investments objectives and level of experience, before trading and, if necessary, seek independent advice.
EUR/USD softens to near 1.1635 in Friday’s early European session.
The US and Iran are getting closer, but they have not yet reached a deal.
ECB rate hike bets might help limit the Euro’s losses.
The EUR/USD pair loses momentum to around 1.1635 during the early European trading hours on Friday. Mixed signals surrounding the US-Iran peace deal remain the primary driver of volatility. Traders will keep an eye on the preliminary readings of Germany’s inflation later on Friday.
The White House confirmed that the US and Iran have reached an agreement on a memorandum of understanding (MoU) to extend the ceasefire for 60 days to allow for formal negotiations, but US President Donald Trump has yet to give his approval. US Vice-President JD Vance said on Friday that the US and Iran still need to work out several sticking points before an agreement on the war can be reached.
Traders will closely monitor the developments surrounding the Middle East conflict. Any signs of rising tensions between the US and Iran could weigh on the Euro (EUR) against the US Dollar (USD). On the other hand, progress on the peace deal could underpin the riskier assets such as the shared currency in the near term.
Hawkish remarks from the European Central Bank (ECB) policymakers could lift the EUR. ECB board member Isabel Schnabel stated that the central bank should raise interest rates in June, even if ongoing peace talks with Iran yield a deal, as the conflict has been far longer than projected and high energy prices are spilling into the broader economy.
Financial markets have fully priced in two hikes in the ECB’s 2% deposit rate and see a nearly 50% chance of a third move over the next year. Economists are more cautious and see just two rates rise, followed by a cut in mid-2027, a Reuters poll showed.
Weaker US data, in-line inflation, hawkish ECB minutes, and increased Iranian compliance trigger a sharp rebound in the EURUSD pair. A noticeable shift has taken place in the financial markets over the last few hours. The exchange rate of the major currency pair, EURUSD , recorded a sharp rebound after earlier, steeper declines briefly pushed it below the 1.16 level. The euro is currently gaining around 0.1% against the US dollar, trading around the 1.1630 mark. This move stems from a combination of disappointing macroeconomic data from the US, hawkish signals from the European Central Bank, and new developments on the geopolitical front.
Weaker US Macro Data and Inflation Relief
The main catalyst for the weakening of the greenback came from the latest macroeconomic releases from across the Atlantic, which cooled investors’ hawkish fears:
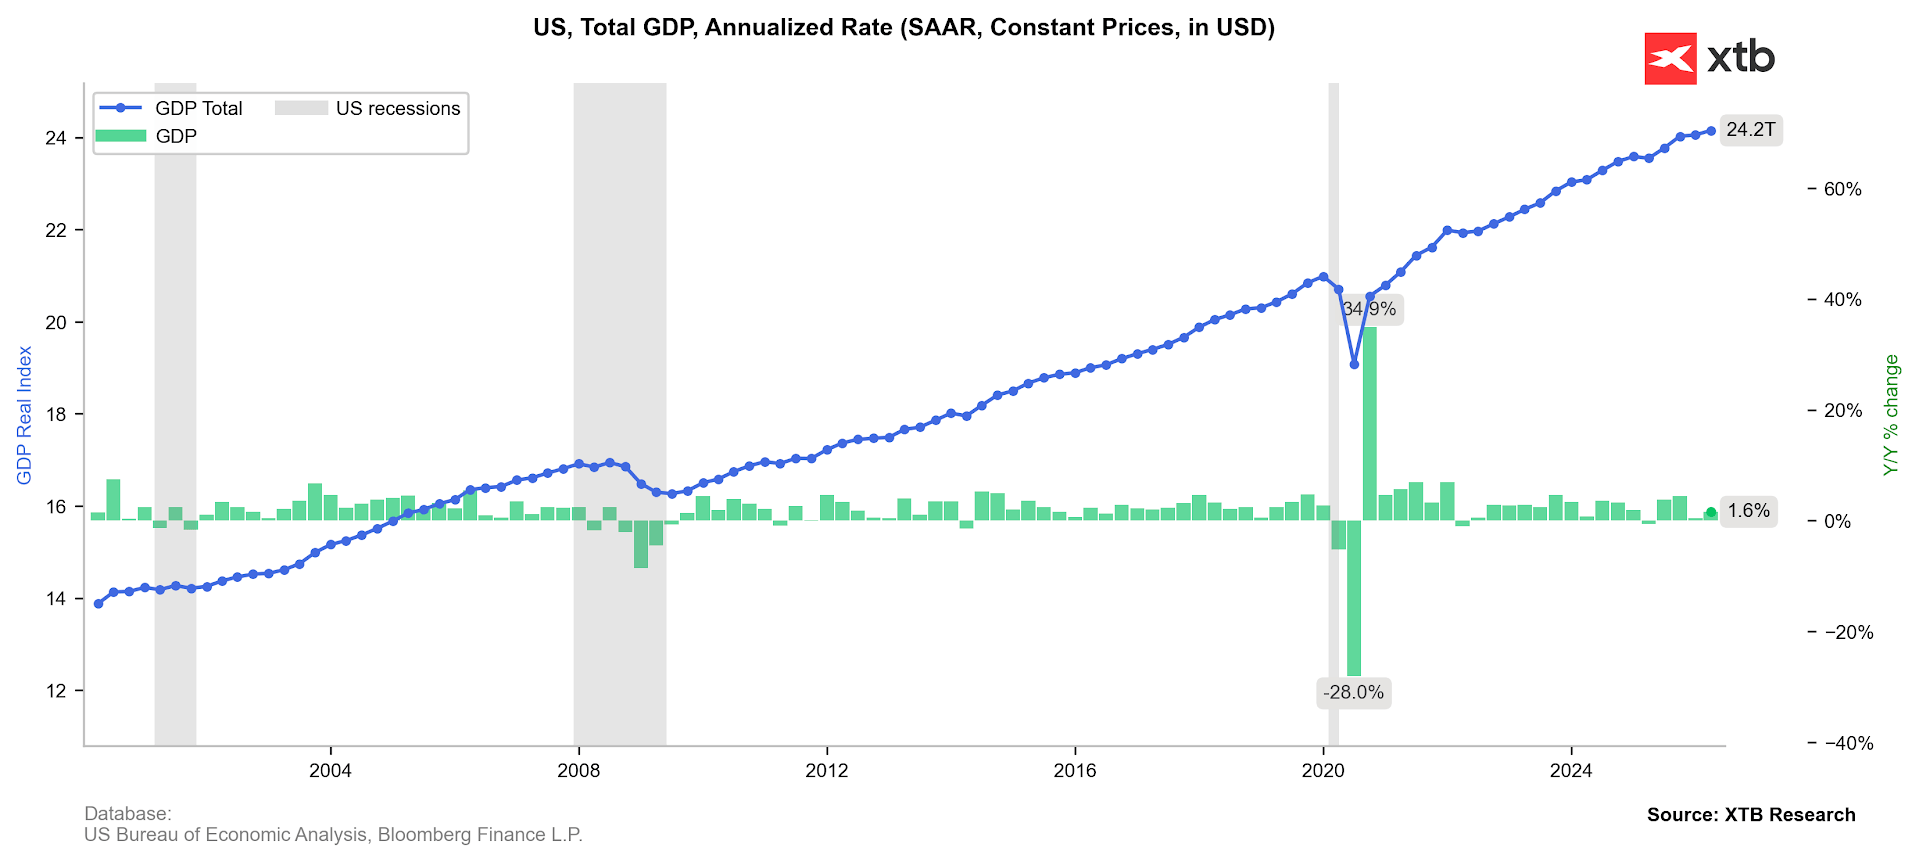
Disappointing GDP Growth: The US Bureau of Economic Analysis published its second revision of Q1 GDP, lowering the economic growth estimate to 1.6% from the previous 2.0%. The market widely expected the figure to hold steady at 2.0%.
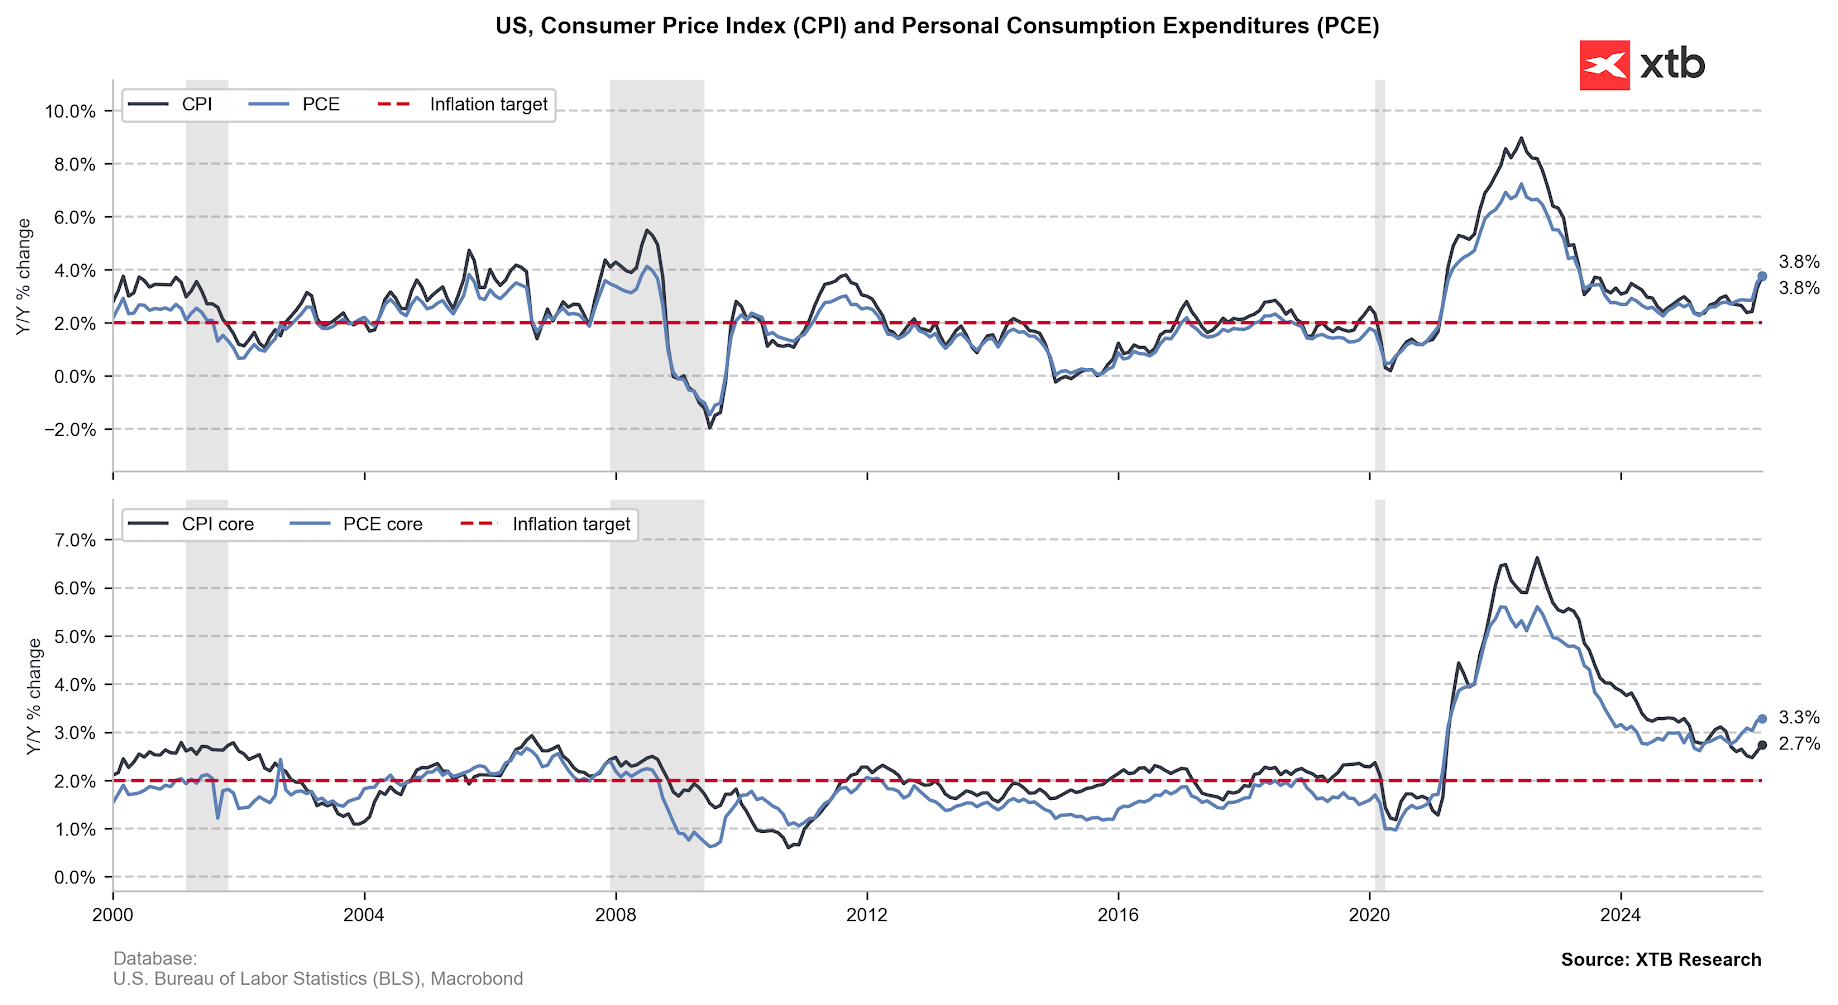
PCE Inflation In-Line with Expectations: The headline Personal Consumption Expenditures (PCE) price index, the Fed’s preferred inflation gauge, rose to 3.8% year-over-year in April (up from 3.5% in March), which was fully in line with market consensus.
Core PCE Stabilization: The Core PCE index (excluding food and energy prices) came in at 3.3% annually, also matching expectations. Furthermore, on a monthly basis, core inflation increased by 0.2%, coming in slightly below forecasts of 0.3%.
The Q1 GDP revision shows lower economic growth. The fact that the conflict with Iran was already underway in March may suggest that Q2 data will also face a substantial negative impact from this front. Source: Bloomberg Finance LP, XTB
PCE inflation rebounds in line with expectations. This stands in stark contrast to the CPI inflation release, which surprised investors with noticeably higher readings. Source: Bloomberg Finance LP The fact that inflation did not surprise to the upside, despite a massive surge in commodity prices, brought relief to investors. Combined with the clear slowdown in GDP momentum, this translated into a decline in the dollar index. In-line inflation and weaker growth could damp market expectations regarding swift rate hikes from the Fed.
Hawkish ECB and Pressure on the Eurozone
While the US economy sends signs of cooling, information supporting the common currency is flowing in from Europe. The published account of the European Central Bank’s April meeting (the so-called minutes) clearly indicates that pro-inflationary risk factors in the Eurozone have significantly intensified. ECB officials highlighted mounting price pressures, suggesting that the European regulator may be forced to keep interest rates at restrictive levels for a longer period. The divergence in monetary policy outlooks between a potentially softer Fed and an inflation-wary ECB provided a strong impetus for the strengthening of the EURUSD.
The market is currently pricing in a staggering 93% probability of an ECB hike in June . Geopolitics: Sanctions and a Potential Nuclear Breakthrough Concurrently, market attention remains focused on the Middle East. Energy commodity prices rose amid renewed clashes between US and Iranian forces in the Persian Gulf region. WTI crude oil surged by over 3% during the morning European session. The situation was further exacerbated by the decision of US Treasury Secretary Scott Bessent, who announced sanctions against a new Iranian institution that had unilaterally declared control over the Strait of Hormuz. However, market sentiment improved following reports from Saudi Arabia’s Al Hadath news channel. According to these reports, Islamabad is set to propose a compromise to Washington under which Iranian uranium would be transferred to Beijing under strict international supervision. Such a diplomatic move could significantly de-escalate the regional conflict, shaving some risk premium off the markets and dampening the safe-haven demand for assets like the dollar. On the other hand, Trump recently stated that he does not want to agree to Iranian uranium ending up in either Russia or China.
Technical Outlook on EURUSD
The combination of lower-than-expected US economic growth data, a hawkish tone from the ECB, and a potential diplomatic breakthrough regarding the Iranian nuclear program provided solid ground for a sharp EURUSD rebound. Investors gained arguments suggesting that the US central bank will not be forced into immediate policy tightening. The EURUSD closing with such a pronounced candlestick shadow could suggest that key support at the 1.16 level is holding, creating the potential to test resistance at the 50.0% retracement level .
EUR/GBP struggles to extend gains beyond 0.8660 but remains steady above 0.8650.
Risk appetite has faltered on Thursday as the US and Iran exchange attacks.
ECB-BoE monetry policy divergence keeps the pair buoyed.
The Euro (EUR) is trading flat against the British Pound (GBP) on Thursday. EUR/GBP bulls are struggling to find acceptance above 0.8660 following a 0.4% rally over the previous two days, although downside attempts remain contained above 0.8655 so far.
Speculative demand for the common currency is faltering on Thursday as market sentiment sours and Oil prices jump with tensions between the US and Iran escalating again.
The US military launched fresh strikes on Iranian military sites in the province of Bandar Abbas that, according to the US Central Command (Centcom), “posed a threat around the Strait of Hormuz.” Iran’s Islamic Revolutionary Guard Corps (IRGC) affirmed that they targeted US bases in the Gulf region, and Kuwait authorities reported interceptions of hostile drone and missile attacks.
ECB-BoE monetary policy divergence
The Euro, however, remains fairly steady, favoured by monetary policy divergence between the European Central Bank (ECB) and the Bank of England (BoE). Futures markets are pricing a 91% chance that the ECB will hike interest rates at its June 11 meeting, according to data by the ECB Watch Tool. The BoE, on the contrary, is not expected to tighten its monetary policy anytime soon.
The ECB Chief Economist, Philip Lane, warned on Thursday that inflationary consequences from the US-Iran war will outlast the conflict and that the bank must prevent the general belief that inflation will remain high for a long time to take hold.
Later on Thursday, ECB President Christine Lagarde is expected to take part in a central bankers’ meeting, and her comments on monetary policy will be listened to with particular interest.
EUR/JPY weakens to around 185.10 in Thursday’s early European session.
The cross keeps the bullish vibe, but further consolidation cannot be ruled out in near term with neutral RSI momentum.
The immediate resistance to watch is 185.65; the initial support level is seen at 184.70.
The EUR/JPY cross loses momentum to near 185.10 during the early European session on Thursday. Escalations in the US-Iran conflict boost the safe-haven currency, such as the Japanese Yen (JPY) and act as a headwind for the cross.
CNN reported on Thursday that Iran’s Islamic Revolutionary Guard Corps (IRGC) launched an attack targeting an American air base, which they said was the source of US strikes on Iranian targets hours before. The US strikes targeted Iranian drones and a launch site near the Strait of Hormuz.
Traders will keep an eye on the Tokyo May Consumer Price Index (CPI) inflation report, which is due later on Friday. In case of a softer-than-expected Tokyo CPI print, this could drag the Japanese Yen lower against the Euro (EUR) in the near term.
Technical Analysis:
In the daily chart, EUR/JPY holds a mild bullish bias as it trades above the 100-day simple moving average and the Bollinger Bands middle line near 184.71, keeping the broader uptrend underpinned. The Relative Strength Index (RSI) hovers around 50, suggesting consolidative but still slightly constructive momentum while price drifts toward the upper Bollinger band.
On the topside, the immediate resistance is the Bollinger upper band around 185.65, and a clear break above this ceiling would open the way for a renewed extension of the advance. On the downside, initial support is seen at the Bollinger middle band near 184.70 and the 100-day SMA at 184.40, with the lower Bollinger band near 183.78 acting as a deeper cushion if a corrective pullback develops.
To provide the best experiences, we use technologies like cookies to store and/or access device information. Consenting to these technologies will allow us to process data such as browsing behavior or unique IDs on this site. Not consenting or withdrawing consent, may adversely affect certain features and functions.
Functional
Always active
The technical storage or access is strictly necessary for the legitimate purpose of enabling the use of a specific service explicitly requested by the subscriber or user, or for the sole purpose of carrying out the transmission of a communication over an electronic communications network.
Preferences
The technical storage or access is necessary for the legitimate purpose of storing preferences that are not requested by the subscriber or user.
Statistics
The technical storage or access that is used exclusively for statistical purposes.The technical storage or access that is used exclusively for anonymous statistical purposes. Without a subpoena, voluntary compliance on the part of your Internet Service Provider, or additional records from a third party, information stored or retrieved for this purpose alone cannot usually be used to identify you.
Marketing
The technical storage or access is required to create user profiles to send advertising, or to track the user on a website or across several websites for similar marketing purposes.